Free Statistics

of Irreproducible Research!

Author's title

Author*Unverified author*
R Software Modulerwasp_autocorrelation.wasp
Title produced by software(Partial) Autocorrelation Function
Date of computationWed, 17 May 2017 19:50:41 +0100
Cite this page as followsStatistical Computations at FreeStatistics.org, Office for Research Development and Education, URL https://freestatistics.org/blog/index.php?v=date/2017/May/17/t14950471182b9zx6jbl6nxavb.htm/, Retrieved Fri, 17 May 2024 08:10:32 +0200
Statistical Computations at FreeStatistics.org, Office for Research Development and Education, URL https://freestatistics.org/blog/index.php?pk=, Retrieved Fri, 17 May 2024 08:10:32 +0200
QR Codes:

Original text written by user:
IsPrivate?No (this computation is public)
User-defined keywords
Estimated Impact0
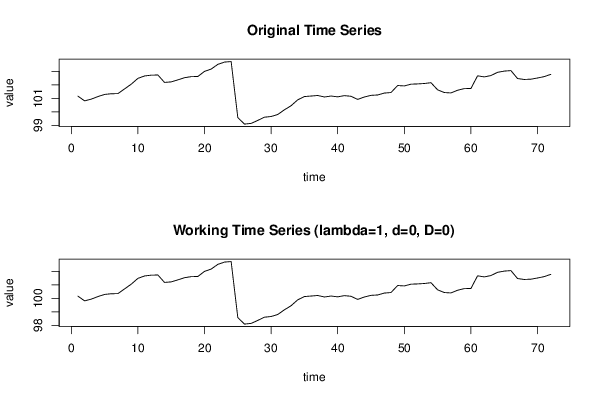
Dataseries X:
101,16
100,81
100,94
101,13
101,29
101,34
101,35
101,7
102,05
102,48
102,66
102,72
102,73
102,18
102,22
102,37
102,53
102,61
102,62
103
103,17
103,52
103,69
103,73
99,57
99,09
99,14
99,36
99,6
99,65
99,8
100,15
100,45
100,89
101,13
101,17
101,21
101,1
101,17
101,11
101,2
101,15
100,92
101,1
101,22
101,25
101,39
101,43
101,95
101,92
102,05
102,07
102,1
102,16
101,63
101,43
101,4
101,6
101,72
101,73
102,67
102,59
102,69
102,93
103,02
103,06
102,47
102,4
102,42
102,51
102,61
102,78


Summary of computational transaction
Raw Inputview raw input (R code)
Raw Outputview raw output of R engine
Computing time3 seconds
R Server'Herman Ole Andreas Wold' @ wold.wessa.net

\begin{tabular}{lllllllll}
\hline
Summary of computational transaction \tabularnewline
Raw Input & view raw input (R code)  \tabularnewline
Raw Output & view raw output of R engine  \tabularnewline
Computing time & 3 seconds \tabularnewline
R Server & 'Herman Ole Andreas Wold' @ wold.wessa.net \tabularnewline
\hline
\end{tabular}
%Source: https://freestatistics.org/blog/index.php?pk=&T=0

[TABLE]
[ROW][C]Summary of computational transaction[/C][/ROW]
[ROW][C]Raw Input[/C][C]view raw input (R code) [/C][/ROW]
[ROW][C]Raw Output[/C][C]view raw output of R engine [/C][/ROW]
[ROW][C]Computing time[/C][C]3 seconds[/C][/ROW]
[ROW][C]R Server[/C][C]'Herman Ole Andreas Wold' @ wold.wessa.net[/C][/ROW]
[/TABLE]
Source: https://freestatistics.org/blog/index.php?pk=&T=0

Globally Unique Identifier (entire table): ba.freestatistics.org/blog/index.php?pk=&T=0

As an alternative you can also use a QR Code:  

The GUIDs for individual cells are displayed in the table below:

Summary of computational transaction
Raw Inputview raw input (R code)
Raw Outputview raw output of R engine
Computing time3 seconds
R Server'Herman Ole Andreas Wold' @ wold.wessa.net


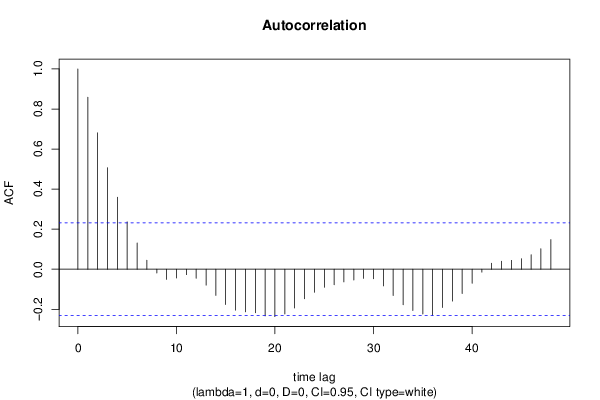
Autocorrelation Function
Time lag kACF(k)T-STATP-value
10.8586917.28620
20.6807775.77660
30.5063294.29632.7e-05
40.3596143.05140.001594
50.2363072.00510.024354
60.1308671.11040.135251
70.0447060.37930.352773
8-0.018749-0.15910.437021
9-0.050698-0.43020.334173
10-0.043957-0.3730.355127
11-0.027055-0.22960.409537
12-0.045268-0.38410.351015
13-0.079449-0.67410.251188
14-0.130761-1.10950.135444
15-0.176408-1.49690.069399
16-0.204468-1.7350.043513
17-0.212911-1.80660.037501
18-0.217279-1.84370.034673
19-0.233248-1.97920.025811
20-0.236907-2.01020.024077
21-0.223949-1.90030.030701
22-0.193568-1.64250.052425
23-0.147447-1.25110.107468
24-0.115269-0.97810.165652
25-0.090452-0.76750.222643
26-0.077771-0.65990.255709
27-0.063215-0.53640.296668
28-0.053919-0.45750.324339
29-0.045899-0.38950.34904
30-0.047645-0.40430.343602
31-0.083242-0.70630.24113
32-0.131201-1.11330.134647
33-0.177276-1.50420.068447
34-0.206489-1.75210.042006
35-0.223934-1.90010.03071
36-0.229946-1.95120.027465
37-0.191301-1.62320.054454
38-0.159269-1.35140.090392
39-0.121128-1.02780.15374
40-0.070203-0.59570.276624
41-0.014568-0.12360.450983
420.0296680.25170.400979
430.0397940.33770.368298
440.0441430.37460.354542
450.0523480.44420.32912
460.0721210.6120.271245
470.1022240.86740.194301
480.1476991.25330.107081

\begin{tabular}{lllllllll}
\hline
Autocorrelation Function \tabularnewline
Time lag k & ACF(k) & T-STAT & P-value \tabularnewline
1 & 0.858691 & 7.2862 & 0 \tabularnewline
2 & 0.680777 & 5.7766 & 0 \tabularnewline
3 & 0.506329 & 4.2963 & 2.7e-05 \tabularnewline
4 & 0.359614 & 3.0514 & 0.001594 \tabularnewline
5 & 0.236307 & 2.0051 & 0.024354 \tabularnewline
6 & 0.130867 & 1.1104 & 0.135251 \tabularnewline
7 & 0.044706 & 0.3793 & 0.352773 \tabularnewline
8 & -0.018749 & -0.1591 & 0.437021 \tabularnewline
9 & -0.050698 & -0.4302 & 0.334173 \tabularnewline
10 & -0.043957 & -0.373 & 0.355127 \tabularnewline
11 & -0.027055 & -0.2296 & 0.409537 \tabularnewline
12 & -0.045268 & -0.3841 & 0.351015 \tabularnewline
13 & -0.079449 & -0.6741 & 0.251188 \tabularnewline
14 & -0.130761 & -1.1095 & 0.135444 \tabularnewline
15 & -0.176408 & -1.4969 & 0.069399 \tabularnewline
16 & -0.204468 & -1.735 & 0.043513 \tabularnewline
17 & -0.212911 & -1.8066 & 0.037501 \tabularnewline
18 & -0.217279 & -1.8437 & 0.034673 \tabularnewline
19 & -0.233248 & -1.9792 & 0.025811 \tabularnewline
20 & -0.236907 & -2.0102 & 0.024077 \tabularnewline
21 & -0.223949 & -1.9003 & 0.030701 \tabularnewline
22 & -0.193568 & -1.6425 & 0.052425 \tabularnewline
23 & -0.147447 & -1.2511 & 0.107468 \tabularnewline
24 & -0.115269 & -0.9781 & 0.165652 \tabularnewline
25 & -0.090452 & -0.7675 & 0.222643 \tabularnewline
26 & -0.077771 & -0.6599 & 0.255709 \tabularnewline
27 & -0.063215 & -0.5364 & 0.296668 \tabularnewline
28 & -0.053919 & -0.4575 & 0.324339 \tabularnewline
29 & -0.045899 & -0.3895 & 0.34904 \tabularnewline
30 & -0.047645 & -0.4043 & 0.343602 \tabularnewline
31 & -0.083242 & -0.7063 & 0.24113 \tabularnewline
32 & -0.131201 & -1.1133 & 0.134647 \tabularnewline
33 & -0.177276 & -1.5042 & 0.068447 \tabularnewline
34 & -0.206489 & -1.7521 & 0.042006 \tabularnewline
35 & -0.223934 & -1.9001 & 0.03071 \tabularnewline
36 & -0.229946 & -1.9512 & 0.027465 \tabularnewline
37 & -0.191301 & -1.6232 & 0.054454 \tabularnewline
38 & -0.159269 & -1.3514 & 0.090392 \tabularnewline
39 & -0.121128 & -1.0278 & 0.15374 \tabularnewline
40 & -0.070203 & -0.5957 & 0.276624 \tabularnewline
41 & -0.014568 & -0.1236 & 0.450983 \tabularnewline
42 & 0.029668 & 0.2517 & 0.400979 \tabularnewline
43 & 0.039794 & 0.3377 & 0.368298 \tabularnewline
44 & 0.044143 & 0.3746 & 0.354542 \tabularnewline
45 & 0.052348 & 0.4442 & 0.32912 \tabularnewline
46 & 0.072121 & 0.612 & 0.271245 \tabularnewline
47 & 0.102224 & 0.8674 & 0.194301 \tabularnewline
48 & 0.147699 & 1.2533 & 0.107081 \tabularnewline
\hline
\end{tabular}
%Source: https://freestatistics.org/blog/index.php?pk=&T=1

[TABLE]
[ROW][C]Autocorrelation Function[/C][/ROW]
[ROW][C]Time lag k[/C][C]ACF(k)[/C][C]T-STAT[/C][C]P-value[/C][/ROW]
[ROW][C]1[/C][C]0.858691[/C][C]7.2862[/C][C]0[/C][/ROW]
[ROW][C]2[/C][C]0.680777[/C][C]5.7766[/C][C]0[/C][/ROW]
[ROW][C]3[/C][C]0.506329[/C][C]4.2963[/C][C]2.7e-05[/C][/ROW]
[ROW][C]4[/C][C]0.359614[/C][C]3.0514[/C][C]0.001594[/C][/ROW]
[ROW][C]5[/C][C]0.236307[/C][C]2.0051[/C][C]0.024354[/C][/ROW]
[ROW][C]6[/C][C]0.130867[/C][C]1.1104[/C][C]0.135251[/C][/ROW]
[ROW][C]7[/C][C]0.044706[/C][C]0.3793[/C][C]0.352773[/C][/ROW]
[ROW][C]8[/C][C]-0.018749[/C][C]-0.1591[/C][C]0.437021[/C][/ROW]
[ROW][C]9[/C][C]-0.050698[/C][C]-0.4302[/C][C]0.334173[/C][/ROW]
[ROW][C]10[/C][C]-0.043957[/C][C]-0.373[/C][C]0.355127[/C][/ROW]
[ROW][C]11[/C][C]-0.027055[/C][C]-0.2296[/C][C]0.409537[/C][/ROW]
[ROW][C]12[/C][C]-0.045268[/C][C]-0.3841[/C][C]0.351015[/C][/ROW]
[ROW][C]13[/C][C]-0.079449[/C][C]-0.6741[/C][C]0.251188[/C][/ROW]
[ROW][C]14[/C][C]-0.130761[/C][C]-1.1095[/C][C]0.135444[/C][/ROW]
[ROW][C]15[/C][C]-0.176408[/C][C]-1.4969[/C][C]0.069399[/C][/ROW]
[ROW][C]16[/C][C]-0.204468[/C][C]-1.735[/C][C]0.043513[/C][/ROW]
[ROW][C]17[/C][C]-0.212911[/C][C]-1.8066[/C][C]0.037501[/C][/ROW]
[ROW][C]18[/C][C]-0.217279[/C][C]-1.8437[/C][C]0.034673[/C][/ROW]
[ROW][C]19[/C][C]-0.233248[/C][C]-1.9792[/C][C]0.025811[/C][/ROW]
[ROW][C]20[/C][C]-0.236907[/C][C]-2.0102[/C][C]0.024077[/C][/ROW]
[ROW][C]21[/C][C]-0.223949[/C][C]-1.9003[/C][C]0.030701[/C][/ROW]
[ROW][C]22[/C][C]-0.193568[/C][C]-1.6425[/C][C]0.052425[/C][/ROW]
[ROW][C]23[/C][C]-0.147447[/C][C]-1.2511[/C][C]0.107468[/C][/ROW]
[ROW][C]24[/C][C]-0.115269[/C][C]-0.9781[/C][C]0.165652[/C][/ROW]
[ROW][C]25[/C][C]-0.090452[/C][C]-0.7675[/C][C]0.222643[/C][/ROW]
[ROW][C]26[/C][C]-0.077771[/C][C]-0.6599[/C][C]0.255709[/C][/ROW]
[ROW][C]27[/C][C]-0.063215[/C][C]-0.5364[/C][C]0.296668[/C][/ROW]
[ROW][C]28[/C][C]-0.053919[/C][C]-0.4575[/C][C]0.324339[/C][/ROW]
[ROW][C]29[/C][C]-0.045899[/C][C]-0.3895[/C][C]0.34904[/C][/ROW]
[ROW][C]30[/C][C]-0.047645[/C][C]-0.4043[/C][C]0.343602[/C][/ROW]
[ROW][C]31[/C][C]-0.083242[/C][C]-0.7063[/C][C]0.24113[/C][/ROW]
[ROW][C]32[/C][C]-0.131201[/C][C]-1.1133[/C][C]0.134647[/C][/ROW]
[ROW][C]33[/C][C]-0.177276[/C][C]-1.5042[/C][C]0.068447[/C][/ROW]
[ROW][C]34[/C][C]-0.206489[/C][C]-1.7521[/C][C]0.042006[/C][/ROW]
[ROW][C]35[/C][C]-0.223934[/C][C]-1.9001[/C][C]0.03071[/C][/ROW]
[ROW][C]36[/C][C]-0.229946[/C][C]-1.9512[/C][C]0.027465[/C][/ROW]
[ROW][C]37[/C][C]-0.191301[/C][C]-1.6232[/C][C]0.054454[/C][/ROW]
[ROW][C]38[/C][C]-0.159269[/C][C]-1.3514[/C][C]0.090392[/C][/ROW]
[ROW][C]39[/C][C]-0.121128[/C][C]-1.0278[/C][C]0.15374[/C][/ROW]
[ROW][C]40[/C][C]-0.070203[/C][C]-0.5957[/C][C]0.276624[/C][/ROW]
[ROW][C]41[/C][C]-0.014568[/C][C]-0.1236[/C][C]0.450983[/C][/ROW]
[ROW][C]42[/C][C]0.029668[/C][C]0.2517[/C][C]0.400979[/C][/ROW]
[ROW][C]43[/C][C]0.039794[/C][C]0.3377[/C][C]0.368298[/C][/ROW]
[ROW][C]44[/C][C]0.044143[/C][C]0.3746[/C][C]0.354542[/C][/ROW]
[ROW][C]45[/C][C]0.052348[/C][C]0.4442[/C][C]0.32912[/C][/ROW]
[ROW][C]46[/C][C]0.072121[/C][C]0.612[/C][C]0.271245[/C][/ROW]
[ROW][C]47[/C][C]0.102224[/C][C]0.8674[/C][C]0.194301[/C][/ROW]
[ROW][C]48[/C][C]0.147699[/C][C]1.2533[/C][C]0.107081[/C][/ROW]
[/TABLE]
Source: https://freestatistics.org/blog/index.php?pk=&T=1

Globally Unique Identifier (entire table): ba.freestatistics.org/blog/index.php?pk=&T=1

As an alternative you can also use a QR Code:  

The GUIDs for individual cells are displayed in the table below:

Autocorrelation Function
Time lag kACF(k)T-STATP-value
10.8586917.28620
20.6807775.77660
30.5063294.29632.7e-05
40.3596143.05140.001594
50.2363072.00510.024354
60.1308671.11040.135251
70.0447060.37930.352773
8-0.018749-0.15910.437021
9-0.050698-0.43020.334173
10-0.043957-0.3730.355127
11-0.027055-0.22960.409537
12-0.045268-0.38410.351015
13-0.079449-0.67410.251188
14-0.130761-1.10950.135444
15-0.176408-1.49690.069399
16-0.204468-1.7350.043513
17-0.212911-1.80660.037501
18-0.217279-1.84370.034673
19-0.233248-1.97920.025811
20-0.236907-2.01020.024077
21-0.223949-1.90030.030701
22-0.193568-1.64250.052425
23-0.147447-1.25110.107468
24-0.115269-0.97810.165652
25-0.090452-0.76750.222643
26-0.077771-0.65990.255709
27-0.063215-0.53640.296668
28-0.053919-0.45750.324339
29-0.045899-0.38950.34904
30-0.047645-0.40430.343602
31-0.083242-0.70630.24113
32-0.131201-1.11330.134647
33-0.177276-1.50420.068447
34-0.206489-1.75210.042006
35-0.223934-1.90010.03071
36-0.229946-1.95120.027465
37-0.191301-1.62320.054454
38-0.159269-1.35140.090392
39-0.121128-1.02780.15374
40-0.070203-0.59570.276624
41-0.014568-0.12360.450983
420.0296680.25170.400979
430.0397940.33770.368298
440.0441430.37460.354542
450.0523480.44420.32912
460.0721210.6120.271245
470.1022240.86740.194301
480.1476991.25330.107081


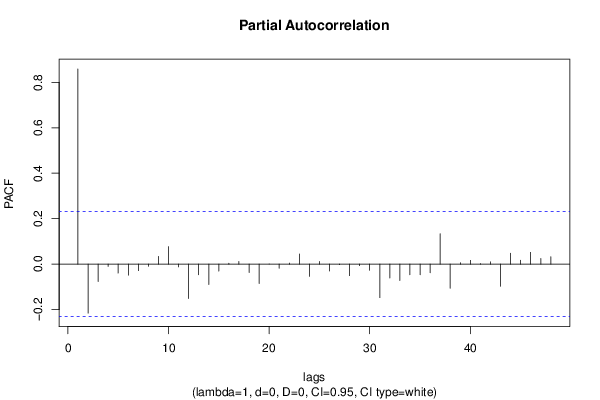
Partial Autocorrelation Function
Time lag kPACF(k)T-STATP-value
10.8586917.28620
2-0.215393-1.82770.035871
3-0.076681-0.65070.258669
4-0.009848-0.08360.466817
5-0.039382-0.33420.369613
6-0.048458-0.41120.341082
7-0.028626-0.24290.404386
8-0.00895-0.07590.469836
90.0340640.2890.38669
100.0770580.65390.257642
11-0.012208-0.10360.458891
12-0.150845-1.280.102333
13-0.04689-0.39790.345951
14-0.089939-0.76320.223932
15-0.030611-0.25970.397901
160.003640.03090.487723
170.0116220.09860.46086
18-0.036959-0.31360.377362
19-0.085107-0.72220.236268
200.0002310.0020.499221
21-0.01816-0.15410.438985
220.0045840.03890.484542
230.0449790.38170.351919
24-0.05399-0.45810.324123
250.0116440.09880.460786
26-0.030364-0.25770.398706
27-0.002146-0.01820.492762
28-0.050685-0.43010.334211
29-0.006582-0.05590.477808
30-0.026712-0.22670.410666
31-0.14736-1.25040.107603
32-0.061226-0.51950.302497
33-0.071658-0.6080.272539
34-0.046964-0.39850.345718
35-0.046842-0.39750.346099
36-0.037813-0.32090.374627
370.1340131.13710.129625
38-0.106151-0.90070.18537
390.0059250.05030.480021
400.0166420.14120.44405
410.0021710.01840.492678
420.0100290.08510.466209
43-0.097049-0.82350.206475
440.0479680.4070.3426
450.0173510.14720.441683
460.0517590.43920.330921
470.0245170.2080.417896
480.0322440.27360.392588

\begin{tabular}{lllllllll}
\hline
Partial Autocorrelation Function \tabularnewline
Time lag k & PACF(k) & T-STAT & P-value \tabularnewline
1 & 0.858691 & 7.2862 & 0 \tabularnewline
2 & -0.215393 & -1.8277 & 0.035871 \tabularnewline
3 & -0.076681 & -0.6507 & 0.258669 \tabularnewline
4 & -0.009848 & -0.0836 & 0.466817 \tabularnewline
5 & -0.039382 & -0.3342 & 0.369613 \tabularnewline
6 & -0.048458 & -0.4112 & 0.341082 \tabularnewline
7 & -0.028626 & -0.2429 & 0.404386 \tabularnewline
8 & -0.00895 & -0.0759 & 0.469836 \tabularnewline
9 & 0.034064 & 0.289 & 0.38669 \tabularnewline
10 & 0.077058 & 0.6539 & 0.257642 \tabularnewline
11 & -0.012208 & -0.1036 & 0.458891 \tabularnewline
12 & -0.150845 & -1.28 & 0.102333 \tabularnewline
13 & -0.04689 & -0.3979 & 0.345951 \tabularnewline
14 & -0.089939 & -0.7632 & 0.223932 \tabularnewline
15 & -0.030611 & -0.2597 & 0.397901 \tabularnewline
16 & 0.00364 & 0.0309 & 0.487723 \tabularnewline
17 & 0.011622 & 0.0986 & 0.46086 \tabularnewline
18 & -0.036959 & -0.3136 & 0.377362 \tabularnewline
19 & -0.085107 & -0.7222 & 0.236268 \tabularnewline
20 & 0.000231 & 0.002 & 0.499221 \tabularnewline
21 & -0.01816 & -0.1541 & 0.438985 \tabularnewline
22 & 0.004584 & 0.0389 & 0.484542 \tabularnewline
23 & 0.044979 & 0.3817 & 0.351919 \tabularnewline
24 & -0.05399 & -0.4581 & 0.324123 \tabularnewline
25 & 0.011644 & 0.0988 & 0.460786 \tabularnewline
26 & -0.030364 & -0.2577 & 0.398706 \tabularnewline
27 & -0.002146 & -0.0182 & 0.492762 \tabularnewline
28 & -0.050685 & -0.4301 & 0.334211 \tabularnewline
29 & -0.006582 & -0.0559 & 0.477808 \tabularnewline
30 & -0.026712 & -0.2267 & 0.410666 \tabularnewline
31 & -0.14736 & -1.2504 & 0.107603 \tabularnewline
32 & -0.061226 & -0.5195 & 0.302497 \tabularnewline
33 & -0.071658 & -0.608 & 0.272539 \tabularnewline
34 & -0.046964 & -0.3985 & 0.345718 \tabularnewline
35 & -0.046842 & -0.3975 & 0.346099 \tabularnewline
36 & -0.037813 & -0.3209 & 0.374627 \tabularnewline
37 & 0.134013 & 1.1371 & 0.129625 \tabularnewline
38 & -0.106151 & -0.9007 & 0.18537 \tabularnewline
39 & 0.005925 & 0.0503 & 0.480021 \tabularnewline
40 & 0.016642 & 0.1412 & 0.44405 \tabularnewline
41 & 0.002171 & 0.0184 & 0.492678 \tabularnewline
42 & 0.010029 & 0.0851 & 0.466209 \tabularnewline
43 & -0.097049 & -0.8235 & 0.206475 \tabularnewline
44 & 0.047968 & 0.407 & 0.3426 \tabularnewline
45 & 0.017351 & 0.1472 & 0.441683 \tabularnewline
46 & 0.051759 & 0.4392 & 0.330921 \tabularnewline
47 & 0.024517 & 0.208 & 0.417896 \tabularnewline
48 & 0.032244 & 0.2736 & 0.392588 \tabularnewline
\hline
\end{tabular}
%Source: https://freestatistics.org/blog/index.php?pk=&T=2

[TABLE]
[ROW][C]Partial Autocorrelation Function[/C][/ROW]
[ROW][C]Time lag k[/C][C]PACF(k)[/C][C]T-STAT[/C][C]P-value[/C][/ROW]
[ROW][C]1[/C][C]0.858691[/C][C]7.2862[/C][C]0[/C][/ROW]
[ROW][C]2[/C][C]-0.215393[/C][C]-1.8277[/C][C]0.035871[/C][/ROW]
[ROW][C]3[/C][C]-0.076681[/C][C]-0.6507[/C][C]0.258669[/C][/ROW]
[ROW][C]4[/C][C]-0.009848[/C][C]-0.0836[/C][C]0.466817[/C][/ROW]
[ROW][C]5[/C][C]-0.039382[/C][C]-0.3342[/C][C]0.369613[/C][/ROW]
[ROW][C]6[/C][C]-0.048458[/C][C]-0.4112[/C][C]0.341082[/C][/ROW]
[ROW][C]7[/C][C]-0.028626[/C][C]-0.2429[/C][C]0.404386[/C][/ROW]
[ROW][C]8[/C][C]-0.00895[/C][C]-0.0759[/C][C]0.469836[/C][/ROW]
[ROW][C]9[/C][C]0.034064[/C][C]0.289[/C][C]0.38669[/C][/ROW]
[ROW][C]10[/C][C]0.077058[/C][C]0.6539[/C][C]0.257642[/C][/ROW]
[ROW][C]11[/C][C]-0.012208[/C][C]-0.1036[/C][C]0.458891[/C][/ROW]
[ROW][C]12[/C][C]-0.150845[/C][C]-1.28[/C][C]0.102333[/C][/ROW]
[ROW][C]13[/C][C]-0.04689[/C][C]-0.3979[/C][C]0.345951[/C][/ROW]
[ROW][C]14[/C][C]-0.089939[/C][C]-0.7632[/C][C]0.223932[/C][/ROW]
[ROW][C]15[/C][C]-0.030611[/C][C]-0.2597[/C][C]0.397901[/C][/ROW]
[ROW][C]16[/C][C]0.00364[/C][C]0.0309[/C][C]0.487723[/C][/ROW]
[ROW][C]17[/C][C]0.011622[/C][C]0.0986[/C][C]0.46086[/C][/ROW]
[ROW][C]18[/C][C]-0.036959[/C][C]-0.3136[/C][C]0.377362[/C][/ROW]
[ROW][C]19[/C][C]-0.085107[/C][C]-0.7222[/C][C]0.236268[/C][/ROW]
[ROW][C]20[/C][C]0.000231[/C][C]0.002[/C][C]0.499221[/C][/ROW]
[ROW][C]21[/C][C]-0.01816[/C][C]-0.1541[/C][C]0.438985[/C][/ROW]
[ROW][C]22[/C][C]0.004584[/C][C]0.0389[/C][C]0.484542[/C][/ROW]
[ROW][C]23[/C][C]0.044979[/C][C]0.3817[/C][C]0.351919[/C][/ROW]
[ROW][C]24[/C][C]-0.05399[/C][C]-0.4581[/C][C]0.324123[/C][/ROW]
[ROW][C]25[/C][C]0.011644[/C][C]0.0988[/C][C]0.460786[/C][/ROW]
[ROW][C]26[/C][C]-0.030364[/C][C]-0.2577[/C][C]0.398706[/C][/ROW]
[ROW][C]27[/C][C]-0.002146[/C][C]-0.0182[/C][C]0.492762[/C][/ROW]
[ROW][C]28[/C][C]-0.050685[/C][C]-0.4301[/C][C]0.334211[/C][/ROW]
[ROW][C]29[/C][C]-0.006582[/C][C]-0.0559[/C][C]0.477808[/C][/ROW]
[ROW][C]30[/C][C]-0.026712[/C][C]-0.2267[/C][C]0.410666[/C][/ROW]
[ROW][C]31[/C][C]-0.14736[/C][C]-1.2504[/C][C]0.107603[/C][/ROW]
[ROW][C]32[/C][C]-0.061226[/C][C]-0.5195[/C][C]0.302497[/C][/ROW]
[ROW][C]33[/C][C]-0.071658[/C][C]-0.608[/C][C]0.272539[/C][/ROW]
[ROW][C]34[/C][C]-0.046964[/C][C]-0.3985[/C][C]0.345718[/C][/ROW]
[ROW][C]35[/C][C]-0.046842[/C][C]-0.3975[/C][C]0.346099[/C][/ROW]
[ROW][C]36[/C][C]-0.037813[/C][C]-0.3209[/C][C]0.374627[/C][/ROW]
[ROW][C]37[/C][C]0.134013[/C][C]1.1371[/C][C]0.129625[/C][/ROW]
[ROW][C]38[/C][C]-0.106151[/C][C]-0.9007[/C][C]0.18537[/C][/ROW]
[ROW][C]39[/C][C]0.005925[/C][C]0.0503[/C][C]0.480021[/C][/ROW]
[ROW][C]40[/C][C]0.016642[/C][C]0.1412[/C][C]0.44405[/C][/ROW]
[ROW][C]41[/C][C]0.002171[/C][C]0.0184[/C][C]0.492678[/C][/ROW]
[ROW][C]42[/C][C]0.010029[/C][C]0.0851[/C][C]0.466209[/C][/ROW]
[ROW][C]43[/C][C]-0.097049[/C][C]-0.8235[/C][C]0.206475[/C][/ROW]
[ROW][C]44[/C][C]0.047968[/C][C]0.407[/C][C]0.3426[/C][/ROW]
[ROW][C]45[/C][C]0.017351[/C][C]0.1472[/C][C]0.441683[/C][/ROW]
[ROW][C]46[/C][C]0.051759[/C][C]0.4392[/C][C]0.330921[/C][/ROW]
[ROW][C]47[/C][C]0.024517[/C][C]0.208[/C][C]0.417896[/C][/ROW]
[ROW][C]48[/C][C]0.032244[/C][C]0.2736[/C][C]0.392588[/C][/ROW]
[/TABLE]
Source: https://freestatistics.org/blog/index.php?pk=&T=2

Globally Unique Identifier (entire table): ba.freestatistics.org/blog/index.php?pk=&T=2

As an alternative you can also use a QR Code:  

The GUIDs for individual cells are displayed in the table below:

Partial Autocorrelation Function
Time lag kPACF(k)T-STATP-value
10.8586917.28620
2-0.215393-1.82770.035871
3-0.076681-0.65070.258669
4-0.009848-0.08360.466817
5-0.039382-0.33420.369613
6-0.048458-0.41120.341082
7-0.028626-0.24290.404386
8-0.00895-0.07590.469836
90.0340640.2890.38669
100.0770580.65390.257642
11-0.012208-0.10360.458891
12-0.150845-1.280.102333
13-0.04689-0.39790.345951
14-0.089939-0.76320.223932
15-0.030611-0.25970.397901
160.003640.03090.487723
170.0116220.09860.46086
18-0.036959-0.31360.377362
19-0.085107-0.72220.236268
200.0002310.0020.499221
21-0.01816-0.15410.438985
220.0045840.03890.484542
230.0449790.38170.351919
24-0.05399-0.45810.324123
250.0116440.09880.460786
26-0.030364-0.25770.398706
27-0.002146-0.01820.492762
28-0.050685-0.43010.334211
29-0.006582-0.05590.477808
30-0.026712-0.22670.410666
31-0.14736-1.25040.107603
32-0.061226-0.51950.302497
33-0.071658-0.6080.272539
34-0.046964-0.39850.345718
35-0.046842-0.39750.346099
36-0.037813-0.32090.374627
370.1340131.13710.129625
38-0.106151-0.90070.18537
390.0059250.05030.480021
400.0166420.14120.44405
410.0021710.01840.492678
420.0100290.08510.466209
43-0.097049-0.82350.206475
440.0479680.4070.3426
450.0173510.14720.441683
460.0517590.43920.330921
470.0245170.2080.417896
480.0322440.27360.392588


Parameters (Session):
par1 = 48 ; par2 = 1 ; par3 = 0 ; par4 = 0 ; par5 = 12 ; par6 = White Noise ; par7 = 0.95 ;
Parameters (R input):
par1 = 48 ; par2 = 1 ; par3 = 0 ; par4 = 0 ; par5 = 12 ; par6 = White Noise ; par7 = 0.95 ; par8 = ;
R code (references can be found in the software module):
if (par1 == 'Default') {
par1 = 10*log10(length(x))
} else {
par1 <- as.numeric(par1)
}
par2 <- as.numeric(par2)
par3 <- as.numeric(par3)
par4 <- as.numeric(par4)
par5 <- as.numeric(par5)
if (par6 == 'White Noise') par6 <- 'white' else par6 <- 'ma'
par7 <- as.numeric(par7)
if (par8 != '') par8 <- as.numeric(par8)
x <- na.omit(x)
ox <- x
if (par8 == '') {
if (par2 == 0) {
x <- log(x)
} else {
x <- (x ^ par2 - 1) / par2
}
} else {
x <- log(x,base=par8)
}
if (par3 > 0) x <- diff(x,lag=1,difference=par3)
if (par4 > 0) x <- diff(x,lag=par5,difference=par4)
bitmap(file='picts.png')
op <- par(mfrow=c(2,1))
plot(ox,type='l',main='Original Time Series',xlab='time',ylab='value')
if (par8=='') {
mytitle <- paste('Working Time Series (lambda=',par2,', d=',par3,', D=',par4,')',sep='')
mysub <- paste('(lambda=',par2,', d=',par3,', D=',par4,', CI=', par7, ', CI type=',par6,')',sep='')
} else {
mytitle <- paste('Working Time Series (base=',par8,', d=',par3,', D=',par4,')',sep='')
mysub <- paste('(base=',par8,', d=',par3,', D=',par4,', CI=', par7, ', CI type=',par6,')',sep='')
}
plot(x,type='l', main=mytitle,xlab='time',ylab='value')
par(op)
dev.off()
bitmap(file='pic1.png')
racf <- acf(x, par1, main='Autocorrelation', xlab='time lag', ylab='ACF', ci.type=par6, ci=par7, sub=mysub)
dev.off()
bitmap(file='pic2.png')
rpacf <- pacf(x,par1,main='Partial Autocorrelation',xlab='lags',ylab='PACF',sub=mysub)
dev.off()
(myacf <- c(racf$acf))
(mypacf <- c(rpacf$acf))
lengthx <- length(x)
sqrtn <- sqrt(lengthx)
load(file='createtable')
a<-table.start()
a<-table.row.start(a)
a<-table.element(a,'Autocorrelation Function',4,TRUE)
a<-table.row.end(a)
a<-table.row.start(a)
a<-table.element(a,'Time lag k',header=TRUE)
a<-table.element(a,hyperlink('basics.htm','ACF(k)','click here for more information about the Autocorrelation Function'),header=TRUE)
a<-table.element(a,'T-STAT',header=TRUE)
a<-table.element(a,'P-value',header=TRUE)
a<-table.row.end(a)
for (i in 2:(par1+1)) {
a<-table.row.start(a)
a<-table.element(a,i-1,header=TRUE)
a<-table.element(a,round(myacf[i],6))
mytstat <- myacf[i]*sqrtn
a<-table.element(a,round(mytstat,4))
a<-table.element(a,round(1-pt(abs(mytstat),lengthx),6))
a<-table.row.end(a)
}
a<-table.end(a)
table.save(a,file='mytable.tab')
a<-table.start()
a<-table.row.start(a)
a<-table.element(a,'Partial Autocorrelation Function',4,TRUE)
a<-table.row.end(a)
a<-table.row.start(a)
a<-table.element(a,'Time lag k',header=TRUE)
a<-table.element(a,hyperlink('basics.htm','PACF(k)','click here for more information about the Partial Autocorrelation Function'),header=TRUE)
a<-table.element(a,'T-STAT',header=TRUE)
a<-table.element(a,'P-value',header=TRUE)
a<-table.row.end(a)
for (i in 1:par1) {
a<-table.row.start(a)
a<-table.element(a,i,header=TRUE)
a<-table.element(a,round(mypacf[i],6))
mytstat <- mypacf[i]*sqrtn
a<-table.element(a,round(mytstat,4))
a<-table.element(a,round(1-pt(abs(mytstat),lengthx),6))
a<-table.row.end(a)
}
a<-table.end(a)
table.save(a,file='mytable1.tab')