Free Statistics

of Irreproducible Research!

Author's title

Author*Unverified author*
R Software Modulerwasp_autocorrelation.wasp
Title produced by software(Partial) Autocorrelation Function
Date of computationTue, 09 May 2017 15:05:12 +0100
Cite this page as followsStatistical Computations at FreeStatistics.org, Office for Research Development and Education, URL https://freestatistics.org/blog/index.php?v=date/2017/May/09/t1494339010r8r68log87gx0v6.htm/, Retrieved Fri, 17 May 2024 05:24:55 +0200
Statistical Computations at FreeStatistics.org, Office for Research Development and Education, URL https://freestatistics.org/blog/index.php?pk=, Retrieved Fri, 17 May 2024 05:24:55 +0200
QR Codes:

Original text written by user:
IsPrivate?No (this computation is public)
User-defined keywords
Estimated Impact0
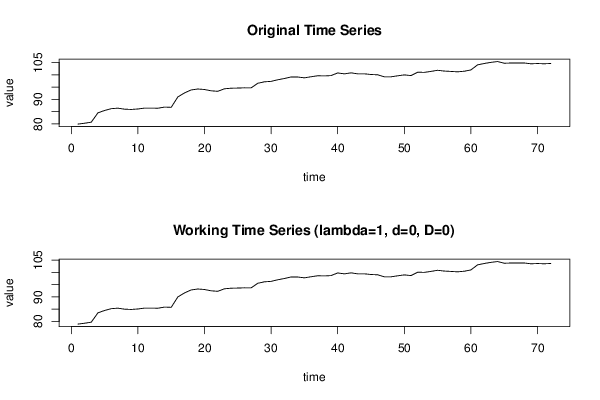
Dataseries X:
79,92
80,26
80,69
84,5
85,45
86,19
86,4
85,98
85,87
86,06
86,43
86,43
86,37
86,84
86,73
90,99
92,61
93,83
94,2
94,01
93,47
93,27
94,3
94,53
94,59
94,69
94,67
96,55
97,14
97,32
97,97
98,49
99,11
99,09
98,76
99,2
99,61
99,54
99,68
100,75
100,38
100,79
100,39
100,39
100,12
100
99,17
99,17
99,59
99,96
99,68
101,03
100,99
101,38
101,84
101,52
101,37
101,22
101,45
101,99
104,05
104,61
105,06
105,4
104,71
104,8
104,83
104,81
104,49
104,59
104,5
104,61


Summary of computational transaction
Raw Inputview raw input (R code)
Raw Outputview raw output of R engine
Computing time5 seconds
R Server'Herman Ole Andreas Wold' @ wold.wessa.net

\begin{tabular}{lllllllll}
\hline
Summary of computational transaction \tabularnewline
Raw Input & view raw input (R code)  \tabularnewline
Raw Output & view raw output of R engine  \tabularnewline
Computing time & 5 seconds \tabularnewline
R Server & 'Herman Ole Andreas Wold' @ wold.wessa.net \tabularnewline
\hline
\end{tabular}
%Source: https://freestatistics.org/blog/index.php?pk=&T=0

[TABLE]
[ROW][C]Summary of computational transaction[/C][/ROW]
[ROW][C]Raw Input[/C][C]view raw input (R code) [/C][/ROW]
[ROW][C]Raw Output[/C][C]view raw output of R engine [/C][/ROW]
[ROW][C]Computing time[/C][C]5 seconds[/C][/ROW]
[ROW][C]R Server[/C][C]'Herman Ole Andreas Wold' @ wold.wessa.net[/C][/ROW]
[/TABLE]
Source: https://freestatistics.org/blog/index.php?pk=&T=0

Globally Unique Identifier (entire table): ba.freestatistics.org/blog/index.php?pk=&T=0

As an alternative you can also use a QR Code:  

The GUIDs for individual cells are displayed in the table below:

Summary of computational transaction
Raw Inputview raw input (R code)
Raw Outputview raw output of R engine
Computing time5 seconds
R Server'Herman Ole Andreas Wold' @ wold.wessa.net


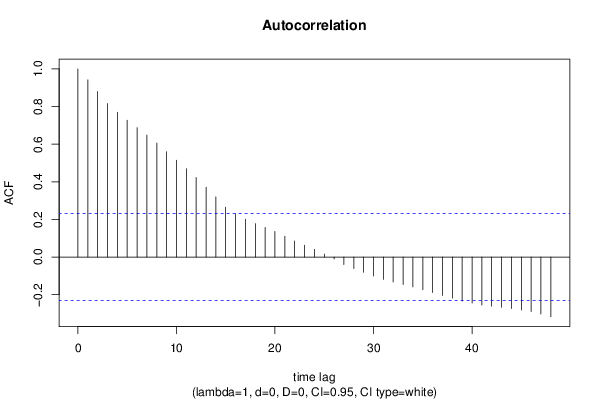
Autocorrelation Function
Time lag kACF(k)T-STATP-value
10.9419727.99290
20.8803527.470
30.8163146.92670
40.7696396.53060
50.7272156.17060
60.6879485.83740
70.6484945.50270
80.6057015.13951e-06
90.5603614.75485e-06
100.5148284.36852.1e-05
110.4697253.98588e-05
120.4231913.59090.000299
130.371643.15350.001177
140.3198562.71410.004156
150.2653382.25150.013704
160.2298271.95020.027526
170.2015221.710.045789
180.1780581.51090.067599
190.1574581.33610.092866
200.1358581.15280.126404
210.110570.93820.175634
220.0854250.72490.235445
230.0628910.53370.297613
240.0408860.34690.364828
250.0155940.13230.447552
26-0.009948-0.08440.46648
27-0.039393-0.33430.369577
28-0.060883-0.51660.303507
29-0.080913-0.68660.247278
30-0.100697-0.85440.197846
31-0.118575-1.00610.158859
32-0.132444-1.12380.13241
33-0.1456-1.23550.110338
34-0.158546-1.34530.091374
35-0.173959-1.47610.07214
36-0.188569-1.60010.056982
37-0.203444-1.72630.044293
38-0.21749-1.84550.034541
39-0.233477-1.98110.025699
40-0.244298-2.07290.020879
41-0.254515-2.15960.017066
42-0.260681-2.21190.015072
43-0.266934-2.2650.013261
44-0.273218-2.31830.011638
45-0.281407-2.38780.009787
46-0.289281-2.45460.00826
47-0.302658-2.56810.00615
48-0.316679-2.68710.004472

\begin{tabular}{lllllllll}
\hline
Autocorrelation Function \tabularnewline
Time lag k & ACF(k) & T-STAT & P-value \tabularnewline
1 & 0.941972 & 7.9929 & 0 \tabularnewline
2 & 0.880352 & 7.47 & 0 \tabularnewline
3 & 0.816314 & 6.9267 & 0 \tabularnewline
4 & 0.769639 & 6.5306 & 0 \tabularnewline
5 & 0.727215 & 6.1706 & 0 \tabularnewline
6 & 0.687948 & 5.8374 & 0 \tabularnewline
7 & 0.648494 & 5.5027 & 0 \tabularnewline
8 & 0.605701 & 5.1395 & 1e-06 \tabularnewline
9 & 0.560361 & 4.7548 & 5e-06 \tabularnewline
10 & 0.514828 & 4.3685 & 2.1e-05 \tabularnewline
11 & 0.469725 & 3.9858 & 8e-05 \tabularnewline
12 & 0.423191 & 3.5909 & 0.000299 \tabularnewline
13 & 0.37164 & 3.1535 & 0.001177 \tabularnewline
14 & 0.319856 & 2.7141 & 0.004156 \tabularnewline
15 & 0.265338 & 2.2515 & 0.013704 \tabularnewline
16 & 0.229827 & 1.9502 & 0.027526 \tabularnewline
17 & 0.201522 & 1.71 & 0.045789 \tabularnewline
18 & 0.178058 & 1.5109 & 0.067599 \tabularnewline
19 & 0.157458 & 1.3361 & 0.092866 \tabularnewline
20 & 0.135858 & 1.1528 & 0.126404 \tabularnewline
21 & 0.11057 & 0.9382 & 0.175634 \tabularnewline
22 & 0.085425 & 0.7249 & 0.235445 \tabularnewline
23 & 0.062891 & 0.5337 & 0.297613 \tabularnewline
24 & 0.040886 & 0.3469 & 0.364828 \tabularnewline
25 & 0.015594 & 0.1323 & 0.447552 \tabularnewline
26 & -0.009948 & -0.0844 & 0.46648 \tabularnewline
27 & -0.039393 & -0.3343 & 0.369577 \tabularnewline
28 & -0.060883 & -0.5166 & 0.303507 \tabularnewline
29 & -0.080913 & -0.6866 & 0.247278 \tabularnewline
30 & -0.100697 & -0.8544 & 0.197846 \tabularnewline
31 & -0.118575 & -1.0061 & 0.158859 \tabularnewline
32 & -0.132444 & -1.1238 & 0.13241 \tabularnewline
33 & -0.1456 & -1.2355 & 0.110338 \tabularnewline
34 & -0.158546 & -1.3453 & 0.091374 \tabularnewline
35 & -0.173959 & -1.4761 & 0.07214 \tabularnewline
36 & -0.188569 & -1.6001 & 0.056982 \tabularnewline
37 & -0.203444 & -1.7263 & 0.044293 \tabularnewline
38 & -0.21749 & -1.8455 & 0.034541 \tabularnewline
39 & -0.233477 & -1.9811 & 0.025699 \tabularnewline
40 & -0.244298 & -2.0729 & 0.020879 \tabularnewline
41 & -0.254515 & -2.1596 & 0.017066 \tabularnewline
42 & -0.260681 & -2.2119 & 0.015072 \tabularnewline
43 & -0.266934 & -2.265 & 0.013261 \tabularnewline
44 & -0.273218 & -2.3183 & 0.011638 \tabularnewline
45 & -0.281407 & -2.3878 & 0.009787 \tabularnewline
46 & -0.289281 & -2.4546 & 0.00826 \tabularnewline
47 & -0.302658 & -2.5681 & 0.00615 \tabularnewline
48 & -0.316679 & -2.6871 & 0.004472 \tabularnewline
\hline
\end{tabular}
%Source: https://freestatistics.org/blog/index.php?pk=&T=1

[TABLE]
[ROW][C]Autocorrelation Function[/C][/ROW]
[ROW][C]Time lag k[/C][C]ACF(k)[/C][C]T-STAT[/C][C]P-value[/C][/ROW]
[ROW][C]1[/C][C]0.941972[/C][C]7.9929[/C][C]0[/C][/ROW]
[ROW][C]2[/C][C]0.880352[/C][C]7.47[/C][C]0[/C][/ROW]
[ROW][C]3[/C][C]0.816314[/C][C]6.9267[/C][C]0[/C][/ROW]
[ROW][C]4[/C][C]0.769639[/C][C]6.5306[/C][C]0[/C][/ROW]
[ROW][C]5[/C][C]0.727215[/C][C]6.1706[/C][C]0[/C][/ROW]
[ROW][C]6[/C][C]0.687948[/C][C]5.8374[/C][C]0[/C][/ROW]
[ROW][C]7[/C][C]0.648494[/C][C]5.5027[/C][C]0[/C][/ROW]
[ROW][C]8[/C][C]0.605701[/C][C]5.1395[/C][C]1e-06[/C][/ROW]
[ROW][C]9[/C][C]0.560361[/C][C]4.7548[/C][C]5e-06[/C][/ROW]
[ROW][C]10[/C][C]0.514828[/C][C]4.3685[/C][C]2.1e-05[/C][/ROW]
[ROW][C]11[/C][C]0.469725[/C][C]3.9858[/C][C]8e-05[/C][/ROW]
[ROW][C]12[/C][C]0.423191[/C][C]3.5909[/C][C]0.000299[/C][/ROW]
[ROW][C]13[/C][C]0.37164[/C][C]3.1535[/C][C]0.001177[/C][/ROW]
[ROW][C]14[/C][C]0.319856[/C][C]2.7141[/C][C]0.004156[/C][/ROW]
[ROW][C]15[/C][C]0.265338[/C][C]2.2515[/C][C]0.013704[/C][/ROW]
[ROW][C]16[/C][C]0.229827[/C][C]1.9502[/C][C]0.027526[/C][/ROW]
[ROW][C]17[/C][C]0.201522[/C][C]1.71[/C][C]0.045789[/C][/ROW]
[ROW][C]18[/C][C]0.178058[/C][C]1.5109[/C][C]0.067599[/C][/ROW]
[ROW][C]19[/C][C]0.157458[/C][C]1.3361[/C][C]0.092866[/C][/ROW]
[ROW][C]20[/C][C]0.135858[/C][C]1.1528[/C][C]0.126404[/C][/ROW]
[ROW][C]21[/C][C]0.11057[/C][C]0.9382[/C][C]0.175634[/C][/ROW]
[ROW][C]22[/C][C]0.085425[/C][C]0.7249[/C][C]0.235445[/C][/ROW]
[ROW][C]23[/C][C]0.062891[/C][C]0.5337[/C][C]0.297613[/C][/ROW]
[ROW][C]24[/C][C]0.040886[/C][C]0.3469[/C][C]0.364828[/C][/ROW]
[ROW][C]25[/C][C]0.015594[/C][C]0.1323[/C][C]0.447552[/C][/ROW]
[ROW][C]26[/C][C]-0.009948[/C][C]-0.0844[/C][C]0.46648[/C][/ROW]
[ROW][C]27[/C][C]-0.039393[/C][C]-0.3343[/C][C]0.369577[/C][/ROW]
[ROW][C]28[/C][C]-0.060883[/C][C]-0.5166[/C][C]0.303507[/C][/ROW]
[ROW][C]29[/C][C]-0.080913[/C][C]-0.6866[/C][C]0.247278[/C][/ROW]
[ROW][C]30[/C][C]-0.100697[/C][C]-0.8544[/C][C]0.197846[/C][/ROW]
[ROW][C]31[/C][C]-0.118575[/C][C]-1.0061[/C][C]0.158859[/C][/ROW]
[ROW][C]32[/C][C]-0.132444[/C][C]-1.1238[/C][C]0.13241[/C][/ROW]
[ROW][C]33[/C][C]-0.1456[/C][C]-1.2355[/C][C]0.110338[/C][/ROW]
[ROW][C]34[/C][C]-0.158546[/C][C]-1.3453[/C][C]0.091374[/C][/ROW]
[ROW][C]35[/C][C]-0.173959[/C][C]-1.4761[/C][C]0.07214[/C][/ROW]
[ROW][C]36[/C][C]-0.188569[/C][C]-1.6001[/C][C]0.056982[/C][/ROW]
[ROW][C]37[/C][C]-0.203444[/C][C]-1.7263[/C][C]0.044293[/C][/ROW]
[ROW][C]38[/C][C]-0.21749[/C][C]-1.8455[/C][C]0.034541[/C][/ROW]
[ROW][C]39[/C][C]-0.233477[/C][C]-1.9811[/C][C]0.025699[/C][/ROW]
[ROW][C]40[/C][C]-0.244298[/C][C]-2.0729[/C][C]0.020879[/C][/ROW]
[ROW][C]41[/C][C]-0.254515[/C][C]-2.1596[/C][C]0.017066[/C][/ROW]
[ROW][C]42[/C][C]-0.260681[/C][C]-2.2119[/C][C]0.015072[/C][/ROW]
[ROW][C]43[/C][C]-0.266934[/C][C]-2.265[/C][C]0.013261[/C][/ROW]
[ROW][C]44[/C][C]-0.273218[/C][C]-2.3183[/C][C]0.011638[/C][/ROW]
[ROW][C]45[/C][C]-0.281407[/C][C]-2.3878[/C][C]0.009787[/C][/ROW]
[ROW][C]46[/C][C]-0.289281[/C][C]-2.4546[/C][C]0.00826[/C][/ROW]
[ROW][C]47[/C][C]-0.302658[/C][C]-2.5681[/C][C]0.00615[/C][/ROW]
[ROW][C]48[/C][C]-0.316679[/C][C]-2.6871[/C][C]0.004472[/C][/ROW]
[/TABLE]
Source: https://freestatistics.org/blog/index.php?pk=&T=1

Globally Unique Identifier (entire table): ba.freestatistics.org/blog/index.php?pk=&T=1

As an alternative you can also use a QR Code:  

The GUIDs for individual cells are displayed in the table below:

Autocorrelation Function
Time lag kACF(k)T-STATP-value
10.9419727.99290
20.8803527.470
30.8163146.92670
40.7696396.53060
50.7272156.17060
60.6879485.83740
70.6484945.50270
80.6057015.13951e-06
90.5603614.75485e-06
100.5148284.36852.1e-05
110.4697253.98588e-05
120.4231913.59090.000299
130.371643.15350.001177
140.3198562.71410.004156
150.2653382.25150.013704
160.2298271.95020.027526
170.2015221.710.045789
180.1780581.51090.067599
190.1574581.33610.092866
200.1358581.15280.126404
210.110570.93820.175634
220.0854250.72490.235445
230.0628910.53370.297613
240.0408860.34690.364828
250.0155940.13230.447552
26-0.009948-0.08440.46648
27-0.039393-0.33430.369577
28-0.060883-0.51660.303507
29-0.080913-0.68660.247278
30-0.100697-0.85440.197846
31-0.118575-1.00610.158859
32-0.132444-1.12380.13241
33-0.1456-1.23550.110338
34-0.158546-1.34530.091374
35-0.173959-1.47610.07214
36-0.188569-1.60010.056982
37-0.203444-1.72630.044293
38-0.21749-1.84550.034541
39-0.233477-1.98110.025699
40-0.244298-2.07290.020879
41-0.254515-2.15960.017066
42-0.260681-2.21190.015072
43-0.266934-2.2650.013261
44-0.273218-2.31830.011638
45-0.281407-2.38780.009787
46-0.289281-2.45460.00826
47-0.302658-2.56810.00615
48-0.316679-2.68710.004472


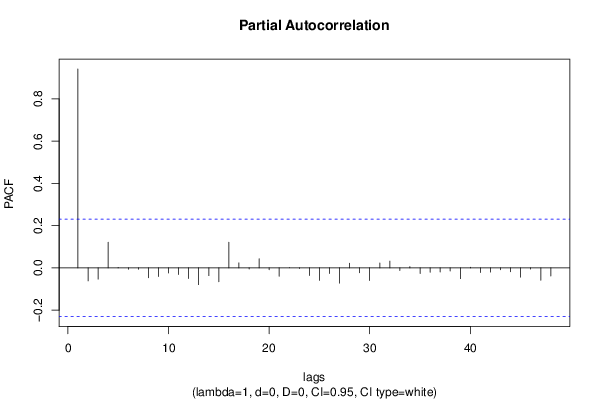
Partial Autocorrelation Function
Time lag kPACF(k)T-STATP-value
10.9419727.99290
2-0.061766-0.52410.300909
3-0.05337-0.45290.326005
40.1210281.0270.15394
50.0021140.01790.492868
6-0.006644-0.05640.477599
7-0.006695-0.05680.477428
8-0.04706-0.39930.345421
9-0.040897-0.3470.364793
10-0.024096-0.20450.419286
11-0.031332-0.26590.395553
12-0.0501-0.42510.336013
13-0.079245-0.67240.251735
14-0.036616-0.31070.378464
15-0.06598-0.55990.288658
160.1209931.02670.154009
170.0235750.20.421006
18-0.005274-0.04480.482214
190.0431210.36590.357759
20-0.009104-0.07720.469321
21-0.03957-0.33580.369012
22-0.000487-0.00410.498358
23-0.002859-0.02430.490357
24-0.036247-0.30760.379651
25-0.059221-0.50250.308422
26-0.026585-0.22560.411084
27-0.072165-0.61230.27112
280.0218130.18510.426839
29-0.02277-0.19320.423671
30-0.059728-0.50680.30692
310.0233740.19830.421671
320.0318980.27070.393711
33-0.012641-0.10730.45744
340.0061450.05210.479281
35-0.026664-0.22620.410825
36-0.020476-0.17370.431276
37-0.01927-0.16350.435288
38-0.014914-0.12660.449824
39-0.051124-0.43380.332866
400.003040.02580.489745
41-0.022226-0.18860.425472
42-0.020025-0.16990.432776
43-0.009272-0.07870.468756
44-0.018544-0.15740.437704
45-0.043987-0.37320.355031
46-0.00579-0.04910.480477
47-0.05861-0.49730.310238
48-0.038317-0.32510.373014

\begin{tabular}{lllllllll}
\hline
Partial Autocorrelation Function \tabularnewline
Time lag k & PACF(k) & T-STAT & P-value \tabularnewline
1 & 0.941972 & 7.9929 & 0 \tabularnewline
2 & -0.061766 & -0.5241 & 0.300909 \tabularnewline
3 & -0.05337 & -0.4529 & 0.326005 \tabularnewline
4 & 0.121028 & 1.027 & 0.15394 \tabularnewline
5 & 0.002114 & 0.0179 & 0.492868 \tabularnewline
6 & -0.006644 & -0.0564 & 0.477599 \tabularnewline
7 & -0.006695 & -0.0568 & 0.477428 \tabularnewline
8 & -0.04706 & -0.3993 & 0.345421 \tabularnewline
9 & -0.040897 & -0.347 & 0.364793 \tabularnewline
10 & -0.024096 & -0.2045 & 0.419286 \tabularnewline
11 & -0.031332 & -0.2659 & 0.395553 \tabularnewline
12 & -0.0501 & -0.4251 & 0.336013 \tabularnewline
13 & -0.079245 & -0.6724 & 0.251735 \tabularnewline
14 & -0.036616 & -0.3107 & 0.378464 \tabularnewline
15 & -0.06598 & -0.5599 & 0.288658 \tabularnewline
16 & 0.120993 & 1.0267 & 0.154009 \tabularnewline
17 & 0.023575 & 0.2 & 0.421006 \tabularnewline
18 & -0.005274 & -0.0448 & 0.482214 \tabularnewline
19 & 0.043121 & 0.3659 & 0.357759 \tabularnewline
20 & -0.009104 & -0.0772 & 0.469321 \tabularnewline
21 & -0.03957 & -0.3358 & 0.369012 \tabularnewline
22 & -0.000487 & -0.0041 & 0.498358 \tabularnewline
23 & -0.002859 & -0.0243 & 0.490357 \tabularnewline
24 & -0.036247 & -0.3076 & 0.379651 \tabularnewline
25 & -0.059221 & -0.5025 & 0.308422 \tabularnewline
26 & -0.026585 & -0.2256 & 0.411084 \tabularnewline
27 & -0.072165 & -0.6123 & 0.27112 \tabularnewline
28 & 0.021813 & 0.1851 & 0.426839 \tabularnewline
29 & -0.02277 & -0.1932 & 0.423671 \tabularnewline
30 & -0.059728 & -0.5068 & 0.30692 \tabularnewline
31 & 0.023374 & 0.1983 & 0.421671 \tabularnewline
32 & 0.031898 & 0.2707 & 0.393711 \tabularnewline
33 & -0.012641 & -0.1073 & 0.45744 \tabularnewline
34 & 0.006145 & 0.0521 & 0.479281 \tabularnewline
35 & -0.026664 & -0.2262 & 0.410825 \tabularnewline
36 & -0.020476 & -0.1737 & 0.431276 \tabularnewline
37 & -0.01927 & -0.1635 & 0.435288 \tabularnewline
38 & -0.014914 & -0.1266 & 0.449824 \tabularnewline
39 & -0.051124 & -0.4338 & 0.332866 \tabularnewline
40 & 0.00304 & 0.0258 & 0.489745 \tabularnewline
41 & -0.022226 & -0.1886 & 0.425472 \tabularnewline
42 & -0.020025 & -0.1699 & 0.432776 \tabularnewline
43 & -0.009272 & -0.0787 & 0.468756 \tabularnewline
44 & -0.018544 & -0.1574 & 0.437704 \tabularnewline
45 & -0.043987 & -0.3732 & 0.355031 \tabularnewline
46 & -0.00579 & -0.0491 & 0.480477 \tabularnewline
47 & -0.05861 & -0.4973 & 0.310238 \tabularnewline
48 & -0.038317 & -0.3251 & 0.373014 \tabularnewline
\hline
\end{tabular}
%Source: https://freestatistics.org/blog/index.php?pk=&T=2

[TABLE]
[ROW][C]Partial Autocorrelation Function[/C][/ROW]
[ROW][C]Time lag k[/C][C]PACF(k)[/C][C]T-STAT[/C][C]P-value[/C][/ROW]
[ROW][C]1[/C][C]0.941972[/C][C]7.9929[/C][C]0[/C][/ROW]
[ROW][C]2[/C][C]-0.061766[/C][C]-0.5241[/C][C]0.300909[/C][/ROW]
[ROW][C]3[/C][C]-0.05337[/C][C]-0.4529[/C][C]0.326005[/C][/ROW]
[ROW][C]4[/C][C]0.121028[/C][C]1.027[/C][C]0.15394[/C][/ROW]
[ROW][C]5[/C][C]0.002114[/C][C]0.0179[/C][C]0.492868[/C][/ROW]
[ROW][C]6[/C][C]-0.006644[/C][C]-0.0564[/C][C]0.477599[/C][/ROW]
[ROW][C]7[/C][C]-0.006695[/C][C]-0.0568[/C][C]0.477428[/C][/ROW]
[ROW][C]8[/C][C]-0.04706[/C][C]-0.3993[/C][C]0.345421[/C][/ROW]
[ROW][C]9[/C][C]-0.040897[/C][C]-0.347[/C][C]0.364793[/C][/ROW]
[ROW][C]10[/C][C]-0.024096[/C][C]-0.2045[/C][C]0.419286[/C][/ROW]
[ROW][C]11[/C][C]-0.031332[/C][C]-0.2659[/C][C]0.395553[/C][/ROW]
[ROW][C]12[/C][C]-0.0501[/C][C]-0.4251[/C][C]0.336013[/C][/ROW]
[ROW][C]13[/C][C]-0.079245[/C][C]-0.6724[/C][C]0.251735[/C][/ROW]
[ROW][C]14[/C][C]-0.036616[/C][C]-0.3107[/C][C]0.378464[/C][/ROW]
[ROW][C]15[/C][C]-0.06598[/C][C]-0.5599[/C][C]0.288658[/C][/ROW]
[ROW][C]16[/C][C]0.120993[/C][C]1.0267[/C][C]0.154009[/C][/ROW]
[ROW][C]17[/C][C]0.023575[/C][C]0.2[/C][C]0.421006[/C][/ROW]
[ROW][C]18[/C][C]-0.005274[/C][C]-0.0448[/C][C]0.482214[/C][/ROW]
[ROW][C]19[/C][C]0.043121[/C][C]0.3659[/C][C]0.357759[/C][/ROW]
[ROW][C]20[/C][C]-0.009104[/C][C]-0.0772[/C][C]0.469321[/C][/ROW]
[ROW][C]21[/C][C]-0.03957[/C][C]-0.3358[/C][C]0.369012[/C][/ROW]
[ROW][C]22[/C][C]-0.000487[/C][C]-0.0041[/C][C]0.498358[/C][/ROW]
[ROW][C]23[/C][C]-0.002859[/C][C]-0.0243[/C][C]0.490357[/C][/ROW]
[ROW][C]24[/C][C]-0.036247[/C][C]-0.3076[/C][C]0.379651[/C][/ROW]
[ROW][C]25[/C][C]-0.059221[/C][C]-0.5025[/C][C]0.308422[/C][/ROW]
[ROW][C]26[/C][C]-0.026585[/C][C]-0.2256[/C][C]0.411084[/C][/ROW]
[ROW][C]27[/C][C]-0.072165[/C][C]-0.6123[/C][C]0.27112[/C][/ROW]
[ROW][C]28[/C][C]0.021813[/C][C]0.1851[/C][C]0.426839[/C][/ROW]
[ROW][C]29[/C][C]-0.02277[/C][C]-0.1932[/C][C]0.423671[/C][/ROW]
[ROW][C]30[/C][C]-0.059728[/C][C]-0.5068[/C][C]0.30692[/C][/ROW]
[ROW][C]31[/C][C]0.023374[/C][C]0.1983[/C][C]0.421671[/C][/ROW]
[ROW][C]32[/C][C]0.031898[/C][C]0.2707[/C][C]0.393711[/C][/ROW]
[ROW][C]33[/C][C]-0.012641[/C][C]-0.1073[/C][C]0.45744[/C][/ROW]
[ROW][C]34[/C][C]0.006145[/C][C]0.0521[/C][C]0.479281[/C][/ROW]
[ROW][C]35[/C][C]-0.026664[/C][C]-0.2262[/C][C]0.410825[/C][/ROW]
[ROW][C]36[/C][C]-0.020476[/C][C]-0.1737[/C][C]0.431276[/C][/ROW]
[ROW][C]37[/C][C]-0.01927[/C][C]-0.1635[/C][C]0.435288[/C][/ROW]
[ROW][C]38[/C][C]-0.014914[/C][C]-0.1266[/C][C]0.449824[/C][/ROW]
[ROW][C]39[/C][C]-0.051124[/C][C]-0.4338[/C][C]0.332866[/C][/ROW]
[ROW][C]40[/C][C]0.00304[/C][C]0.0258[/C][C]0.489745[/C][/ROW]
[ROW][C]41[/C][C]-0.022226[/C][C]-0.1886[/C][C]0.425472[/C][/ROW]
[ROW][C]42[/C][C]-0.020025[/C][C]-0.1699[/C][C]0.432776[/C][/ROW]
[ROW][C]43[/C][C]-0.009272[/C][C]-0.0787[/C][C]0.468756[/C][/ROW]
[ROW][C]44[/C][C]-0.018544[/C][C]-0.1574[/C][C]0.437704[/C][/ROW]
[ROW][C]45[/C][C]-0.043987[/C][C]-0.3732[/C][C]0.355031[/C][/ROW]
[ROW][C]46[/C][C]-0.00579[/C][C]-0.0491[/C][C]0.480477[/C][/ROW]
[ROW][C]47[/C][C]-0.05861[/C][C]-0.4973[/C][C]0.310238[/C][/ROW]
[ROW][C]48[/C][C]-0.038317[/C][C]-0.3251[/C][C]0.373014[/C][/ROW]
[/TABLE]
Source: https://freestatistics.org/blog/index.php?pk=&T=2

Globally Unique Identifier (entire table): ba.freestatistics.org/blog/index.php?pk=&T=2

As an alternative you can also use a QR Code:  

The GUIDs for individual cells are displayed in the table below:

Partial Autocorrelation Function
Time lag kPACF(k)T-STATP-value
10.9419727.99290
2-0.061766-0.52410.300909
3-0.05337-0.45290.326005
40.1210281.0270.15394
50.0021140.01790.492868
6-0.006644-0.05640.477599
7-0.006695-0.05680.477428
8-0.04706-0.39930.345421
9-0.040897-0.3470.364793
10-0.024096-0.20450.419286
11-0.031332-0.26590.395553
12-0.0501-0.42510.336013
13-0.079245-0.67240.251735
14-0.036616-0.31070.378464
15-0.06598-0.55990.288658
160.1209931.02670.154009
170.0235750.20.421006
18-0.005274-0.04480.482214
190.0431210.36590.357759
20-0.009104-0.07720.469321
21-0.03957-0.33580.369012
22-0.000487-0.00410.498358
23-0.002859-0.02430.490357
24-0.036247-0.30760.379651
25-0.059221-0.50250.308422
26-0.026585-0.22560.411084
27-0.072165-0.61230.27112
280.0218130.18510.426839
29-0.02277-0.19320.423671
30-0.059728-0.50680.30692
310.0233740.19830.421671
320.0318980.27070.393711
33-0.012641-0.10730.45744
340.0061450.05210.479281
35-0.026664-0.22620.410825
36-0.020476-0.17370.431276
37-0.01927-0.16350.435288
38-0.014914-0.12660.449824
39-0.051124-0.43380.332866
400.003040.02580.489745
41-0.022226-0.18860.425472
42-0.020025-0.16990.432776
43-0.009272-0.07870.468756
44-0.018544-0.15740.437704
45-0.043987-0.37320.355031
46-0.00579-0.04910.480477
47-0.05861-0.49730.310238
48-0.038317-0.32510.373014


Parameters (Session):
Parameters (R input):
par1 = 48 ; par2 = 1 ; par3 = 0 ; par4 = 0 ; par5 = 12 ; par6 = White Noise ; par7 = 0.95 ; par8 = ;
R code (references can be found in the software module):
if (par1 == 'Default') {
par1 = 10*log10(length(x))
} else {
par1 <- as.numeric(par1)
}
par2 <- as.numeric(par2)
par3 <- as.numeric(par3)
par4 <- as.numeric(par4)
par5 <- as.numeric(par5)
if (par6 == 'White Noise') par6 <- 'white' else par6 <- 'ma'
par7 <- as.numeric(par7)
if (par8 != '') par8 <- as.numeric(par8)
x <- na.omit(x)
ox <- x
if (par8 == '') {
if (par2 == 0) {
x <- log(x)
} else {
x <- (x ^ par2 - 1) / par2
}
} else {
x <- log(x,base=par8)
}
if (par3 > 0) x <- diff(x,lag=1,difference=par3)
if (par4 > 0) x <- diff(x,lag=par5,difference=par4)
bitmap(file='picts.png')
op <- par(mfrow=c(2,1))
plot(ox,type='l',main='Original Time Series',xlab='time',ylab='value')
if (par8=='') {
mytitle <- paste('Working Time Series (lambda=',par2,', d=',par3,', D=',par4,')',sep='')
mysub <- paste('(lambda=',par2,', d=',par3,', D=',par4,', CI=', par7, ', CI type=',par6,')',sep='')
} else {
mytitle <- paste('Working Time Series (base=',par8,', d=',par3,', D=',par4,')',sep='')
mysub <- paste('(base=',par8,', d=',par3,', D=',par4,', CI=', par7, ', CI type=',par6,')',sep='')
}
plot(x,type='l', main=mytitle,xlab='time',ylab='value')
par(op)
dev.off()
bitmap(file='pic1.png')
racf <- acf(x, par1, main='Autocorrelation', xlab='time lag', ylab='ACF', ci.type=par6, ci=par7, sub=mysub)
dev.off()
bitmap(file='pic2.png')
rpacf <- pacf(x,par1,main='Partial Autocorrelation',xlab='lags',ylab='PACF',sub=mysub)
dev.off()
(myacf <- c(racf$acf))
(mypacf <- c(rpacf$acf))
lengthx <- length(x)
sqrtn <- sqrt(lengthx)
load(file='createtable')
a<-table.start()
a<-table.row.start(a)
a<-table.element(a,'Autocorrelation Function',4,TRUE)
a<-table.row.end(a)
a<-table.row.start(a)
a<-table.element(a,'Time lag k',header=TRUE)
a<-table.element(a,hyperlink('basics.htm','ACF(k)','click here for more information about the Autocorrelation Function'),header=TRUE)
a<-table.element(a,'T-STAT',header=TRUE)
a<-table.element(a,'P-value',header=TRUE)
a<-table.row.end(a)
for (i in 2:(par1+1)) {
a<-table.row.start(a)
a<-table.element(a,i-1,header=TRUE)
a<-table.element(a,round(myacf[i],6))
mytstat <- myacf[i]*sqrtn
a<-table.element(a,round(mytstat,4))
a<-table.element(a,round(1-pt(abs(mytstat),lengthx),6))
a<-table.row.end(a)
}
a<-table.end(a)
table.save(a,file='mytable.tab')
a<-table.start()
a<-table.row.start(a)
a<-table.element(a,'Partial Autocorrelation Function',4,TRUE)
a<-table.row.end(a)
a<-table.row.start(a)
a<-table.element(a,'Time lag k',header=TRUE)
a<-table.element(a,hyperlink('basics.htm','PACF(k)','click here for more information about the Partial Autocorrelation Function'),header=TRUE)
a<-table.element(a,'T-STAT',header=TRUE)
a<-table.element(a,'P-value',header=TRUE)
a<-table.row.end(a)
for (i in 1:par1) {
a<-table.row.start(a)
a<-table.element(a,i,header=TRUE)
a<-table.element(a,round(mypacf[i],6))
mytstat <- mypacf[i]*sqrtn
a<-table.element(a,round(mytstat,4))
a<-table.element(a,round(1-pt(abs(mytstat),lengthx),6))
a<-table.row.end(a)
}
a<-table.end(a)
table.save(a,file='mytable1.tab')