Free Statistics

of Irreproducible Research!

Author's title

Author*Unverified author*
R Software Modulerwasp_centraltendency.wasp
Title produced by softwareCentral Tendency
Date of computationMon, 08 May 2017 18:01:22 +0100
Cite this page as followsStatistical Computations at FreeStatistics.org, Office for Research Development and Education, URL https://freestatistics.org/blog/index.php?v=date/2017/May/08/t14942631018uheahh432u6q8y.htm/, Retrieved Fri, 17 May 2024 08:28:06 +0200
Statistical Computations at FreeStatistics.org, Office for Research Development and Education, URL https://freestatistics.org/blog/index.php?pk=, Retrieved Fri, 17 May 2024 08:28:06 +0200
QR Codes:

Original text written by user:
IsPrivate?No (this computation is public)
User-defined keywords
Estimated Impact0
Dataseries X:
20709,9
21227,3
23009,8
20416,2
20929,6
20763,9
19607,4
19419
19584,9
21878
21745,5
19206,8
21041,3
20407,1
22437
21050,3
20415,7
20220,6
20217,8
18286,4
20781,3
21619,6
20417,6
19988,6
21026,9
20128,3
21671,5
21053,2
19978,6
20572,6
20220,4
19107,6
21989,5
21701,2
19758,3
19843,9
18906,2
19071,2
22385,6
20208,5
19261,4
21470,1
19539,9
17665,1
19917,2
20399,5
19263
19026
18375,4
20165
21138,7
21414,3
20799,2
22773,6
19747,2
19910,7
22051,7
21705
22328,8
20910,3


Summary of computational transaction
Raw Inputview raw input (R code)
Raw Outputview raw output of R engine
Computing time3 seconds
R Server'Sir Maurice George Kendall' @ kendall.wessa.net

\begin{tabular}{lllllllll}
\hline
Summary of computational transaction \tabularnewline
Raw Input & view raw input (R code)  \tabularnewline
Raw Output & view raw output of R engine  \tabularnewline
Computing time & 3 seconds \tabularnewline
R Server & 'Sir Maurice George Kendall' @ kendall.wessa.net \tabularnewline
\hline
\end{tabular}
%Source: https://freestatistics.org/blog/index.php?pk=&T=0

[TABLE]
[ROW][C]Summary of computational transaction[/C][/ROW]
[ROW][C]Raw Input[/C][C]view raw input (R code) [/C][/ROW]
[ROW][C]Raw Output[/C][C]view raw output of R engine [/C][/ROW]
[ROW][C]Computing time[/C][C]3 seconds[/C][/ROW]
[ROW][C]R Server[/C][C]'Sir Maurice George Kendall' @ kendall.wessa.net[/C][/ROW]
[/TABLE]
Source: https://freestatistics.org/blog/index.php?pk=&T=0

Globally Unique Identifier (entire table): ba.freestatistics.org/blog/index.php?pk=&T=0

As an alternative you can also use a QR Code:  

The GUIDs for individual cells are displayed in the table below:

Summary of computational transaction
Raw Inputview raw input (R code)
Raw Outputview raw output of R engine
Computing time3 seconds
R Server'Sir Maurice George Kendall' @ kendall.wessa.net


Central Tendency - Ungrouped Data
MeasureValueS.E.Value/S.E.
Arithmetic Mean20514.4533333333148.649750028137138.005299904308
Geometric Mean20482.5413579744
Harmonic Mean20450.4812010529
Quadratic Mean20546.2041192122
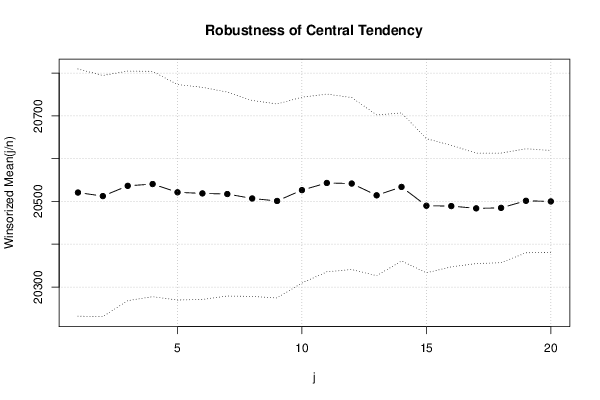
Winsorized Mean ( 1 / 20 )20520.8716666667144.525732056636141.987668041183
Winsorized Mean ( 2 / 20 )20512.6183333333140.973433316646145.506978518847
Winsorized Mean ( 3 / 20 )20536.5883333333134.217577176452153.009678503841
Winsorized Mean ( 4 / 20 )20540.7883333333131.739049375883155.920271405068
Winsorized Mean ( 5 / 20 )20521.4633333333125.964967216736162.914052905075
Winsorized Mean ( 6 / 20 )20518.8833333333123.993019718026165.484181125644
Winsorized Mean ( 7 / 20 )20517.4483333333119.231384753019172.080936372869
Winsorized Mean ( 8 / 20 )20507.0616666667114.553357909873179.017551653099
Winsorized Mean ( 9 / 20 )20501.2266666667113.405920661377180.777392812515
Winsorized Mean ( 10 / 20 )20526.5933333333108.6352660136188.949630139109
Winsorized Mean ( 11 / 20 )20543.3133333333103.904002942597197.714358942289
Winsorized Mean ( 12 / 20 )20541.9333333333100.543075364574204.309777265587
Winsorized Mean ( 13 / 20 )20514.416666666794.0135990032919218.206907129982
Winsorized Mean ( 14 / 20 )20534.016666666786.5847015220632237.155251513274
Winsorized Mean ( 15 / 20 )20490.041666666778.3823364560824261.411468362483
Winsorized Mean ( 16 / 20 )20489.241666666771.1034022361619288.16119935603
Winsorized Mean ( 17 / 20 )20483.943333333364.5320590132505317.422745323024
Winsorized Mean ( 18 / 20 )20485.023333333364.1088438581497319.535061007487
Winsorized Mean ( 19 / 20 )20501.616666666760.8036553951833337.177370890283
Winsorized Mean ( 20 / 20 )20500.1559.5975984187967343.976108834855
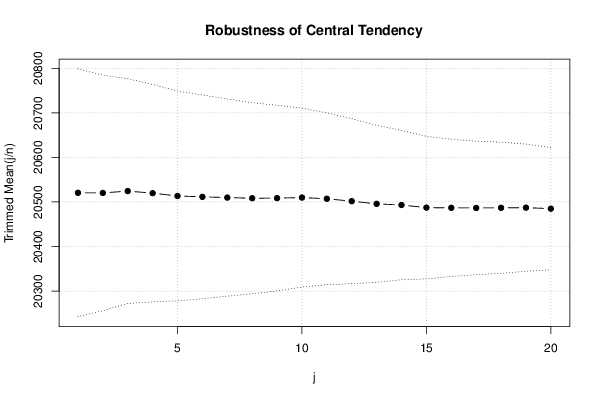
Trimmed Mean ( 1 / 20 )20520.5568965517138.999491290509147.630446025617
Trimmed Mean ( 2 / 20 )20520.2196428571132.173503430977155.25214290452
Trimmed Mean ( 3 / 20 )20524.4425925926126.131261966635162.722883070985
Trimmed Mean ( 4 / 20 )20519.7711538462121.962459679876168.246616276073
Trimmed Mean ( 5 / 20 )20513.466117.702763777653174.281939876544
Trimmed Mean ( 6 / 20 )20511.4666666667114.34299594221179.385422759374
Trimmed Mean ( 7 / 20 )20509.8543478261110.64179005832185.371678612712
Trimmed Mean ( 8 / 20 )20508.375107.268247565541191.187750946237
Trimmed Mean ( 9 / 20 )20508.6095238095104.166475176197196.88301336029
Trimmed Mean ( 10 / 20 )20509.84100.325985705062204.431980965478
Trimmed Mean ( 11 / 20 )20507.194736842196.4974695787288212.51536259312
Trimmed Mean ( 12 / 20 )20501.722222222292.5819793832772221.443982498449
Trimmed Mean ( 13 / 20 )20495.808823529488.1003227536569232.641699631897
Trimmed Mean ( 14 / 20 )20493.12583.8215642725473244.485117616825
Trimmed Mean ( 15 / 20 )20487.283333333379.970216881803256.186417045909
Trimmed Mean ( 16 / 20 )20486.889285714377.0213435579591265.989767762202
Trimmed Mean ( 17 / 20 )20486.5574.9000752284721273.51841687086
Trimmed Mean ( 18 / 20 )20486.933333333373.6449430229276278.185201758595
Trimmed Mean ( 19 / 20 )20487.222727272771.3481030948282287.144602850104
Trimmed Mean ( 20 / 20 )20484.9568.5571780187512298.800951147626
Median20415.95
Midrange20337.45
Midmean - Weighted Average at Xnp20463.4096774194
Midmean - Weighted Average at X(n+1)p20487.2833333333
Midmean - Empirical Distribution Function20463.4096774194
Midmean - Empirical Distribution Function - Averaging20487.2833333333
Midmean - Empirical Distribution Function - Interpolation20487.2833333333
Midmean - Closest Observation20463.4096774194
Midmean - True Basic - Statistics Graphics Toolkit20487.2833333333
Midmean - MS Excel (old versions)20493.125
Number of observations60

\begin{tabular}{lllllllll}
\hline
Central Tendency - Ungrouped Data \tabularnewline
Measure & Value & S.E. & Value/S.E. \tabularnewline
Arithmetic Mean & 20514.4533333333 & 148.649750028137 & 138.005299904308 \tabularnewline
Geometric Mean & 20482.5413579744 &  &  \tabularnewline
Harmonic Mean & 20450.4812010529 &  &  \tabularnewline
Quadratic Mean & 20546.2041192122 &  &  \tabularnewline
Winsorized Mean ( 1 / 20 ) & 20520.8716666667 & 144.525732056636 & 141.987668041183 \tabularnewline
Winsorized Mean ( 2 / 20 ) & 20512.6183333333 & 140.973433316646 & 145.506978518847 \tabularnewline
Winsorized Mean ( 3 / 20 ) & 20536.5883333333 & 134.217577176452 & 153.009678503841 \tabularnewline
Winsorized Mean ( 4 / 20 ) & 20540.7883333333 & 131.739049375883 & 155.920271405068 \tabularnewline
Winsorized Mean ( 5 / 20 ) & 20521.4633333333 & 125.964967216736 & 162.914052905075 \tabularnewline
Winsorized Mean ( 6 / 20 ) & 20518.8833333333 & 123.993019718026 & 165.484181125644 \tabularnewline
Winsorized Mean ( 7 / 20 ) & 20517.4483333333 & 119.231384753019 & 172.080936372869 \tabularnewline
Winsorized Mean ( 8 / 20 ) & 20507.0616666667 & 114.553357909873 & 179.017551653099 \tabularnewline
Winsorized Mean ( 9 / 20 ) & 20501.2266666667 & 113.405920661377 & 180.777392812515 \tabularnewline
Winsorized Mean ( 10 / 20 ) & 20526.5933333333 & 108.6352660136 & 188.949630139109 \tabularnewline
Winsorized Mean ( 11 / 20 ) & 20543.3133333333 & 103.904002942597 & 197.714358942289 \tabularnewline
Winsorized Mean ( 12 / 20 ) & 20541.9333333333 & 100.543075364574 & 204.309777265587 \tabularnewline
Winsorized Mean ( 13 / 20 ) & 20514.4166666667 & 94.0135990032919 & 218.206907129982 \tabularnewline
Winsorized Mean ( 14 / 20 ) & 20534.0166666667 & 86.5847015220632 & 237.155251513274 \tabularnewline
Winsorized Mean ( 15 / 20 ) & 20490.0416666667 & 78.3823364560824 & 261.411468362483 \tabularnewline
Winsorized Mean ( 16 / 20 ) & 20489.2416666667 & 71.1034022361619 & 288.16119935603 \tabularnewline
Winsorized Mean ( 17 / 20 ) & 20483.9433333333 & 64.5320590132505 & 317.422745323024 \tabularnewline
Winsorized Mean ( 18 / 20 ) & 20485.0233333333 & 64.1088438581497 & 319.535061007487 \tabularnewline
Winsorized Mean ( 19 / 20 ) & 20501.6166666667 & 60.8036553951833 & 337.177370890283 \tabularnewline
Winsorized Mean ( 20 / 20 ) & 20500.15 & 59.5975984187967 & 343.976108834855 \tabularnewline
Trimmed Mean ( 1 / 20 ) & 20520.5568965517 & 138.999491290509 & 147.630446025617 \tabularnewline
Trimmed Mean ( 2 / 20 ) & 20520.2196428571 & 132.173503430977 & 155.25214290452 \tabularnewline
Trimmed Mean ( 3 / 20 ) & 20524.4425925926 & 126.131261966635 & 162.722883070985 \tabularnewline
Trimmed Mean ( 4 / 20 ) & 20519.7711538462 & 121.962459679876 & 168.246616276073 \tabularnewline
Trimmed Mean ( 5 / 20 ) & 20513.466 & 117.702763777653 & 174.281939876544 \tabularnewline
Trimmed Mean ( 6 / 20 ) & 20511.4666666667 & 114.34299594221 & 179.385422759374 \tabularnewline
Trimmed Mean ( 7 / 20 ) & 20509.8543478261 & 110.64179005832 & 185.371678612712 \tabularnewline
Trimmed Mean ( 8 / 20 ) & 20508.375 & 107.268247565541 & 191.187750946237 \tabularnewline
Trimmed Mean ( 9 / 20 ) & 20508.6095238095 & 104.166475176197 & 196.88301336029 \tabularnewline
Trimmed Mean ( 10 / 20 ) & 20509.84 & 100.325985705062 & 204.431980965478 \tabularnewline
Trimmed Mean ( 11 / 20 ) & 20507.1947368421 & 96.4974695787288 & 212.51536259312 \tabularnewline
Trimmed Mean ( 12 / 20 ) & 20501.7222222222 & 92.5819793832772 & 221.443982498449 \tabularnewline
Trimmed Mean ( 13 / 20 ) & 20495.8088235294 & 88.1003227536569 & 232.641699631897 \tabularnewline
Trimmed Mean ( 14 / 20 ) & 20493.125 & 83.8215642725473 & 244.485117616825 \tabularnewline
Trimmed Mean ( 15 / 20 ) & 20487.2833333333 & 79.970216881803 & 256.186417045909 \tabularnewline
Trimmed Mean ( 16 / 20 ) & 20486.8892857143 & 77.0213435579591 & 265.989767762202 \tabularnewline
Trimmed Mean ( 17 / 20 ) & 20486.55 & 74.9000752284721 & 273.51841687086 \tabularnewline
Trimmed Mean ( 18 / 20 ) & 20486.9333333333 & 73.6449430229276 & 278.185201758595 \tabularnewline
Trimmed Mean ( 19 / 20 ) & 20487.2227272727 & 71.3481030948282 & 287.144602850104 \tabularnewline
Trimmed Mean ( 20 / 20 ) & 20484.95 & 68.5571780187512 & 298.800951147626 \tabularnewline
Median & 20415.95 &  &  \tabularnewline
Midrange & 20337.45 &  &  \tabularnewline
Midmean - Weighted Average at Xnp & 20463.4096774194 &  &  \tabularnewline
Midmean - Weighted Average at X(n+1)p & 20487.2833333333 &  &  \tabularnewline
Midmean - Empirical Distribution Function & 20463.4096774194 &  &  \tabularnewline
Midmean - Empirical Distribution Function - Averaging & 20487.2833333333 &  &  \tabularnewline
Midmean - Empirical Distribution Function - Interpolation & 20487.2833333333 &  &  \tabularnewline
Midmean - Closest Observation & 20463.4096774194 &  &  \tabularnewline
Midmean - True Basic - Statistics Graphics Toolkit & 20487.2833333333 &  &  \tabularnewline
Midmean - MS Excel (old versions) & 20493.125 &  &  \tabularnewline
Number of observations & 60 &  &  \tabularnewline
\hline
\end{tabular}
%Source: https://freestatistics.org/blog/index.php?pk=&T=1

[TABLE]
[ROW][C]Central Tendency - Ungrouped Data[/C][/ROW]
[ROW][C]Measure[/C][C]Value[/C][C]S.E.[/C][C]Value/S.E.[/C][/ROW]
[ROW][C]Arithmetic Mean[/C][C]20514.4533333333[/C][C]148.649750028137[/C][C]138.005299904308[/C][/ROW]
[ROW][C]Geometric Mean[/C][C]20482.5413579744[/C][C][/C][C][/C][/ROW]
[ROW][C]Harmonic Mean[/C][C]20450.4812010529[/C][C][/C][C][/C][/ROW]
[ROW][C]Quadratic Mean[/C][C]20546.2041192122[/C][C][/C][C][/C][/ROW]
[ROW][C]Winsorized Mean ( 1 / 20 )[/C][C]20520.8716666667[/C][C]144.525732056636[/C][C]141.987668041183[/C][/ROW]
[ROW][C]Winsorized Mean ( 2 / 20 )[/C][C]20512.6183333333[/C][C]140.973433316646[/C][C]145.506978518847[/C][/ROW]
[ROW][C]Winsorized Mean ( 3 / 20 )[/C][C]20536.5883333333[/C][C]134.217577176452[/C][C]153.009678503841[/C][/ROW]
[ROW][C]Winsorized Mean ( 4 / 20 )[/C][C]20540.7883333333[/C][C]131.739049375883[/C][C]155.920271405068[/C][/ROW]
[ROW][C]Winsorized Mean ( 5 / 20 )[/C][C]20521.4633333333[/C][C]125.964967216736[/C][C]162.914052905075[/C][/ROW]
[ROW][C]Winsorized Mean ( 6 / 20 )[/C][C]20518.8833333333[/C][C]123.993019718026[/C][C]165.484181125644[/C][/ROW]
[ROW][C]Winsorized Mean ( 7 / 20 )[/C][C]20517.4483333333[/C][C]119.231384753019[/C][C]172.080936372869[/C][/ROW]
[ROW][C]Winsorized Mean ( 8 / 20 )[/C][C]20507.0616666667[/C][C]114.553357909873[/C][C]179.017551653099[/C][/ROW]
[ROW][C]Winsorized Mean ( 9 / 20 )[/C][C]20501.2266666667[/C][C]113.405920661377[/C][C]180.777392812515[/C][/ROW]
[ROW][C]Winsorized Mean ( 10 / 20 )[/C][C]20526.5933333333[/C][C]108.6352660136[/C][C]188.949630139109[/C][/ROW]
[ROW][C]Winsorized Mean ( 11 / 20 )[/C][C]20543.3133333333[/C][C]103.904002942597[/C][C]197.714358942289[/C][/ROW]
[ROW][C]Winsorized Mean ( 12 / 20 )[/C][C]20541.9333333333[/C][C]100.543075364574[/C][C]204.309777265587[/C][/ROW]
[ROW][C]Winsorized Mean ( 13 / 20 )[/C][C]20514.4166666667[/C][C]94.0135990032919[/C][C]218.206907129982[/C][/ROW]
[ROW][C]Winsorized Mean ( 14 / 20 )[/C][C]20534.0166666667[/C][C]86.5847015220632[/C][C]237.155251513274[/C][/ROW]
[ROW][C]Winsorized Mean ( 15 / 20 )[/C][C]20490.0416666667[/C][C]78.3823364560824[/C][C]261.411468362483[/C][/ROW]
[ROW][C]Winsorized Mean ( 16 / 20 )[/C][C]20489.2416666667[/C][C]71.1034022361619[/C][C]288.16119935603[/C][/ROW]
[ROW][C]Winsorized Mean ( 17 / 20 )[/C][C]20483.9433333333[/C][C]64.5320590132505[/C][C]317.422745323024[/C][/ROW]
[ROW][C]Winsorized Mean ( 18 / 20 )[/C][C]20485.0233333333[/C][C]64.1088438581497[/C][C]319.535061007487[/C][/ROW]
[ROW][C]Winsorized Mean ( 19 / 20 )[/C][C]20501.6166666667[/C][C]60.8036553951833[/C][C]337.177370890283[/C][/ROW]
[ROW][C]Winsorized Mean ( 20 / 20 )[/C][C]20500.15[/C][C]59.5975984187967[/C][C]343.976108834855[/C][/ROW]
[ROW][C]Trimmed Mean ( 1 / 20 )[/C][C]20520.5568965517[/C][C]138.999491290509[/C][C]147.630446025617[/C][/ROW]
[ROW][C]Trimmed Mean ( 2 / 20 )[/C][C]20520.2196428571[/C][C]132.173503430977[/C][C]155.25214290452[/C][/ROW]
[ROW][C]Trimmed Mean ( 3 / 20 )[/C][C]20524.4425925926[/C][C]126.131261966635[/C][C]162.722883070985[/C][/ROW]
[ROW][C]Trimmed Mean ( 4 / 20 )[/C][C]20519.7711538462[/C][C]121.962459679876[/C][C]168.246616276073[/C][/ROW]
[ROW][C]Trimmed Mean ( 5 / 20 )[/C][C]20513.466[/C][C]117.702763777653[/C][C]174.281939876544[/C][/ROW]
[ROW][C]Trimmed Mean ( 6 / 20 )[/C][C]20511.4666666667[/C][C]114.34299594221[/C][C]179.385422759374[/C][/ROW]
[ROW][C]Trimmed Mean ( 7 / 20 )[/C][C]20509.8543478261[/C][C]110.64179005832[/C][C]185.371678612712[/C][/ROW]
[ROW][C]Trimmed Mean ( 8 / 20 )[/C][C]20508.375[/C][C]107.268247565541[/C][C]191.187750946237[/C][/ROW]
[ROW][C]Trimmed Mean ( 9 / 20 )[/C][C]20508.6095238095[/C][C]104.166475176197[/C][C]196.88301336029[/C][/ROW]
[ROW][C]Trimmed Mean ( 10 / 20 )[/C][C]20509.84[/C][C]100.325985705062[/C][C]204.431980965478[/C][/ROW]
[ROW][C]Trimmed Mean ( 11 / 20 )[/C][C]20507.1947368421[/C][C]96.4974695787288[/C][C]212.51536259312[/C][/ROW]
[ROW][C]Trimmed Mean ( 12 / 20 )[/C][C]20501.7222222222[/C][C]92.5819793832772[/C][C]221.443982498449[/C][/ROW]
[ROW][C]Trimmed Mean ( 13 / 20 )[/C][C]20495.8088235294[/C][C]88.1003227536569[/C][C]232.641699631897[/C][/ROW]
[ROW][C]Trimmed Mean ( 14 / 20 )[/C][C]20493.125[/C][C]83.8215642725473[/C][C]244.485117616825[/C][/ROW]
[ROW][C]Trimmed Mean ( 15 / 20 )[/C][C]20487.2833333333[/C][C]79.970216881803[/C][C]256.186417045909[/C][/ROW]
[ROW][C]Trimmed Mean ( 16 / 20 )[/C][C]20486.8892857143[/C][C]77.0213435579591[/C][C]265.989767762202[/C][/ROW]
[ROW][C]Trimmed Mean ( 17 / 20 )[/C][C]20486.55[/C][C]74.9000752284721[/C][C]273.51841687086[/C][/ROW]
[ROW][C]Trimmed Mean ( 18 / 20 )[/C][C]20486.9333333333[/C][C]73.6449430229276[/C][C]278.185201758595[/C][/ROW]
[ROW][C]Trimmed Mean ( 19 / 20 )[/C][C]20487.2227272727[/C][C]71.3481030948282[/C][C]287.144602850104[/C][/ROW]
[ROW][C]Trimmed Mean ( 20 / 20 )[/C][C]20484.95[/C][C]68.5571780187512[/C][C]298.800951147626[/C][/ROW]
[ROW][C]Median[/C][C]20415.95[/C][C][/C][C][/C][/ROW]
[ROW][C]Midrange[/C][C]20337.45[/C][C][/C][C][/C][/ROW]
[ROW][C]Midmean - Weighted Average at Xnp[/C][C]20463.4096774194[/C][C][/C][C][/C][/ROW]
[ROW][C]Midmean - Weighted Average at X(n+1)p[/C][C]20487.2833333333[/C][C][/C][C][/C][/ROW]
[ROW][C]Midmean - Empirical Distribution Function[/C][C]20463.4096774194[/C][C][/C][C][/C][/ROW]
[ROW][C]Midmean - Empirical Distribution Function - Averaging[/C][C]20487.2833333333[/C][C][/C][C][/C][/ROW]
[ROW][C]Midmean - Empirical Distribution Function - Interpolation[/C][C]20487.2833333333[/C][C][/C][C][/C][/ROW]
[ROW][C]Midmean - Closest Observation[/C][C]20463.4096774194[/C][C][/C][C][/C][/ROW]
[ROW][C]Midmean - True Basic - Statistics Graphics Toolkit[/C][C]20487.2833333333[/C][C][/C][C][/C][/ROW]
[ROW][C]Midmean - MS Excel (old versions)[/C][C]20493.125[/C][C][/C][C][/C][/ROW]
[ROW][C]Number of observations[/C][C]60[/C][C][/C][C][/C][/ROW]
[/TABLE]
Source: https://freestatistics.org/blog/index.php?pk=&T=1

Globally Unique Identifier (entire table): ba.freestatistics.org/blog/index.php?pk=&T=1

As an alternative you can also use a QR Code:  

The GUIDs for individual cells are displayed in the table below:

Central Tendency - Ungrouped Data
MeasureValueS.E.Value/S.E.
Arithmetic Mean20514.4533333333148.649750028137138.005299904308
Geometric Mean20482.5413579744
Harmonic Mean20450.4812010529
Quadratic Mean20546.2041192122
Winsorized Mean ( 1 / 20 )20520.8716666667144.525732056636141.987668041183
Winsorized Mean ( 2 / 20 )20512.6183333333140.973433316646145.506978518847
Winsorized Mean ( 3 / 20 )20536.5883333333134.217577176452153.009678503841
Winsorized Mean ( 4 / 20 )20540.7883333333131.739049375883155.920271405068
Winsorized Mean ( 5 / 20 )20521.4633333333125.964967216736162.914052905075
Winsorized Mean ( 6 / 20 )20518.8833333333123.993019718026165.484181125644
Winsorized Mean ( 7 / 20 )20517.4483333333119.231384753019172.080936372869
Winsorized Mean ( 8 / 20 )20507.0616666667114.553357909873179.017551653099
Winsorized Mean ( 9 / 20 )20501.2266666667113.405920661377180.777392812515
Winsorized Mean ( 10 / 20 )20526.5933333333108.6352660136188.949630139109
Winsorized Mean ( 11 / 20 )20543.3133333333103.904002942597197.714358942289
Winsorized Mean ( 12 / 20 )20541.9333333333100.543075364574204.309777265587
Winsorized Mean ( 13 / 20 )20514.416666666794.0135990032919218.206907129982
Winsorized Mean ( 14 / 20 )20534.016666666786.5847015220632237.155251513274
Winsorized Mean ( 15 / 20 )20490.041666666778.3823364560824261.411468362483
Winsorized Mean ( 16 / 20 )20489.241666666771.1034022361619288.16119935603
Winsorized Mean ( 17 / 20 )20483.943333333364.5320590132505317.422745323024
Winsorized Mean ( 18 / 20 )20485.023333333364.1088438581497319.535061007487
Winsorized Mean ( 19 / 20 )20501.616666666760.8036553951833337.177370890283
Winsorized Mean ( 20 / 20 )20500.1559.5975984187967343.976108834855
Trimmed Mean ( 1 / 20 )20520.5568965517138.999491290509147.630446025617
Trimmed Mean ( 2 / 20 )20520.2196428571132.173503430977155.25214290452
Trimmed Mean ( 3 / 20 )20524.4425925926126.131261966635162.722883070985
Trimmed Mean ( 4 / 20 )20519.7711538462121.962459679876168.246616276073
Trimmed Mean ( 5 / 20 )20513.466117.702763777653174.281939876544
Trimmed Mean ( 6 / 20 )20511.4666666667114.34299594221179.385422759374
Trimmed Mean ( 7 / 20 )20509.8543478261110.64179005832185.371678612712
Trimmed Mean ( 8 / 20 )20508.375107.268247565541191.187750946237
Trimmed Mean ( 9 / 20 )20508.6095238095104.166475176197196.88301336029
Trimmed Mean ( 10 / 20 )20509.84100.325985705062204.431980965478
Trimmed Mean ( 11 / 20 )20507.194736842196.4974695787288212.51536259312
Trimmed Mean ( 12 / 20 )20501.722222222292.5819793832772221.443982498449
Trimmed Mean ( 13 / 20 )20495.808823529488.1003227536569232.641699631897
Trimmed Mean ( 14 / 20 )20493.12583.8215642725473244.485117616825
Trimmed Mean ( 15 / 20 )20487.283333333379.970216881803256.186417045909
Trimmed Mean ( 16 / 20 )20486.889285714377.0213435579591265.989767762202
Trimmed Mean ( 17 / 20 )20486.5574.9000752284721273.51841687086
Trimmed Mean ( 18 / 20 )20486.933333333373.6449430229276278.185201758595
Trimmed Mean ( 19 / 20 )20487.222727272771.3481030948282287.144602850104
Trimmed Mean ( 20 / 20 )20484.9568.5571780187512298.800951147626
Median20415.95
Midrange20337.45
Midmean - Weighted Average at Xnp20463.4096774194
Midmean - Weighted Average at X(n+1)p20487.2833333333
Midmean - Empirical Distribution Function20463.4096774194
Midmean - Empirical Distribution Function - Averaging20487.2833333333
Midmean - Empirical Distribution Function - Interpolation20487.2833333333
Midmean - Closest Observation20463.4096774194
Midmean - True Basic - Statistics Graphics Toolkit20487.2833333333
Midmean - MS Excel (old versions)20493.125
Number of observations60


Parameters (Session):
Parameters (R input):
R code (references can be found in the software module):
geomean <- function(x) {
return(exp(mean(log(x))))
}
harmean <- function(x) {
return(1/mean(1/x))
}
quamean <- function(x) {
return(sqrt(mean(x*x)))
}
winmean <- function(x) {
x <-sort(x[!is.na(x)])
n<-length(x)
denom <- 3
nodenom <- n/denom
if (nodenom>40) denom <- n/40
sqrtn = sqrt(n)
roundnodenom = floor(nodenom)
win <- array(NA,dim=c(roundnodenom,2))
for (j in 1:roundnodenom) {
win[j,1] <- (j*x[j+1]+sum(x[(j+1):(n-j)])+j*x[n-j])/n
win[j,2] <- sd(c(rep(x[j+1],j),x[(j+1):(n-j)],rep(x[n-j],j)))/sqrtn
}
return(win)
}
trimean <- function(x) {
x <-sort(x[!is.na(x)])
n<-length(x)
denom <- 3
nodenom <- n/denom
if (nodenom>40) denom <- n/40
sqrtn = sqrt(n)
roundnodenom = floor(nodenom)
tri <- array(NA,dim=c(roundnodenom,2))
for (j in 1:roundnodenom) {
tri[j,1] <- mean(x,trim=j/n)
tri[j,2] <- sd(x[(j+1):(n-j)]) / sqrt(n-j*2)
}
return(tri)
}
midrange <- function(x) {
return((max(x)+min(x))/2)
}
q1 <- function(data,n,p,i,f) {
np <- n*p;
i <<- floor(np)
f <<- np - i
qvalue <- (1-f)*data[i] + f*data[i+1]
}
q2 <- function(data,n,p,i,f) {
np <- (n+1)*p
i <<- floor(np)
f <<- np - i
qvalue <- (1-f)*data[i] + f*data[i+1]
}
q3 <- function(data,n,p,i,f) {
np <- n*p
i <<- floor(np)
f <<- np - i
if (f==0) {
qvalue <- data[i]
} else {
qvalue <- data[i+1]
}
}
q4 <- function(data,n,p,i,f) {
np <- n*p
i <<- floor(np)
f <<- np - i
if (f==0) {
qvalue <- (data[i]+data[i+1])/2
} else {
qvalue <- data[i+1]
}
}
q5 <- function(data,n,p,i,f) {
np <- (n-1)*p
i <<- floor(np)
f <<- np - i
if (f==0) {
qvalue <- data[i+1]
} else {
qvalue <- data[i+1] + f*(data[i+2]-data[i+1])
}
}
q6 <- function(data,n,p,i,f) {
np <- n*p+0.5
i <<- floor(np)
f <<- np - i
qvalue <- data[i]
}
q7 <- function(data,n,p,i,f) {
np <- (n+1)*p
i <<- floor(np)
f <<- np - i
if (f==0) {
qvalue <- data[i]
} else {
qvalue <- f*data[i] + (1-f)*data[i+1]
}
}
q8 <- function(data,n,p,i,f) {
np <- (n+1)*p
i <<- floor(np)
f <<- np - i
if (f==0) {
qvalue <- data[i]
} else {
if (f == 0.5) {
qvalue <- (data[i]+data[i+1])/2
} else {
if (f < 0.5) {
qvalue <- data[i]
} else {
qvalue <- data[i+1]
}
}
}
}
midmean <- function(x,def) {
x <-sort(x[!is.na(x)])
n<-length(x)
if (def==1) {
qvalue1 <- q1(x,n,0.25,i,f)
qvalue3 <- q1(x,n,0.75,i,f)
}
if (def==2) {
qvalue1 <- q2(x,n,0.25,i,f)
qvalue3 <- q2(x,n,0.75,i,f)
}
if (def==3) {
qvalue1 <- q3(x,n,0.25,i,f)
qvalue3 <- q3(x,n,0.75,i,f)
}
if (def==4) {
qvalue1 <- q4(x,n,0.25,i,f)
qvalue3 <- q4(x,n,0.75,i,f)
}
if (def==5) {
qvalue1 <- q5(x,n,0.25,i,f)
qvalue3 <- q5(x,n,0.75,i,f)
}
if (def==6) {
qvalue1 <- q6(x,n,0.25,i,f)
qvalue3 <- q6(x,n,0.75,i,f)
}
if (def==7) {
qvalue1 <- q7(x,n,0.25,i,f)
qvalue3 <- q7(x,n,0.75,i,f)
}
if (def==8) {
qvalue1 <- q8(x,n,0.25,i,f)
qvalue3 <- q8(x,n,0.75,i,f)
}
midm <- 0
myn <- 0
roundno4 <- round(n/4)
round3no4 <- round(3*n/4)
for (i in 1:n) {
if ((x[i]>=qvalue1) & (x[i]<=qvalue3)){
midm = midm + x[i]
myn = myn + 1
}
}
midm = midm / myn
return(midm)
}
(arm <- mean(x))
sqrtn <- sqrt(length(x))
(armse <- sd(x) / sqrtn)
(armose <- arm / armse)
(geo <- geomean(x))
(har <- harmean(x))
(qua <- quamean(x))
(win <- winmean(x))
(tri <- trimean(x))
(midr <- midrange(x))
midm <- array(NA,dim=8)
for (j in 1:8) midm[j] <- midmean(x,j)
midm
bitmap(file='test1.png')
lb <- win[,1] - 2*win[,2]
ub <- win[,1] + 2*win[,2]
if ((ylimmin == '') | (ylimmax == '')) plot(win[,1],type='b',main=main, xlab='j', pch=19, ylab='Winsorized Mean(j/n)', ylim=c(min(lb),max(ub))) else plot(win[,1],type='l',main=main, xlab='j', pch=19, ylab='Winsorized Mean(j/n)', ylim=c(ylimmin,ylimmax))
lines(ub,lty=3)
lines(lb,lty=3)
grid()
dev.off()
bitmap(file='test2.png')
lb <- tri[,1] - 2*tri[,2]
ub <- tri[,1] + 2*tri[,2]
if ((ylimmin == '') | (ylimmax == '')) plot(tri[,1],type='b',main=main, xlab='j', pch=19, ylab='Trimmed Mean(j/n)', ylim=c(min(lb),max(ub))) else plot(tri[,1],type='l',main=main, xlab='j', pch=19, ylab='Trimmed Mean(j/n)', ylim=c(ylimmin,ylimmax))
lines(ub,lty=3)
lines(lb,lty=3)
grid()
dev.off()
load(file='createtable')
a<-table.start()
a<-table.row.start(a)
a<-table.element(a,'Central Tendency - Ungrouped Data',4,TRUE)
a<-table.row.end(a)
a<-table.row.start(a)
a<-table.element(a,'Measure',header=TRUE)
a<-table.element(a,'Value',header=TRUE)
a<-table.element(a,'S.E.',header=TRUE)
a<-table.element(a,'Value/S.E.',header=TRUE)
a<-table.row.end(a)
a<-table.row.start(a)
a<-table.element(a,hyperlink('arithmetic_mean.htm', 'Arithmetic Mean', 'click to view the definition of the Arithmetic Mean'),header=TRUE)
a<-table.element(a,arm)
a<-table.element(a,hyperlink('arithmetic_mean_standard_error.htm', armse, 'click to view the definition of the Standard Error of the Arithmetic Mean'))
a<-table.element(a,armose)
a<-table.row.end(a)
a<-table.row.start(a)
a<-table.element(a,hyperlink('geometric_mean.htm', 'Geometric Mean', 'click to view the definition of the Geometric Mean'),header=TRUE)
a<-table.element(a,geo)
a<-table.element(a,'')
a<-table.row.end(a)
a<-table.row.start(a)
a<-table.element(a,hyperlink('harmonic_mean.htm', 'Harmonic Mean', 'click to view the definition of the Harmonic Mean'),header=TRUE)
a<-table.element(a,har)
a<-table.element(a,'')
a<-table.row.end(a)
a<-table.row.start(a)
a<-table.element(a,hyperlink('quadratic_mean.htm', 'Quadratic Mean', 'click to view the definition of the Quadratic Mean'),header=TRUE)
a<-table.element(a,qua)
a<-table.element(a,'')
a<-table.row.end(a)
for (j in 1:length(win[,1])) {
a<-table.row.start(a)
mylabel <- paste('Winsorized Mean (',j)
mylabel <- paste(mylabel,'/')
mylabel <- paste(mylabel,length(win[,1]))
mylabel <- paste(mylabel,')')
a<-table.element(a,hyperlink('winsorized_mean.htm', mylabel, 'click to view the definition of the Winsorized Mean'),header=TRUE)
a<-table.element(a,win[j,1])
a<-table.element(a,win[j,2])
a<-table.element(a,win[j,1]/win[j,2])
a<-table.row.end(a)
}
for (j in 1:length(tri[,1])) {
a<-table.row.start(a)
mylabel <- paste('Trimmed Mean (',j)
mylabel <- paste(mylabel,'/')
mylabel <- paste(mylabel,length(tri[,1]))
mylabel <- paste(mylabel,')')
a<-table.element(a,hyperlink('arithmetic_mean.htm', mylabel, 'click to view the definition of the Trimmed Mean'),header=TRUE)
a<-table.element(a,tri[j,1])
a<-table.element(a,tri[j,2])
a<-table.element(a,tri[j,1]/tri[j,2])
a<-table.row.end(a)
}
a<-table.row.start(a)
a<-table.element(a,hyperlink('median_1.htm', 'Median', 'click to view the definition of the Median'),header=TRUE)
a<-table.element(a,median(x))
a<-table.element(a,'')
a<-table.row.end(a)
a<-table.row.start(a)
a<-table.element(a,hyperlink('midrange.htm', 'Midrange', 'click to view the definition of the Midrange'),header=TRUE)
a<-table.element(a,midr)
a<-table.element(a,'')
a<-table.row.end(a)
a<-table.row.start(a)
mymid <- hyperlink('midmean.htm', 'Midmean', 'click to view the definition of the Midmean')
mylabel <- paste(mymid,hyperlink('method_1.htm','Weighted Average at Xnp',''),sep=' - ')
a<-table.element(a,mylabel,header=TRUE)
a<-table.element(a,midm[1])
a<-table.element(a,'')
a<-table.row.end(a)
a<-table.row.start(a)
mymid <- hyperlink('midmean.htm', 'Midmean', 'click to view the definition of the Midmean')
mylabel <- paste(mymid,hyperlink('method_2.htm','Weighted Average at X(n+1)p',''),sep=' - ')
a<-table.element(a,mylabel,header=TRUE)
a<-table.element(a,midm[2])
a<-table.element(a,'')
a<-table.row.end(a)
a<-table.row.start(a)
mymid <- hyperlink('midmean.htm', 'Midmean', 'click to view the definition of the Midmean')
mylabel <- paste(mymid,hyperlink('method_3.htm','Empirical Distribution Function',''),sep=' - ')
a<-table.element(a,mylabel,header=TRUE)
a<-table.element(a,midm[3])
a<-table.element(a,'')
a<-table.row.end(a)
a<-table.row.start(a)
mymid <- hyperlink('midmean.htm', 'Midmean', 'click to view the definition of the Midmean')
mylabel <- paste(mymid,hyperlink('method_4.htm','Empirical Distribution Function - Averaging',''),sep=' - ')
a<-table.element(a,mylabel,header=TRUE)
a<-table.element(a,midm[4])
a<-table.element(a,'')
a<-table.row.end(a)
a<-table.row.start(a)
mymid <- hyperlink('midmean.htm', 'Midmean', 'click to view the definition of the Midmean')
mylabel <- paste(mymid,hyperlink('method_5.htm','Empirical Distribution Function - Interpolation',''),sep=' - ')
a<-table.element(a,mylabel,header=TRUE)
a<-table.element(a,midm[5])
a<-table.element(a,'')
a<-table.row.end(a)
a<-table.row.start(a)
mymid <- hyperlink('midmean.htm', 'Midmean', 'click to view the definition of the Midmean')
mylabel <- paste(mymid,hyperlink('method_6.htm','Closest Observation',''),sep=' - ')
a<-table.element(a,mylabel,header=TRUE)
a<-table.element(a,midm[6])
a<-table.element(a,'')
a<-table.row.end(a)
a<-table.row.start(a)
mymid <- hyperlink('midmean.htm', 'Midmean', 'click to view the definition of the Midmean')
mylabel <- paste(mymid,hyperlink('method_7.htm','True Basic - Statistics Graphics Toolkit',''),sep=' - ')
a<-table.element(a,mylabel,header=TRUE)
a<-table.element(a,midm[7])
a<-table.element(a,'')
a<-table.row.end(a)
a<-table.row.start(a)
mymid <- hyperlink('midmean.htm', 'Midmean', 'click to view the definition of the Midmean')
mylabel <- paste(mymid,hyperlink('method_8.htm','MS Excel (old versions)',''),sep=' - ')
a<-table.element(a,mylabel,header=TRUE)
a<-table.element(a,midm[8])
a<-table.element(a,'')
a<-table.row.end(a)
a<-table.row.start(a)
a<-table.element(a,'Number of observations',header=TRUE)
a<-table.element(a,length(x))
a<-table.element(a,'')
a<-table.row.end(a)
a<-table.end(a)
table.save(a,file='mytable.tab')