Free Statistics

of Irreproducible Research!

Author's title

Author*Unverified author*
R Software Modulerwasp_exponentialsmoothing.wasp
Title produced by softwareExponential Smoothing
Date of computationWed, 03 May 2017 20:15:23 +0100
Cite this page as followsStatistical Computations at FreeStatistics.org, Office for Research Development and Education, URL https://freestatistics.org/blog/index.php?v=date/2017/May/03/t1493838942e7udx0kn3wj9wop.htm/, Retrieved Fri, 17 May 2024 06:59:32 +0200
Statistical Computations at FreeStatistics.org, Office for Research Development and Education, URL https://freestatistics.org/blog/index.php?pk=, Retrieved Fri, 17 May 2024 06:59:32 +0200
QR Codes:

Original text written by user:
IsPrivate?No (this computation is public)
User-defined keywords
Estimated Impact0
Dataseries X:
99,49
99,84
100,9
101,31
100,09
99,28
99,57
101,04
101,87
101,39
100,3
99,95
99,87
100,51
100,27
100,04
99,23
99,32
99,95
100,23
101,02
99,83
99,61
100,12
99,83
100,03
100,07
100,46
100,43
100,68
101,8
101,21
100,63
100,55
99,76
98,8
96,59
97,59
98,79
98,79
99,65
99,78
100,05
99,22
97,72
97,55
98,14
97,95
97,24
97,02
97,57
98,07
98,86
99,57
100,14
99,88
99,79
100,59
100,55
101,42


Summary of computational transaction
Raw Inputview raw input (R code)
Raw Outputview raw output of R engine
Computing time2 seconds
R Server'Herman Ole Andreas Wold' @ wold.wessa.net

\begin{tabular}{lllllllll}
\hline
Summary of computational transaction \tabularnewline
Raw Input & view raw input (R code)  \tabularnewline
Raw Output & view raw output of R engine  \tabularnewline
Computing time & 2 seconds \tabularnewline
R Server & 'Herman Ole Andreas Wold' @ wold.wessa.net \tabularnewline
\hline
\end{tabular}
%Source: https://freestatistics.org/blog/index.php?pk=&T=0

[TABLE]
[ROW][C]Summary of computational transaction[/C][/ROW]
[ROW][C]Raw Input[/C][C]view raw input (R code) [/C][/ROW]
[ROW][C]Raw Output[/C][C]view raw output of R engine [/C][/ROW]
[ROW][C]Computing time[/C][C]2 seconds[/C][/ROW]
[ROW][C]R Server[/C][C]'Herman Ole Andreas Wold' @ wold.wessa.net[/C][/ROW]
[/TABLE]
Source: https://freestatistics.org/blog/index.php?pk=&T=0

Globally Unique Identifier (entire table): ba.freestatistics.org/blog/index.php?pk=&T=0

As an alternative you can also use a QR Code:  

The GUIDs for individual cells are displayed in the table below:

Summary of computational transaction
Raw Inputview raw input (R code)
Raw Outputview raw output of R engine
Computing time2 seconds
R Server'Herman Ole Andreas Wold' @ wold.wessa.net


Estimated Parameters of Exponential Smoothing
ParameterValue
alpha0.626892786049989
beta0
gamma1

\begin{tabular}{lllllllll}
\hline
Estimated Parameters of Exponential Smoothing \tabularnewline
Parameter & Value \tabularnewline
alpha & 0.626892786049989 \tabularnewline
beta & 0 \tabularnewline
gamma & 1 \tabularnewline
\hline
\end{tabular}
%Source: https://freestatistics.org/blog/index.php?pk=&T=1

[TABLE]
[ROW][C]Estimated Parameters of Exponential Smoothing[/C][/ROW]
[ROW][C]Parameter[/C][C]Value[/C][/ROW]
[ROW][C]alpha[/C][C]0.626892786049989[/C][/ROW]
[ROW][C]beta[/C][C]0[/C][/ROW]
[ROW][C]gamma[/C][C]1[/C][/ROW]
[/TABLE]
Source: https://freestatistics.org/blog/index.php?pk=&T=1

Globally Unique Identifier (entire table): ba.freestatistics.org/blog/index.php?pk=&T=1

As an alternative you can also use a QR Code:  

The GUIDs for individual cells are displayed in the table below:

Estimated Parameters of Exponential Smoothing
ParameterValue
alpha0.626892786049989
beta0
gamma1


Interpolation Forecasts of Exponential Smoothing
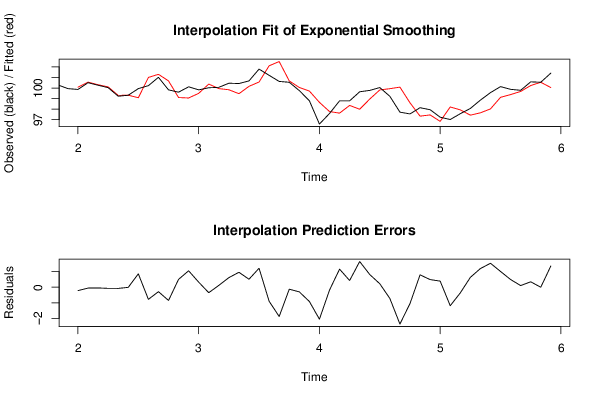
tObservedFittedResiduals
1399.87100.085707799145-0.215707799145335
14100.51100.564015061374-0.0540150613743151
15100.27100.314936334469-0.0449363344686304
16100.04100.112798995967-0.0727989959666644
1799.2399.3065280893047-0.0765280893047304
1899.3299.3258361075973-0.00583610759730391
1999.9599.08571041925390.864289580746117
20100.23101.009393581223-0.779393581223061
21101.02101.304746959735-0.284746959735244
2299.83100.681024070235-0.851024070235468
2399.6199.10188947859120.508110521408767
24100.1299.06020322438641.05979677561359
2599.8399.50221630047250.327783699527529
26100.03100.381563189405-0.351563189404658
27100.0799.94934102603610.120658973963941
28100.4699.84061843178950.619381568210542
29100.4399.46687917582830.963120824171696
30100.68100.1643112863470.515688713652594
31101.8100.5757759175561.22422408244428
32101.21102.111829376911-0.90182937691111
33100.63102.514984861185-1.88498486118526
34100.55100.67680230028-0.126802300280289
3599.76100.058780032593-0.298780032592759
3698.899.7170980322334-0.917098032233397
3796.5998.6466906551071-2.05669065510705
3897.5997.7777585475625-0.187758547562538
3998.7997.62441382822621.16558617177385
4098.7998.35682555390730.433174446092721
4199.6597.99460599249631.65539400750373
4299.7898.95907901943450.820920980565461
43100.0599.82625121427510.223748785724879
4499.2299.941868044567-0.721868044567017
4597.72100.091017586238-2.37101758623842
4697.5598.6041352131282-1.05413521312818
4798.1497.3406084995450.799391500454959
4897.9597.45666340491770.493336595082326
4997.2496.84525709229230.394742907707709
5097.0298.2104230524648-1.19042305246482
5197.5797.9334578659224-0.363457865922371
5298.0797.43405481638580.635945183614226
5398.8697.65496970294231.20503029705772
5499.5798.02576506250591.54423493749412
55100.1499.12356830512891.01643169487107
5699.8899.38329587177520.496704128224749
5799.7999.68104992697110.108950073028893
58100.59100.2401797024240.349820297576144
59100.55100.5483467585230.00165324147668855
60101.42100.0501140111271.36988598887294

\begin{tabular}{lllllllll}
\hline
Interpolation Forecasts of Exponential Smoothing \tabularnewline
t & Observed & Fitted & Residuals \tabularnewline
13 & 99.87 & 100.085707799145 & -0.215707799145335 \tabularnewline
14 & 100.51 & 100.564015061374 & -0.0540150613743151 \tabularnewline
15 & 100.27 & 100.314936334469 & -0.0449363344686304 \tabularnewline
16 & 100.04 & 100.112798995967 & -0.0727989959666644 \tabularnewline
17 & 99.23 & 99.3065280893047 & -0.0765280893047304 \tabularnewline
18 & 99.32 & 99.3258361075973 & -0.00583610759730391 \tabularnewline
19 & 99.95 & 99.0857104192539 & 0.864289580746117 \tabularnewline
20 & 100.23 & 101.009393581223 & -0.779393581223061 \tabularnewline
21 & 101.02 & 101.304746959735 & -0.284746959735244 \tabularnewline
22 & 99.83 & 100.681024070235 & -0.851024070235468 \tabularnewline
23 & 99.61 & 99.1018894785912 & 0.508110521408767 \tabularnewline
24 & 100.12 & 99.0602032243864 & 1.05979677561359 \tabularnewline
25 & 99.83 & 99.5022163004725 & 0.327783699527529 \tabularnewline
26 & 100.03 & 100.381563189405 & -0.351563189404658 \tabularnewline
27 & 100.07 & 99.9493410260361 & 0.120658973963941 \tabularnewline
28 & 100.46 & 99.8406184317895 & 0.619381568210542 \tabularnewline
29 & 100.43 & 99.4668791758283 & 0.963120824171696 \tabularnewline
30 & 100.68 & 100.164311286347 & 0.515688713652594 \tabularnewline
31 & 101.8 & 100.575775917556 & 1.22422408244428 \tabularnewline
32 & 101.21 & 102.111829376911 & -0.90182937691111 \tabularnewline
33 & 100.63 & 102.514984861185 & -1.88498486118526 \tabularnewline
34 & 100.55 & 100.67680230028 & -0.126802300280289 \tabularnewline
35 & 99.76 & 100.058780032593 & -0.298780032592759 \tabularnewline
36 & 98.8 & 99.7170980322334 & -0.917098032233397 \tabularnewline
37 & 96.59 & 98.6466906551071 & -2.05669065510705 \tabularnewline
38 & 97.59 & 97.7777585475625 & -0.187758547562538 \tabularnewline
39 & 98.79 & 97.6244138282262 & 1.16558617177385 \tabularnewline
40 & 98.79 & 98.3568255539073 & 0.433174446092721 \tabularnewline
41 & 99.65 & 97.9946059924963 & 1.65539400750373 \tabularnewline
42 & 99.78 & 98.9590790194345 & 0.820920980565461 \tabularnewline
43 & 100.05 & 99.8262512142751 & 0.223748785724879 \tabularnewline
44 & 99.22 & 99.941868044567 & -0.721868044567017 \tabularnewline
45 & 97.72 & 100.091017586238 & -2.37101758623842 \tabularnewline
46 & 97.55 & 98.6041352131282 & -1.05413521312818 \tabularnewline
47 & 98.14 & 97.340608499545 & 0.799391500454959 \tabularnewline
48 & 97.95 & 97.4566634049177 & 0.493336595082326 \tabularnewline
49 & 97.24 & 96.8452570922923 & 0.394742907707709 \tabularnewline
50 & 97.02 & 98.2104230524648 & -1.19042305246482 \tabularnewline
51 & 97.57 & 97.9334578659224 & -0.363457865922371 \tabularnewline
52 & 98.07 & 97.4340548163858 & 0.635945183614226 \tabularnewline
53 & 98.86 & 97.6549697029423 & 1.20503029705772 \tabularnewline
54 & 99.57 & 98.0257650625059 & 1.54423493749412 \tabularnewline
55 & 100.14 & 99.1235683051289 & 1.01643169487107 \tabularnewline
56 & 99.88 & 99.3832958717752 & 0.496704128224749 \tabularnewline
57 & 99.79 & 99.6810499269711 & 0.108950073028893 \tabularnewline
58 & 100.59 & 100.240179702424 & 0.349820297576144 \tabularnewline
59 & 100.55 & 100.548346758523 & 0.00165324147668855 \tabularnewline
60 & 101.42 & 100.050114011127 & 1.36988598887294 \tabularnewline
\hline
\end{tabular}
%Source: https://freestatistics.org/blog/index.php?pk=&T=2

[TABLE]
[ROW][C]Interpolation Forecasts of Exponential Smoothing[/C][/ROW]
[ROW][C]t[/C][C]Observed[/C][C]Fitted[/C][C]Residuals[/C][/ROW]
[ROW][C]13[/C][C]99.87[/C][C]100.085707799145[/C][C]-0.215707799145335[/C][/ROW]
[ROW][C]14[/C][C]100.51[/C][C]100.564015061374[/C][C]-0.0540150613743151[/C][/ROW]
[ROW][C]15[/C][C]100.27[/C][C]100.314936334469[/C][C]-0.0449363344686304[/C][/ROW]
[ROW][C]16[/C][C]100.04[/C][C]100.112798995967[/C][C]-0.0727989959666644[/C][/ROW]
[ROW][C]17[/C][C]99.23[/C][C]99.3065280893047[/C][C]-0.0765280893047304[/C][/ROW]
[ROW][C]18[/C][C]99.32[/C][C]99.3258361075973[/C][C]-0.00583610759730391[/C][/ROW]
[ROW][C]19[/C][C]99.95[/C][C]99.0857104192539[/C][C]0.864289580746117[/C][/ROW]
[ROW][C]20[/C][C]100.23[/C][C]101.009393581223[/C][C]-0.779393581223061[/C][/ROW]
[ROW][C]21[/C][C]101.02[/C][C]101.304746959735[/C][C]-0.284746959735244[/C][/ROW]
[ROW][C]22[/C][C]99.83[/C][C]100.681024070235[/C][C]-0.851024070235468[/C][/ROW]
[ROW][C]23[/C][C]99.61[/C][C]99.1018894785912[/C][C]0.508110521408767[/C][/ROW]
[ROW][C]24[/C][C]100.12[/C][C]99.0602032243864[/C][C]1.05979677561359[/C][/ROW]
[ROW][C]25[/C][C]99.83[/C][C]99.5022163004725[/C][C]0.327783699527529[/C][/ROW]
[ROW][C]26[/C][C]100.03[/C][C]100.381563189405[/C][C]-0.351563189404658[/C][/ROW]
[ROW][C]27[/C][C]100.07[/C][C]99.9493410260361[/C][C]0.120658973963941[/C][/ROW]
[ROW][C]28[/C][C]100.46[/C][C]99.8406184317895[/C][C]0.619381568210542[/C][/ROW]
[ROW][C]29[/C][C]100.43[/C][C]99.4668791758283[/C][C]0.963120824171696[/C][/ROW]
[ROW][C]30[/C][C]100.68[/C][C]100.164311286347[/C][C]0.515688713652594[/C][/ROW]
[ROW][C]31[/C][C]101.8[/C][C]100.575775917556[/C][C]1.22422408244428[/C][/ROW]
[ROW][C]32[/C][C]101.21[/C][C]102.111829376911[/C][C]-0.90182937691111[/C][/ROW]
[ROW][C]33[/C][C]100.63[/C][C]102.514984861185[/C][C]-1.88498486118526[/C][/ROW]
[ROW][C]34[/C][C]100.55[/C][C]100.67680230028[/C][C]-0.126802300280289[/C][/ROW]
[ROW][C]35[/C][C]99.76[/C][C]100.058780032593[/C][C]-0.298780032592759[/C][/ROW]
[ROW][C]36[/C][C]98.8[/C][C]99.7170980322334[/C][C]-0.917098032233397[/C][/ROW]
[ROW][C]37[/C][C]96.59[/C][C]98.6466906551071[/C][C]-2.05669065510705[/C][/ROW]
[ROW][C]38[/C][C]97.59[/C][C]97.7777585475625[/C][C]-0.187758547562538[/C][/ROW]
[ROW][C]39[/C][C]98.79[/C][C]97.6244138282262[/C][C]1.16558617177385[/C][/ROW]
[ROW][C]40[/C][C]98.79[/C][C]98.3568255539073[/C][C]0.433174446092721[/C][/ROW]
[ROW][C]41[/C][C]99.65[/C][C]97.9946059924963[/C][C]1.65539400750373[/C][/ROW]
[ROW][C]42[/C][C]99.78[/C][C]98.9590790194345[/C][C]0.820920980565461[/C][/ROW]
[ROW][C]43[/C][C]100.05[/C][C]99.8262512142751[/C][C]0.223748785724879[/C][/ROW]
[ROW][C]44[/C][C]99.22[/C][C]99.941868044567[/C][C]-0.721868044567017[/C][/ROW]
[ROW][C]45[/C][C]97.72[/C][C]100.091017586238[/C][C]-2.37101758623842[/C][/ROW]
[ROW][C]46[/C][C]97.55[/C][C]98.6041352131282[/C][C]-1.05413521312818[/C][/ROW]
[ROW][C]47[/C][C]98.14[/C][C]97.340608499545[/C][C]0.799391500454959[/C][/ROW]
[ROW][C]48[/C][C]97.95[/C][C]97.4566634049177[/C][C]0.493336595082326[/C][/ROW]
[ROW][C]49[/C][C]97.24[/C][C]96.8452570922923[/C][C]0.394742907707709[/C][/ROW]
[ROW][C]50[/C][C]97.02[/C][C]98.2104230524648[/C][C]-1.19042305246482[/C][/ROW]
[ROW][C]51[/C][C]97.57[/C][C]97.9334578659224[/C][C]-0.363457865922371[/C][/ROW]
[ROW][C]52[/C][C]98.07[/C][C]97.4340548163858[/C][C]0.635945183614226[/C][/ROW]
[ROW][C]53[/C][C]98.86[/C][C]97.6549697029423[/C][C]1.20503029705772[/C][/ROW]
[ROW][C]54[/C][C]99.57[/C][C]98.0257650625059[/C][C]1.54423493749412[/C][/ROW]
[ROW][C]55[/C][C]100.14[/C][C]99.1235683051289[/C][C]1.01643169487107[/C][/ROW]
[ROW][C]56[/C][C]99.88[/C][C]99.3832958717752[/C][C]0.496704128224749[/C][/ROW]
[ROW][C]57[/C][C]99.79[/C][C]99.6810499269711[/C][C]0.108950073028893[/C][/ROW]
[ROW][C]58[/C][C]100.59[/C][C]100.240179702424[/C][C]0.349820297576144[/C][/ROW]
[ROW][C]59[/C][C]100.55[/C][C]100.548346758523[/C][C]0.00165324147668855[/C][/ROW]
[ROW][C]60[/C][C]101.42[/C][C]100.050114011127[/C][C]1.36988598887294[/C][/ROW]
[/TABLE]
Source: https://freestatistics.org/blog/index.php?pk=&T=2

Globally Unique Identifier (entire table): ba.freestatistics.org/blog/index.php?pk=&T=2

As an alternative you can also use a QR Code:  

The GUIDs for individual cells are displayed in the table below:

Interpolation Forecasts of Exponential Smoothing
tObservedFittedResiduals
1399.87100.085707799145-0.215707799145335
14100.51100.564015061374-0.0540150613743151
15100.27100.314936334469-0.0449363344686304
16100.04100.112798995967-0.0727989959666644
1799.2399.3065280893047-0.0765280893047304
1899.3299.3258361075973-0.00583610759730391
1999.9599.08571041925390.864289580746117
20100.23101.009393581223-0.779393581223061
21101.02101.304746959735-0.284746959735244
2299.83100.681024070235-0.851024070235468
2399.6199.10188947859120.508110521408767
24100.1299.06020322438641.05979677561359
2599.8399.50221630047250.327783699527529
26100.03100.381563189405-0.351563189404658
27100.0799.94934102603610.120658973963941
28100.4699.84061843178950.619381568210542
29100.4399.46687917582830.963120824171696
30100.68100.1643112863470.515688713652594
31101.8100.5757759175561.22422408244428
32101.21102.111829376911-0.90182937691111
33100.63102.514984861185-1.88498486118526
34100.55100.67680230028-0.126802300280289
3599.76100.058780032593-0.298780032592759
3698.899.7170980322334-0.917098032233397
3796.5998.6466906551071-2.05669065510705
3897.5997.7777585475625-0.187758547562538
3998.7997.62441382822621.16558617177385
4098.7998.35682555390730.433174446092721
4199.6597.99460599249631.65539400750373
4299.7898.95907901943450.820920980565461
43100.0599.82625121427510.223748785724879
4499.2299.941868044567-0.721868044567017
4597.72100.091017586238-2.37101758623842
4697.5598.6041352131282-1.05413521312818
4798.1497.3406084995450.799391500454959
4897.9597.45666340491770.493336595082326
4997.2496.84525709229230.394742907707709
5097.0298.2104230524648-1.19042305246482
5197.5797.9334578659224-0.363457865922371
5298.0797.43405481638580.635945183614226
5398.8697.65496970294231.20503029705772
5499.5798.02576506250591.54423493749412
55100.1499.12356830512891.01643169487107
5699.8899.38329587177520.496704128224749
5799.7999.68104992697110.108950073028893
58100.59100.2401797024240.349820297576144
59100.55100.5483467585230.00165324147668855
60101.42100.0501140111271.36988598887294


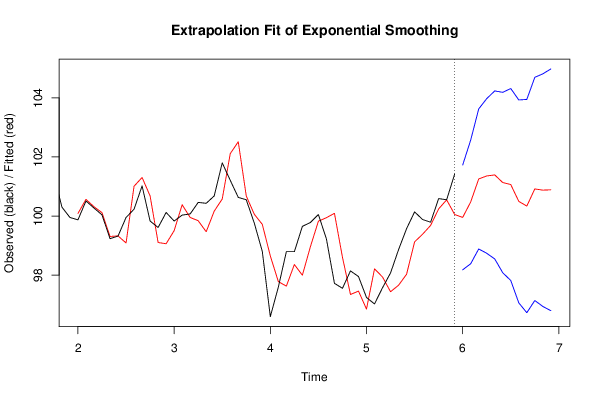
Extrapolation Forecasts of Exponential Smoothing
tForecast95% Lower Bound95% Upper Bound
6199.951424174076198.1766956531547101.726152694998
62100.47769179801498.3830650758685102.572318520159
63101.25554091219498.8837776678376103.62730415655
64101.35687146426398.7371270741681103.976615854357
65101.39144666406698.5452456079935104.237647720138
66101.13337692178498.077454764114104.189299079454
67101.06618322475797.8140362391653104.318330210349
68100.49480298997297.0576152153445103.931990764599
69100.3365029751596.723739548049103.949266402251
70100.91720315418697.1370101217663104.697396186605
71100.8761667490396.9356516628385104.816681835222
72100.88739510489596.7928305460366104.981959663754

\begin{tabular}{lllllllll}
\hline
Extrapolation Forecasts of Exponential Smoothing \tabularnewline
t & Forecast & 95% Lower Bound & 95% Upper Bound \tabularnewline
61 & 99.9514241740761 & 98.1766956531547 & 101.726152694998 \tabularnewline
62 & 100.477691798014 & 98.3830650758685 & 102.572318520159 \tabularnewline
63 & 101.255540912194 & 98.8837776678376 & 103.62730415655 \tabularnewline
64 & 101.356871464263 & 98.7371270741681 & 103.976615854357 \tabularnewline
65 & 101.391446664066 & 98.5452456079935 & 104.237647720138 \tabularnewline
66 & 101.133376921784 & 98.077454764114 & 104.189299079454 \tabularnewline
67 & 101.066183224757 & 97.8140362391653 & 104.318330210349 \tabularnewline
68 & 100.494802989972 & 97.0576152153445 & 103.931990764599 \tabularnewline
69 & 100.33650297515 & 96.723739548049 & 103.949266402251 \tabularnewline
70 & 100.917203154186 & 97.1370101217663 & 104.697396186605 \tabularnewline
71 & 100.87616674903 & 96.9356516628385 & 104.816681835222 \tabularnewline
72 & 100.887395104895 & 96.7928305460366 & 104.981959663754 \tabularnewline
\hline
\end{tabular}
%Source: https://freestatistics.org/blog/index.php?pk=&T=3

[TABLE]
[ROW][C]Extrapolation Forecasts of Exponential Smoothing[/C][/ROW]
[ROW][C]t[/C][C]Forecast[/C][C]95% Lower Bound[/C][C]95% Upper Bound[/C][/ROW]
[ROW][C]61[/C][C]99.9514241740761[/C][C]98.1766956531547[/C][C]101.726152694998[/C][/ROW]
[ROW][C]62[/C][C]100.477691798014[/C][C]98.3830650758685[/C][C]102.572318520159[/C][/ROW]
[ROW][C]63[/C][C]101.255540912194[/C][C]98.8837776678376[/C][C]103.62730415655[/C][/ROW]
[ROW][C]64[/C][C]101.356871464263[/C][C]98.7371270741681[/C][C]103.976615854357[/C][/ROW]
[ROW][C]65[/C][C]101.391446664066[/C][C]98.5452456079935[/C][C]104.237647720138[/C][/ROW]
[ROW][C]66[/C][C]101.133376921784[/C][C]98.077454764114[/C][C]104.189299079454[/C][/ROW]
[ROW][C]67[/C][C]101.066183224757[/C][C]97.8140362391653[/C][C]104.318330210349[/C][/ROW]
[ROW][C]68[/C][C]100.494802989972[/C][C]97.0576152153445[/C][C]103.931990764599[/C][/ROW]
[ROW][C]69[/C][C]100.33650297515[/C][C]96.723739548049[/C][C]103.949266402251[/C][/ROW]
[ROW][C]70[/C][C]100.917203154186[/C][C]97.1370101217663[/C][C]104.697396186605[/C][/ROW]
[ROW][C]71[/C][C]100.87616674903[/C][C]96.9356516628385[/C][C]104.816681835222[/C][/ROW]
[ROW][C]72[/C][C]100.887395104895[/C][C]96.7928305460366[/C][C]104.981959663754[/C][/ROW]
[/TABLE]
Source: https://freestatistics.org/blog/index.php?pk=&T=3

Globally Unique Identifier (entire table): ba.freestatistics.org/blog/index.php?pk=&T=3

As an alternative you can also use a QR Code:  

The GUIDs for individual cells are displayed in the table below:

Extrapolation Forecasts of Exponential Smoothing
tForecast95% Lower Bound95% Upper Bound
6199.951424174076198.1766956531547101.726152694998
62100.47769179801498.3830650758685102.572318520159
63101.25554091219498.8837776678376103.62730415655
64101.35687146426398.7371270741681103.976615854357
65101.39144666406698.5452456079935104.237647720138
66101.13337692178498.077454764114104.189299079454
67101.06618322475797.8140362391653104.318330210349
68100.49480298997297.0576152153445103.931990764599
69100.3365029751596.723739548049103.949266402251
70100.91720315418697.1370101217663104.697396186605
71100.8761667490396.9356516628385104.816681835222
72100.88739510489596.7928305460366104.981959663754


Parameters (Session):
par1 = 12 ; par2 = Triple ; par3 = additive ;
Parameters (R input):
par1 = 12 ; par2 = Triple ; par3 = additive ;
R code (references can be found in the software module):
par1 <- as.numeric(par1)
if (par2 == 'Single') K <- 1
if (par2 == 'Double') K <- 2
if (par2 == 'Triple') K <- par1
nx <- length(x)
nxmK <- nx - K
x <- ts(x, frequency = par1)
if (par2 == 'Single') fit <- HoltWinters(x, gamma=F, beta=F)
if (par2 == 'Double') fit <- HoltWinters(x, gamma=F)
if (par2 == 'Triple') fit <- HoltWinters(x, seasonal=par3)
fit
myresid <- x - fit$fitted[,'xhat']
bitmap(file='test1.png')
op <- par(mfrow=c(2,1))
plot(fit,ylab='Observed (black) / Fitted (red)',main='Interpolation Fit of Exponential Smoothing')
plot(myresid,ylab='Residuals',main='Interpolation Prediction Errors')
par(op)
dev.off()
bitmap(file='test2.png')
p <- predict(fit, par1, prediction.interval=TRUE)
np <- length(p[,1])
plot(fit,p,ylab='Observed (black) / Fitted (red)',main='Extrapolation Fit of Exponential Smoothing')
dev.off()
bitmap(file='test3.png')
op <- par(mfrow = c(2,2))
acf(as.numeric(myresid),lag.max = nx/2,main='Residual ACF')
spectrum(myresid,main='Residals Periodogram')
cpgram(myresid,main='Residal Cumulative Periodogram')
qqnorm(myresid,main='Residual Normal QQ Plot')
qqline(myresid)
par(op)
dev.off()
load(file='createtable')
a<-table.start()
a<-table.row.start(a)
a<-table.element(a,'Estimated Parameters of Exponential Smoothing',2,TRUE)
a<-table.row.end(a)
a<-table.row.start(a)
a<-table.element(a,'Parameter',header=TRUE)
a<-table.element(a,'Value',header=TRUE)
a<-table.row.end(a)
a<-table.row.start(a)
a<-table.element(a,'alpha',header=TRUE)
a<-table.element(a,fit$alpha)
a<-table.row.end(a)
a<-table.row.start(a)
a<-table.element(a,'beta',header=TRUE)
a<-table.element(a,fit$beta)
a<-table.row.end(a)
a<-table.row.start(a)
a<-table.element(a,'gamma',header=TRUE)
a<-table.element(a,fit$gamma)
a<-table.row.end(a)
a<-table.end(a)
table.save(a,file='mytable.tab')
a<-table.start()
a<-table.row.start(a)
a<-table.element(a,'Interpolation Forecasts of Exponential Smoothing',4,TRUE)
a<-table.row.end(a)
a<-table.row.start(a)
a<-table.element(a,'t',header=TRUE)
a<-table.element(a,'Observed',header=TRUE)
a<-table.element(a,'Fitted',header=TRUE)
a<-table.element(a,'Residuals',header=TRUE)
a<-table.row.end(a)
for (i in 1:nxmK) {
a<-table.row.start(a)
a<-table.element(a,i+K,header=TRUE)
a<-table.element(a,x[i+K])
a<-table.element(a,fit$fitted[i,'xhat'])
a<-table.element(a,myresid[i])
a<-table.row.end(a)
}
a<-table.end(a)
table.save(a,file='mytable1.tab')
a<-table.start()
a<-table.row.start(a)
a<-table.element(a,'Extrapolation Forecasts of Exponential Smoothing',4,TRUE)
a<-table.row.end(a)
a<-table.row.start(a)
a<-table.element(a,'t',header=TRUE)
a<-table.element(a,'Forecast',header=TRUE)
a<-table.element(a,'95% Lower Bound',header=TRUE)
a<-table.element(a,'95% Upper Bound',header=TRUE)
a<-table.row.end(a)
for (i in 1:np) {
a<-table.row.start(a)
a<-table.element(a,nx+i,header=TRUE)
a<-table.element(a,p[i,'fit'])
a<-table.element(a,p[i,'lwr'])
a<-table.element(a,p[i,'upr'])
a<-table.row.end(a)
}
a<-table.end(a)
table.save(a,file='mytable2.tab')