Free Statistics

of Irreproducible Research!

Author's title

Author*Unverified author*
R Software Modulerwasp_exponentialsmoothing.wasp
Title produced by softwareExponential Smoothing
Date of computationTue, 02 May 2017 16:26:40 +0100
Cite this page as followsStatistical Computations at FreeStatistics.org, Office for Research Development and Education, URL https://freestatistics.org/blog/index.php?v=date/2017/May/02/t149373887034cmvx9okmnojzb.htm/, Retrieved Fri, 17 May 2024 04:30:58 +0200
Statistical Computations at FreeStatistics.org, Office for Research Development and Education, URL https://freestatistics.org/blog/index.php?pk=, Retrieved Fri, 17 May 2024 04:30:58 +0200
QR Codes:

Original text written by user:
IsPrivate?No (this computation is public)
User-defined keywords
Estimated Impact0
Dataseries X:
511
514
513
511
498
490
495
486
530
539
555
548
615
634
645
634
630
635
642
637
675
679
676
660
716
730
717
694
670
641
626
604
630
634
635
619
674
664
653
635
614
595
580
570
608
617
591
565
603
612
599
587
557
528
517
484
514
510
495
458


Summary of computational transaction
Raw Inputview raw input (R code)
Raw Outputview raw output of R engine
Computing time3 seconds
R Server'Sir Maurice George Kendall' @ kendall.wessa.net

\begin{tabular}{lllllllll}
\hline
Summary of computational transaction \tabularnewline
Raw Input & view raw input (R code)  \tabularnewline
Raw Output & view raw output of R engine  \tabularnewline
Computing time & 3 seconds \tabularnewline
R Server & 'Sir Maurice George Kendall' @ kendall.wessa.net \tabularnewline
\hline
\end{tabular}
%Source: https://freestatistics.org/blog/index.php?pk=&T=0

[TABLE]
[ROW][C]Summary of computational transaction[/C][/ROW]
[ROW][C]Raw Input[/C][C]view raw input (R code) [/C][/ROW]
[ROW][C]Raw Output[/C][C]view raw output of R engine [/C][/ROW]
[ROW][C]Computing time[/C][C]3 seconds[/C][/ROW]
[ROW][C]R Server[/C][C]'Sir Maurice George Kendall' @ kendall.wessa.net[/C][/ROW]
[/TABLE]
Source: https://freestatistics.org/blog/index.php?pk=&T=0

Globally Unique Identifier (entire table): ba.freestatistics.org/blog/index.php?pk=&T=0

As an alternative you can also use a QR Code:  

The GUIDs for individual cells are displayed in the table below:

Summary of computational transaction
Raw Inputview raw input (R code)
Raw Outputview raw output of R engine
Computing time3 seconds
R Server'Sir Maurice George Kendall' @ kendall.wessa.net


Estimated Parameters of Exponential Smoothing
ParameterValue
alpha0.928810750498607
beta0.206540471421284
gamma1

\begin{tabular}{lllllllll}
\hline
Estimated Parameters of Exponential Smoothing \tabularnewline
Parameter & Value \tabularnewline
alpha & 0.928810750498607 \tabularnewline
beta & 0.206540471421284 \tabularnewline
gamma & 1 \tabularnewline
\hline
\end{tabular}
%Source: https://freestatistics.org/blog/index.php?pk=&T=1

[TABLE]
[ROW][C]Estimated Parameters of Exponential Smoothing[/C][/ROW]
[ROW][C]Parameter[/C][C]Value[/C][/ROW]
[ROW][C]alpha[/C][C]0.928810750498607[/C][/ROW]
[ROW][C]beta[/C][C]0.206540471421284[/C][/ROW]
[ROW][C]gamma[/C][C]1[/C][/ROW]
[/TABLE]
Source: https://freestatistics.org/blog/index.php?pk=&T=1

Globally Unique Identifier (entire table): ba.freestatistics.org/blog/index.php?pk=&T=1

As an alternative you can also use a QR Code:  

The GUIDs for individual cells are displayed in the table below:

Estimated Parameters of Exponential Smoothing
ParameterValue
alpha0.928810750498607
beta0.206540471421284
gamma1


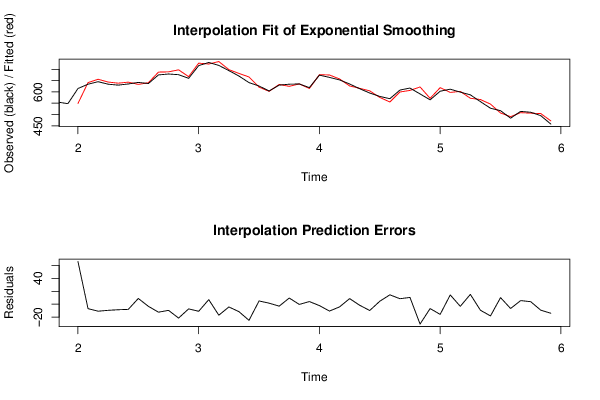
Interpolation Forecasts of Exponential Smoothing
tObservedFittedResiduals
13615549.02991452991565.9700854700855
14634640.925926306406-6.92592630640593
15645655.870023013787-10.870023013787
16634643.523860915158-9.52386091515814
17630638.600999641467-8.60099964146661
18635643.05197845012-8.05197845012026
19642633.1765599042598.82344009574103
20637640.334540557879-3.33454055787934
21675687.393703118152-12.3937031181515
22679688.536047149579-9.53604714957919
23676697.503245990882-21.5032459908823
24660667.313396806389-7.31339680638939
25716726.971612788316-10.971612788316
26730722.9915037992717.00849620072904
27717734.047970710805-17.0479707108049
28694698.325043690977-4.32504369097683
29670681.559470145973-11.5594701459733
30641665.997002614549-24.9970026145494
31626621.0288575269364.97114247306376
32604602.4488976460361.55110235396444
33630633.043862441325-3.04386244132479
34634624.5103984336869.48960156631426
35635635.383237042574-0.383237042573683
36619614.9579919165794.04200808342114
37674676.219139293315-2.21913929331549
38664674.643795499662-10.6437954996622
39653657.201082674544-4.2010826745443
40635626.3897479820848.61025201791574
41614615.67860020105-1.67860020105024
42595604.787497034829-9.7874970348289
43580575.4477740629184.55222593708174
44570555.52314628043114.4768537195691
45608599.5641096745028.43589032549812
46617606.55518666292510.4448133370751
47591621.765416549574-30.7654165495743
48565571.760500158286-6.76050015828582
49603618.794708285519-15.7947082855186
50612597.65846146747914.3415385325213
51599602.322135520679-3.32213552067867
52587571.84890842355315.1510915764474
53557566.344984907465-9.34498490746535
54528546.14977644033-18.1497764403299
55517506.85349940590210.1465005940981
56484490.694196625892-6.69419662589235
57514508.4425939633155.55740603668528
58510506.1523024544273.84769754557283
59495504.284948898173-9.28494889817341
60458472.04457642685-14.0445764268497

\begin{tabular}{lllllllll}
\hline
Interpolation Forecasts of Exponential Smoothing \tabularnewline
t & Observed & Fitted & Residuals \tabularnewline
13 & 615 & 549.029914529915 & 65.9700854700855 \tabularnewline
14 & 634 & 640.925926306406 & -6.92592630640593 \tabularnewline
15 & 645 & 655.870023013787 & -10.870023013787 \tabularnewline
16 & 634 & 643.523860915158 & -9.52386091515814 \tabularnewline
17 & 630 & 638.600999641467 & -8.60099964146661 \tabularnewline
18 & 635 & 643.05197845012 & -8.05197845012026 \tabularnewline
19 & 642 & 633.176559904259 & 8.82344009574103 \tabularnewline
20 & 637 & 640.334540557879 & -3.33454055787934 \tabularnewline
21 & 675 & 687.393703118152 & -12.3937031181515 \tabularnewline
22 & 679 & 688.536047149579 & -9.53604714957919 \tabularnewline
23 & 676 & 697.503245990882 & -21.5032459908823 \tabularnewline
24 & 660 & 667.313396806389 & -7.31339680638939 \tabularnewline
25 & 716 & 726.971612788316 & -10.971612788316 \tabularnewline
26 & 730 & 722.991503799271 & 7.00849620072904 \tabularnewline
27 & 717 & 734.047970710805 & -17.0479707108049 \tabularnewline
28 & 694 & 698.325043690977 & -4.32504369097683 \tabularnewline
29 & 670 & 681.559470145973 & -11.5594701459733 \tabularnewline
30 & 641 & 665.997002614549 & -24.9970026145494 \tabularnewline
31 & 626 & 621.028857526936 & 4.97114247306376 \tabularnewline
32 & 604 & 602.448897646036 & 1.55110235396444 \tabularnewline
33 & 630 & 633.043862441325 & -3.04386244132479 \tabularnewline
34 & 634 & 624.510398433686 & 9.48960156631426 \tabularnewline
35 & 635 & 635.383237042574 & -0.383237042573683 \tabularnewline
36 & 619 & 614.957991916579 & 4.04200808342114 \tabularnewline
37 & 674 & 676.219139293315 & -2.21913929331549 \tabularnewline
38 & 664 & 674.643795499662 & -10.6437954996622 \tabularnewline
39 & 653 & 657.201082674544 & -4.2010826745443 \tabularnewline
40 & 635 & 626.389747982084 & 8.61025201791574 \tabularnewline
41 & 614 & 615.67860020105 & -1.67860020105024 \tabularnewline
42 & 595 & 604.787497034829 & -9.7874970348289 \tabularnewline
43 & 580 & 575.447774062918 & 4.55222593708174 \tabularnewline
44 & 570 & 555.523146280431 & 14.4768537195691 \tabularnewline
45 & 608 & 599.564109674502 & 8.43589032549812 \tabularnewline
46 & 617 & 606.555186662925 & 10.4448133370751 \tabularnewline
47 & 591 & 621.765416549574 & -30.7654165495743 \tabularnewline
48 & 565 & 571.760500158286 & -6.76050015828582 \tabularnewline
49 & 603 & 618.794708285519 & -15.7947082855186 \tabularnewline
50 & 612 & 597.658461467479 & 14.3415385325213 \tabularnewline
51 & 599 & 602.322135520679 & -3.32213552067867 \tabularnewline
52 & 587 & 571.848908423553 & 15.1510915764474 \tabularnewline
53 & 557 & 566.344984907465 & -9.34498490746535 \tabularnewline
54 & 528 & 546.14977644033 & -18.1497764403299 \tabularnewline
55 & 517 & 506.853499405902 & 10.1465005940981 \tabularnewline
56 & 484 & 490.694196625892 & -6.69419662589235 \tabularnewline
57 & 514 & 508.442593963315 & 5.55740603668528 \tabularnewline
58 & 510 & 506.152302454427 & 3.84769754557283 \tabularnewline
59 & 495 & 504.284948898173 & -9.28494889817341 \tabularnewline
60 & 458 & 472.04457642685 & -14.0445764268497 \tabularnewline
\hline
\end{tabular}
%Source: https://freestatistics.org/blog/index.php?pk=&T=2

[TABLE]
[ROW][C]Interpolation Forecasts of Exponential Smoothing[/C][/ROW]
[ROW][C]t[/C][C]Observed[/C][C]Fitted[/C][C]Residuals[/C][/ROW]
[ROW][C]13[/C][C]615[/C][C]549.029914529915[/C][C]65.9700854700855[/C][/ROW]
[ROW][C]14[/C][C]634[/C][C]640.925926306406[/C][C]-6.92592630640593[/C][/ROW]
[ROW][C]15[/C][C]645[/C][C]655.870023013787[/C][C]-10.870023013787[/C][/ROW]
[ROW][C]16[/C][C]634[/C][C]643.523860915158[/C][C]-9.52386091515814[/C][/ROW]
[ROW][C]17[/C][C]630[/C][C]638.600999641467[/C][C]-8.60099964146661[/C][/ROW]
[ROW][C]18[/C][C]635[/C][C]643.05197845012[/C][C]-8.05197845012026[/C][/ROW]
[ROW][C]19[/C][C]642[/C][C]633.176559904259[/C][C]8.82344009574103[/C][/ROW]
[ROW][C]20[/C][C]637[/C][C]640.334540557879[/C][C]-3.33454055787934[/C][/ROW]
[ROW][C]21[/C][C]675[/C][C]687.393703118152[/C][C]-12.3937031181515[/C][/ROW]
[ROW][C]22[/C][C]679[/C][C]688.536047149579[/C][C]-9.53604714957919[/C][/ROW]
[ROW][C]23[/C][C]676[/C][C]697.503245990882[/C][C]-21.5032459908823[/C][/ROW]
[ROW][C]24[/C][C]660[/C][C]667.313396806389[/C][C]-7.31339680638939[/C][/ROW]
[ROW][C]25[/C][C]716[/C][C]726.971612788316[/C][C]-10.971612788316[/C][/ROW]
[ROW][C]26[/C][C]730[/C][C]722.991503799271[/C][C]7.00849620072904[/C][/ROW]
[ROW][C]27[/C][C]717[/C][C]734.047970710805[/C][C]-17.0479707108049[/C][/ROW]
[ROW][C]28[/C][C]694[/C][C]698.325043690977[/C][C]-4.32504369097683[/C][/ROW]
[ROW][C]29[/C][C]670[/C][C]681.559470145973[/C][C]-11.5594701459733[/C][/ROW]
[ROW][C]30[/C][C]641[/C][C]665.997002614549[/C][C]-24.9970026145494[/C][/ROW]
[ROW][C]31[/C][C]626[/C][C]621.028857526936[/C][C]4.97114247306376[/C][/ROW]
[ROW][C]32[/C][C]604[/C][C]602.448897646036[/C][C]1.55110235396444[/C][/ROW]
[ROW][C]33[/C][C]630[/C][C]633.043862441325[/C][C]-3.04386244132479[/C][/ROW]
[ROW][C]34[/C][C]634[/C][C]624.510398433686[/C][C]9.48960156631426[/C][/ROW]
[ROW][C]35[/C][C]635[/C][C]635.383237042574[/C][C]-0.383237042573683[/C][/ROW]
[ROW][C]36[/C][C]619[/C][C]614.957991916579[/C][C]4.04200808342114[/C][/ROW]
[ROW][C]37[/C][C]674[/C][C]676.219139293315[/C][C]-2.21913929331549[/C][/ROW]
[ROW][C]38[/C][C]664[/C][C]674.643795499662[/C][C]-10.6437954996622[/C][/ROW]
[ROW][C]39[/C][C]653[/C][C]657.201082674544[/C][C]-4.2010826745443[/C][/ROW]
[ROW][C]40[/C][C]635[/C][C]626.389747982084[/C][C]8.61025201791574[/C][/ROW]
[ROW][C]41[/C][C]614[/C][C]615.67860020105[/C][C]-1.67860020105024[/C][/ROW]
[ROW][C]42[/C][C]595[/C][C]604.787497034829[/C][C]-9.7874970348289[/C][/ROW]
[ROW][C]43[/C][C]580[/C][C]575.447774062918[/C][C]4.55222593708174[/C][/ROW]
[ROW][C]44[/C][C]570[/C][C]555.523146280431[/C][C]14.4768537195691[/C][/ROW]
[ROW][C]45[/C][C]608[/C][C]599.564109674502[/C][C]8.43589032549812[/C][/ROW]
[ROW][C]46[/C][C]617[/C][C]606.555186662925[/C][C]10.4448133370751[/C][/ROW]
[ROW][C]47[/C][C]591[/C][C]621.765416549574[/C][C]-30.7654165495743[/C][/ROW]
[ROW][C]48[/C][C]565[/C][C]571.760500158286[/C][C]-6.76050015828582[/C][/ROW]
[ROW][C]49[/C][C]603[/C][C]618.794708285519[/C][C]-15.7947082855186[/C][/ROW]
[ROW][C]50[/C][C]612[/C][C]597.658461467479[/C][C]14.3415385325213[/C][/ROW]
[ROW][C]51[/C][C]599[/C][C]602.322135520679[/C][C]-3.32213552067867[/C][/ROW]
[ROW][C]52[/C][C]587[/C][C]571.848908423553[/C][C]15.1510915764474[/C][/ROW]
[ROW][C]53[/C][C]557[/C][C]566.344984907465[/C][C]-9.34498490746535[/C][/ROW]
[ROW][C]54[/C][C]528[/C][C]546.14977644033[/C][C]-18.1497764403299[/C][/ROW]
[ROW][C]55[/C][C]517[/C][C]506.853499405902[/C][C]10.1465005940981[/C][/ROW]
[ROW][C]56[/C][C]484[/C][C]490.694196625892[/C][C]-6.69419662589235[/C][/ROW]
[ROW][C]57[/C][C]514[/C][C]508.442593963315[/C][C]5.55740603668528[/C][/ROW]
[ROW][C]58[/C][C]510[/C][C]506.152302454427[/C][C]3.84769754557283[/C][/ROW]
[ROW][C]59[/C][C]495[/C][C]504.284948898173[/C][C]-9.28494889817341[/C][/ROW]
[ROW][C]60[/C][C]458[/C][C]472.04457642685[/C][C]-14.0445764268497[/C][/ROW]
[/TABLE]
Source: https://freestatistics.org/blog/index.php?pk=&T=2

Globally Unique Identifier (entire table): ba.freestatistics.org/blog/index.php?pk=&T=2

As an alternative you can also use a QR Code:  

The GUIDs for individual cells are displayed in the table below:

Interpolation Forecasts of Exponential Smoothing
tObservedFittedResiduals
13615549.02991452991565.9700854700855
14634640.925926306406-6.92592630640593
15645655.870023013787-10.870023013787
16634643.523860915158-9.52386091515814
17630638.600999641467-8.60099964146661
18635643.05197845012-8.05197845012026
19642633.1765599042598.82344009574103
20637640.334540557879-3.33454055787934
21675687.393703118152-12.3937031181515
22679688.536047149579-9.53604714957919
23676697.503245990882-21.5032459908823
24660667.313396806389-7.31339680638939
25716726.971612788316-10.971612788316
26730722.9915037992717.00849620072904
27717734.047970710805-17.0479707108049
28694698.325043690977-4.32504369097683
29670681.559470145973-11.5594701459733
30641665.997002614549-24.9970026145494
31626621.0288575269364.97114247306376
32604602.4488976460361.55110235396444
33630633.043862441325-3.04386244132479
34634624.5103984336869.48960156631426
35635635.383237042574-0.383237042573683
36619614.9579919165794.04200808342114
37674676.219139293315-2.21913929331549
38664674.643795499662-10.6437954996622
39653657.201082674544-4.2010826745443
40635626.3897479820848.61025201791574
41614615.67860020105-1.67860020105024
42595604.787497034829-9.7874970348289
43580575.4477740629184.55222593708174
44570555.52314628043114.4768537195691
45608599.5641096745028.43589032549812
46617606.55518666292510.4448133370751
47591621.765416549574-30.7654165495743
48565571.760500158286-6.76050015828582
49603618.794708285519-15.7947082855186
50612597.65846146747914.3415385325213
51599602.322135520679-3.32213552067867
52587571.84890842355315.1510915764474
53557566.344984907465-9.34498490746535
54528546.14977644033-18.1497764403299
55517506.85349940590210.1465005940981
56484490.694196625892-6.69419662589235
57514508.4425939633155.55740603668528
58510506.1523024544273.84769754557283
59495504.284948898173-9.28494889817341
60458472.04457642685-14.0445764268497


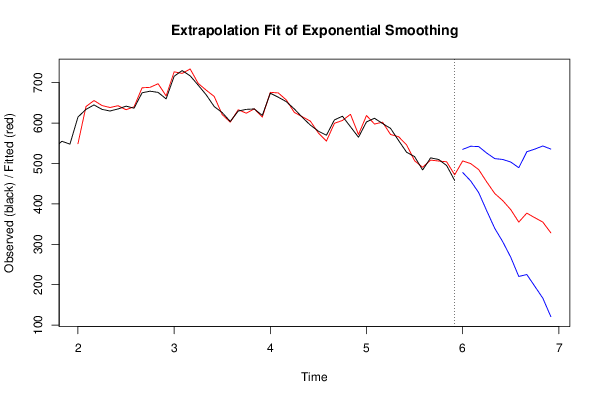
Extrapolation Forecasts of Exponential Smoothing
tForecast95% Lower Bound95% Upper Bound
61506.377124955404477.788913975905534.965335934904
62499.793566646709456.855525995379542.731607298038
63484.86498081719427.842659163265541.887302471114
64454.415571609454382.993937007357525.83720621155
65425.811841474673339.484881091416512.138801857929
66408.178810337174306.367306307048509.990314367299
67385.745691740377267.84353201644503.647851464314
68355.007919428734220.402906818385489.612932039082
69377.174921520116225.25880191325529.091041126982
70365.863803079333196.037221579153535.690384579513
71355.012297044436166.687192054519543.337402034352
72328.36278106367120.963422001433535.762140125906

\begin{tabular}{lllllllll}
\hline
Extrapolation Forecasts of Exponential Smoothing \tabularnewline
t & Forecast & 95% Lower Bound & 95% Upper Bound \tabularnewline
61 & 506.377124955404 & 477.788913975905 & 534.965335934904 \tabularnewline
62 & 499.793566646709 & 456.855525995379 & 542.731607298038 \tabularnewline
63 & 484.86498081719 & 427.842659163265 & 541.887302471114 \tabularnewline
64 & 454.415571609454 & 382.993937007357 & 525.83720621155 \tabularnewline
65 & 425.811841474673 & 339.484881091416 & 512.138801857929 \tabularnewline
66 & 408.178810337174 & 306.367306307048 & 509.990314367299 \tabularnewline
67 & 385.745691740377 & 267.84353201644 & 503.647851464314 \tabularnewline
68 & 355.007919428734 & 220.402906818385 & 489.612932039082 \tabularnewline
69 & 377.174921520116 & 225.25880191325 & 529.091041126982 \tabularnewline
70 & 365.863803079333 & 196.037221579153 & 535.690384579513 \tabularnewline
71 & 355.012297044436 & 166.687192054519 & 543.337402034352 \tabularnewline
72 & 328.36278106367 & 120.963422001433 & 535.762140125906 \tabularnewline
\hline
\end{tabular}
%Source: https://freestatistics.org/blog/index.php?pk=&T=3

[TABLE]
[ROW][C]Extrapolation Forecasts of Exponential Smoothing[/C][/ROW]
[ROW][C]t[/C][C]Forecast[/C][C]95% Lower Bound[/C][C]95% Upper Bound[/C][/ROW]
[ROW][C]61[/C][C]506.377124955404[/C][C]477.788913975905[/C][C]534.965335934904[/C][/ROW]
[ROW][C]62[/C][C]499.793566646709[/C][C]456.855525995379[/C][C]542.731607298038[/C][/ROW]
[ROW][C]63[/C][C]484.86498081719[/C][C]427.842659163265[/C][C]541.887302471114[/C][/ROW]
[ROW][C]64[/C][C]454.415571609454[/C][C]382.993937007357[/C][C]525.83720621155[/C][/ROW]
[ROW][C]65[/C][C]425.811841474673[/C][C]339.484881091416[/C][C]512.138801857929[/C][/ROW]
[ROW][C]66[/C][C]408.178810337174[/C][C]306.367306307048[/C][C]509.990314367299[/C][/ROW]
[ROW][C]67[/C][C]385.745691740377[/C][C]267.84353201644[/C][C]503.647851464314[/C][/ROW]
[ROW][C]68[/C][C]355.007919428734[/C][C]220.402906818385[/C][C]489.612932039082[/C][/ROW]
[ROW][C]69[/C][C]377.174921520116[/C][C]225.25880191325[/C][C]529.091041126982[/C][/ROW]
[ROW][C]70[/C][C]365.863803079333[/C][C]196.037221579153[/C][C]535.690384579513[/C][/ROW]
[ROW][C]71[/C][C]355.012297044436[/C][C]166.687192054519[/C][C]543.337402034352[/C][/ROW]
[ROW][C]72[/C][C]328.36278106367[/C][C]120.963422001433[/C][C]535.762140125906[/C][/ROW]
[/TABLE]
Source: https://freestatistics.org/blog/index.php?pk=&T=3

Globally Unique Identifier (entire table): ba.freestatistics.org/blog/index.php?pk=&T=3

As an alternative you can also use a QR Code:  

The GUIDs for individual cells are displayed in the table below:

Extrapolation Forecasts of Exponential Smoothing
tForecast95% Lower Bound95% Upper Bound
61506.377124955404477.788913975905534.965335934904
62499.793566646709456.855525995379542.731607298038
63484.86498081719427.842659163265541.887302471114
64454.415571609454382.993937007357525.83720621155
65425.811841474673339.484881091416512.138801857929
66408.178810337174306.367306307048509.990314367299
67385.745691740377267.84353201644503.647851464314
68355.007919428734220.402906818385489.612932039082
69377.174921520116225.25880191325529.091041126982
70365.863803079333196.037221579153535.690384579513
71355.012297044436166.687192054519543.337402034352
72328.36278106367120.963422001433535.762140125906


Parameters (Session):
par1 = 12 ; par2 = Triple ; par3 = additive ;
Parameters (R input):
par1 = 12 ; par2 = Triple ; par3 = additive ;
R code (references can be found in the software module):
par1 <- as.numeric(par1)
if (par2 == 'Single') K <- 1
if (par2 == 'Double') K <- 2
if (par2 == 'Triple') K <- par1
nx <- length(x)
nxmK <- nx - K
x <- ts(x, frequency = par1)
if (par2 == 'Single') fit <- HoltWinters(x, gamma=F, beta=F)
if (par2 == 'Double') fit <- HoltWinters(x, gamma=F)
if (par2 == 'Triple') fit <- HoltWinters(x, seasonal=par3)
fit
myresid <- x - fit$fitted[,'xhat']
bitmap(file='test1.png')
op <- par(mfrow=c(2,1))
plot(fit,ylab='Observed (black) / Fitted (red)',main='Interpolation Fit of Exponential Smoothing')
plot(myresid,ylab='Residuals',main='Interpolation Prediction Errors')
par(op)
dev.off()
bitmap(file='test2.png')
p <- predict(fit, par1, prediction.interval=TRUE)
np <- length(p[,1])
plot(fit,p,ylab='Observed (black) / Fitted (red)',main='Extrapolation Fit of Exponential Smoothing')
dev.off()
bitmap(file='test3.png')
op <- par(mfrow = c(2,2))
acf(as.numeric(myresid),lag.max = nx/2,main='Residual ACF')
spectrum(myresid,main='Residals Periodogram')
cpgram(myresid,main='Residal Cumulative Periodogram')
qqnorm(myresid,main='Residual Normal QQ Plot')
qqline(myresid)
par(op)
dev.off()
load(file='createtable')
a<-table.start()
a<-table.row.start(a)
a<-table.element(a,'Estimated Parameters of Exponential Smoothing',2,TRUE)
a<-table.row.end(a)
a<-table.row.start(a)
a<-table.element(a,'Parameter',header=TRUE)
a<-table.element(a,'Value',header=TRUE)
a<-table.row.end(a)
a<-table.row.start(a)
a<-table.element(a,'alpha',header=TRUE)
a<-table.element(a,fit$alpha)
a<-table.row.end(a)
a<-table.row.start(a)
a<-table.element(a,'beta',header=TRUE)
a<-table.element(a,fit$beta)
a<-table.row.end(a)
a<-table.row.start(a)
a<-table.element(a,'gamma',header=TRUE)
a<-table.element(a,fit$gamma)
a<-table.row.end(a)
a<-table.end(a)
table.save(a,file='mytable.tab')
a<-table.start()
a<-table.row.start(a)
a<-table.element(a,'Interpolation Forecasts of Exponential Smoothing',4,TRUE)
a<-table.row.end(a)
a<-table.row.start(a)
a<-table.element(a,'t',header=TRUE)
a<-table.element(a,'Observed',header=TRUE)
a<-table.element(a,'Fitted',header=TRUE)
a<-table.element(a,'Residuals',header=TRUE)
a<-table.row.end(a)
for (i in 1:nxmK) {
a<-table.row.start(a)
a<-table.element(a,i+K,header=TRUE)
a<-table.element(a,x[i+K])
a<-table.element(a,fit$fitted[i,'xhat'])
a<-table.element(a,myresid[i])
a<-table.row.end(a)
}
a<-table.end(a)
table.save(a,file='mytable1.tab')
a<-table.start()
a<-table.row.start(a)
a<-table.element(a,'Extrapolation Forecasts of Exponential Smoothing',4,TRUE)
a<-table.row.end(a)
a<-table.row.start(a)
a<-table.element(a,'t',header=TRUE)
a<-table.element(a,'Forecast',header=TRUE)
a<-table.element(a,'95% Lower Bound',header=TRUE)
a<-table.element(a,'95% Upper Bound',header=TRUE)
a<-table.row.end(a)
for (i in 1:np) {
a<-table.row.start(a)
a<-table.element(a,nx+i,header=TRUE)
a<-table.element(a,p[i,'fit'])
a<-table.element(a,p[i,'lwr'])
a<-table.element(a,p[i,'upr'])
a<-table.row.end(a)
}
a<-table.end(a)
table.save(a,file='mytable2.tab')