Free Statistics

of Irreproducible Research!

Author's title

Author*Unverified author*
R Software Modulerwasp_exponentialsmoothing.wasp
Title produced by softwareExponential Smoothing
Date of computationTue, 02 May 2017 12:06:14 +0100
Cite this page as followsStatistical Computations at FreeStatistics.org, Office for Research Development and Education, URL https://freestatistics.org/blog/index.php?v=date/2017/May/02/t1493723207elnsl1fl8j6airf.htm/, Retrieved Fri, 17 May 2024 07:34:14 +0200
Statistical Computations at FreeStatistics.org, Office for Research Development and Education, URL https://freestatistics.org/blog/index.php?pk=, Retrieved Fri, 17 May 2024 07:34:14 +0200
QR Codes:

Original text written by user:
IsPrivate?No (this computation is public)
User-defined keywords
Estimated Impact0
Dataseries X:
8899
8899
9093
9093
9093
9116
9116
9116
10073
10073
10073
9223
9223
9223
9151
9151
9151
6727
6727
6727
7232
7232
7232
6370
6370
6370
6862
6862
6862
7029
7029
7029
7031
7031
7031
7223
7223
7223
8065
8065
8065
7657
7657
7657
7328
7328
7328
7115
7115
7115
7926
7926
7926
8681
8681
8681
8670
8670
8670
8028
8028


Summary of computational transaction
Raw Inputview raw input (R code)
Raw Outputview raw output of R engine
Computing time3 seconds
R Server'Sir Ronald Aylmer Fisher' @ fisher.wessa.net

\begin{tabular}{lllllllll}
\hline
Summary of computational transaction \tabularnewline
Raw Input & view raw input (R code)  \tabularnewline
Raw Output & view raw output of R engine  \tabularnewline
Computing time & 3 seconds \tabularnewline
R Server & 'Sir Ronald Aylmer Fisher' @ fisher.wessa.net \tabularnewline
\hline
\end{tabular}
%Source: https://freestatistics.org/blog/index.php?pk=&T=0

[TABLE]
[ROW][C]Summary of computational transaction[/C][/ROW]
[ROW][C]Raw Input[/C][C]view raw input (R code) [/C][/ROW]
[ROW][C]Raw Output[/C][C]view raw output of R engine [/C][/ROW]
[ROW][C]Computing time[/C][C]3 seconds[/C][/ROW]
[ROW][C]R Server[/C][C]'Sir Ronald Aylmer Fisher' @ fisher.wessa.net[/C][/ROW]
[/TABLE]
Source: https://freestatistics.org/blog/index.php?pk=&T=0

Globally Unique Identifier (entire table): ba.freestatistics.org/blog/index.php?pk=&T=0

As an alternative you can also use a QR Code:  

The GUIDs for individual cells are displayed in the table below:

Summary of computational transaction
Raw Inputview raw input (R code)
Raw Outputview raw output of R engine
Computing time3 seconds
R Server'Sir Ronald Aylmer Fisher' @ fisher.wessa.net


Estimated Parameters of Exponential Smoothing
ParameterValue
alpha0.671445599297064
beta0.0247891461575152
gamma1

\begin{tabular}{lllllllll}
\hline
Estimated Parameters of Exponential Smoothing \tabularnewline
Parameter & Value \tabularnewline
alpha & 0.671445599297064 \tabularnewline
beta & 0.0247891461575152 \tabularnewline
gamma & 1 \tabularnewline
\hline
\end{tabular}
%Source: https://freestatistics.org/blog/index.php?pk=&T=1

[TABLE]
[ROW][C]Estimated Parameters of Exponential Smoothing[/C][/ROW]
[ROW][C]Parameter[/C][C]Value[/C][/ROW]
[ROW][C]alpha[/C][C]0.671445599297064[/C][/ROW]
[ROW][C]beta[/C][C]0.0247891461575152[/C][/ROW]
[ROW][C]gamma[/C][C]1[/C][/ROW]
[/TABLE]
Source: https://freestatistics.org/blog/index.php?pk=&T=1

Globally Unique Identifier (entire table): ba.freestatistics.org/blog/index.php?pk=&T=1

As an alternative you can also use a QR Code:  

The GUIDs for individual cells are displayed in the table below:

Estimated Parameters of Exponential Smoothing
ParameterValue
alpha0.671445599297064
beta0.0247891461575152
gamma1


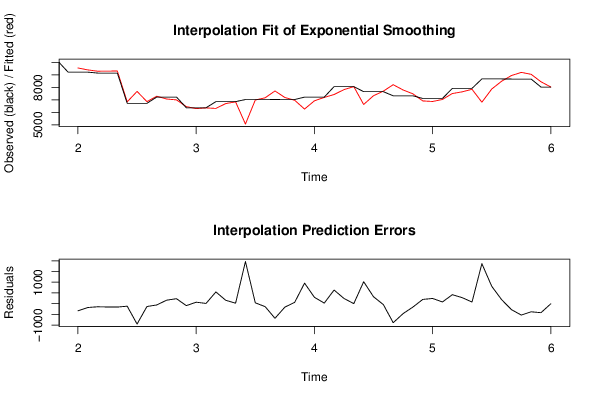
Interpolation Forecasts of Exponential Smoothing
tObservedFittedResiduals
1392239557.33262050093-334.332620500925
1492239404.12488551028-181.124885510277
1591519298.32544035927-147.325440359273
1691519307.89798113716-156.897981137156
1791519311.57878639134-160.578786391336
1867276846.74763359895-119.747633598953
1967277680.68427281644-953.684272816441
2067276862.91022370363-135.91022370363
2172327294.02518276833-62.0251827683323
2272327071.88180286332160.118197136677
2372327001.68984217469230.310157825313
2463706463.50440983721-93.50440983721
2563706303.3203084715866.6796915284194
2663706361.486803554138.51319644586692
2768626316.91573761577545.084262384232
2868626705.99844935848156.001550641524
2968626842.378052241319.6219477587028
3070295065.358973529611963.64102647039
3170296991.5852149163537.4147850836544
3270297169.62436394705-140.624363947047
3370317716.17076372501-685.170763725007
3470317195.19943470738-164.19943470738
3570316970.1193095714260.8806904285848
3672236266.64234347635956.357656523648
3772236927.63858519215295.361414807852
3872237198.2108955883824.7891044116159
3980657431.31895990931633.681040090692
4080657823.54668983052241.45331016948
4180658063.959487663461.04051233653536
4276576634.002759024061022.99724097594
4376577335.65272227814321.34727772186
4476577702.55697021366-45.5569702136563
4573288218.94364242559-890.943642425587
4673287795.67803932972-467.678039329722
4773287487.58340323571-159.583403235714
4871156918.95059332799196.049406672014
4971156873.50517016485241.49482983515
5071157037.726332945377.2736670547038
5179267508.76623368356417.233766316439
5279267646.77988390845279.220116091551
5379267851.0506848969474.949315103062
5486816814.79576095351866.2042390465
5586817872.17858743044808.821412569559
5686818494.68721727045186.312782729554
5786708950.53573983454-280.53573983454
5886709204.11154657663-534.111546576632
5986709051.38425200104-381.384252001038
6080288451.32761260916-423.327612609155
6180288033.72609457665-5.72609457664566

\begin{tabular}{lllllllll}
\hline
Interpolation Forecasts of Exponential Smoothing \tabularnewline
t & Observed & Fitted & Residuals \tabularnewline
13 & 9223 & 9557.33262050093 & -334.332620500925 \tabularnewline
14 & 9223 & 9404.12488551028 & -181.124885510277 \tabularnewline
15 & 9151 & 9298.32544035927 & -147.325440359273 \tabularnewline
16 & 9151 & 9307.89798113716 & -156.897981137156 \tabularnewline
17 & 9151 & 9311.57878639134 & -160.578786391336 \tabularnewline
18 & 6727 & 6846.74763359895 & -119.747633598953 \tabularnewline
19 & 6727 & 7680.68427281644 & -953.684272816441 \tabularnewline
20 & 6727 & 6862.91022370363 & -135.91022370363 \tabularnewline
21 & 7232 & 7294.02518276833 & -62.0251827683323 \tabularnewline
22 & 7232 & 7071.88180286332 & 160.118197136677 \tabularnewline
23 & 7232 & 7001.68984217469 & 230.310157825313 \tabularnewline
24 & 6370 & 6463.50440983721 & -93.50440983721 \tabularnewline
25 & 6370 & 6303.32030847158 & 66.6796915284194 \tabularnewline
26 & 6370 & 6361.48680355413 & 8.51319644586692 \tabularnewline
27 & 6862 & 6316.91573761577 & 545.084262384232 \tabularnewline
28 & 6862 & 6705.99844935848 & 156.001550641524 \tabularnewline
29 & 6862 & 6842.3780522413 & 19.6219477587028 \tabularnewline
30 & 7029 & 5065.35897352961 & 1963.64102647039 \tabularnewline
31 & 7029 & 6991.58521491635 & 37.4147850836544 \tabularnewline
32 & 7029 & 7169.62436394705 & -140.624363947047 \tabularnewline
33 & 7031 & 7716.17076372501 & -685.170763725007 \tabularnewline
34 & 7031 & 7195.19943470738 & -164.19943470738 \tabularnewline
35 & 7031 & 6970.11930957142 & 60.8806904285848 \tabularnewline
36 & 7223 & 6266.64234347635 & 956.357656523648 \tabularnewline
37 & 7223 & 6927.63858519215 & 295.361414807852 \tabularnewline
38 & 7223 & 7198.21089558838 & 24.7891044116159 \tabularnewline
39 & 8065 & 7431.31895990931 & 633.681040090692 \tabularnewline
40 & 8065 & 7823.54668983052 & 241.45331016948 \tabularnewline
41 & 8065 & 8063.95948766346 & 1.04051233653536 \tabularnewline
42 & 7657 & 6634.00275902406 & 1022.99724097594 \tabularnewline
43 & 7657 & 7335.65272227814 & 321.34727772186 \tabularnewline
44 & 7657 & 7702.55697021366 & -45.5569702136563 \tabularnewline
45 & 7328 & 8218.94364242559 & -890.943642425587 \tabularnewline
46 & 7328 & 7795.67803932972 & -467.678039329722 \tabularnewline
47 & 7328 & 7487.58340323571 & -159.583403235714 \tabularnewline
48 & 7115 & 6918.95059332799 & 196.049406672014 \tabularnewline
49 & 7115 & 6873.50517016485 & 241.49482983515 \tabularnewline
50 & 7115 & 7037.7263329453 & 77.2736670547038 \tabularnewline
51 & 7926 & 7508.76623368356 & 417.233766316439 \tabularnewline
52 & 7926 & 7646.77988390845 & 279.220116091551 \tabularnewline
53 & 7926 & 7851.05068489694 & 74.949315103062 \tabularnewline
54 & 8681 & 6814.7957609535 & 1866.2042390465 \tabularnewline
55 & 8681 & 7872.17858743044 & 808.821412569559 \tabularnewline
56 & 8681 & 8494.68721727045 & 186.312782729554 \tabularnewline
57 & 8670 & 8950.53573983454 & -280.53573983454 \tabularnewline
58 & 8670 & 9204.11154657663 & -534.111546576632 \tabularnewline
59 & 8670 & 9051.38425200104 & -381.384252001038 \tabularnewline
60 & 8028 & 8451.32761260916 & -423.327612609155 \tabularnewline
61 & 8028 & 8033.72609457665 & -5.72609457664566 \tabularnewline
\hline
\end{tabular}
%Source: https://freestatistics.org/blog/index.php?pk=&T=2

[TABLE]
[ROW][C]Interpolation Forecasts of Exponential Smoothing[/C][/ROW]
[ROW][C]t[/C][C]Observed[/C][C]Fitted[/C][C]Residuals[/C][/ROW]
[ROW][C]13[/C][C]9223[/C][C]9557.33262050093[/C][C]-334.332620500925[/C][/ROW]
[ROW][C]14[/C][C]9223[/C][C]9404.12488551028[/C][C]-181.124885510277[/C][/ROW]
[ROW][C]15[/C][C]9151[/C][C]9298.32544035927[/C][C]-147.325440359273[/C][/ROW]
[ROW][C]16[/C][C]9151[/C][C]9307.89798113716[/C][C]-156.897981137156[/C][/ROW]
[ROW][C]17[/C][C]9151[/C][C]9311.57878639134[/C][C]-160.578786391336[/C][/ROW]
[ROW][C]18[/C][C]6727[/C][C]6846.74763359895[/C][C]-119.747633598953[/C][/ROW]
[ROW][C]19[/C][C]6727[/C][C]7680.68427281644[/C][C]-953.684272816441[/C][/ROW]
[ROW][C]20[/C][C]6727[/C][C]6862.91022370363[/C][C]-135.91022370363[/C][/ROW]
[ROW][C]21[/C][C]7232[/C][C]7294.02518276833[/C][C]-62.0251827683323[/C][/ROW]
[ROW][C]22[/C][C]7232[/C][C]7071.88180286332[/C][C]160.118197136677[/C][/ROW]
[ROW][C]23[/C][C]7232[/C][C]7001.68984217469[/C][C]230.310157825313[/C][/ROW]
[ROW][C]24[/C][C]6370[/C][C]6463.50440983721[/C][C]-93.50440983721[/C][/ROW]
[ROW][C]25[/C][C]6370[/C][C]6303.32030847158[/C][C]66.6796915284194[/C][/ROW]
[ROW][C]26[/C][C]6370[/C][C]6361.48680355413[/C][C]8.51319644586692[/C][/ROW]
[ROW][C]27[/C][C]6862[/C][C]6316.91573761577[/C][C]545.084262384232[/C][/ROW]
[ROW][C]28[/C][C]6862[/C][C]6705.99844935848[/C][C]156.001550641524[/C][/ROW]
[ROW][C]29[/C][C]6862[/C][C]6842.3780522413[/C][C]19.6219477587028[/C][/ROW]
[ROW][C]30[/C][C]7029[/C][C]5065.35897352961[/C][C]1963.64102647039[/C][/ROW]
[ROW][C]31[/C][C]7029[/C][C]6991.58521491635[/C][C]37.4147850836544[/C][/ROW]
[ROW][C]32[/C][C]7029[/C][C]7169.62436394705[/C][C]-140.624363947047[/C][/ROW]
[ROW][C]33[/C][C]7031[/C][C]7716.17076372501[/C][C]-685.170763725007[/C][/ROW]
[ROW][C]34[/C][C]7031[/C][C]7195.19943470738[/C][C]-164.19943470738[/C][/ROW]
[ROW][C]35[/C][C]7031[/C][C]6970.11930957142[/C][C]60.8806904285848[/C][/ROW]
[ROW][C]36[/C][C]7223[/C][C]6266.64234347635[/C][C]956.357656523648[/C][/ROW]
[ROW][C]37[/C][C]7223[/C][C]6927.63858519215[/C][C]295.361414807852[/C][/ROW]
[ROW][C]38[/C][C]7223[/C][C]7198.21089558838[/C][C]24.7891044116159[/C][/ROW]
[ROW][C]39[/C][C]8065[/C][C]7431.31895990931[/C][C]633.681040090692[/C][/ROW]
[ROW][C]40[/C][C]8065[/C][C]7823.54668983052[/C][C]241.45331016948[/C][/ROW]
[ROW][C]41[/C][C]8065[/C][C]8063.95948766346[/C][C]1.04051233653536[/C][/ROW]
[ROW][C]42[/C][C]7657[/C][C]6634.00275902406[/C][C]1022.99724097594[/C][/ROW]
[ROW][C]43[/C][C]7657[/C][C]7335.65272227814[/C][C]321.34727772186[/C][/ROW]
[ROW][C]44[/C][C]7657[/C][C]7702.55697021366[/C][C]-45.5569702136563[/C][/ROW]
[ROW][C]45[/C][C]7328[/C][C]8218.94364242559[/C][C]-890.943642425587[/C][/ROW]
[ROW][C]46[/C][C]7328[/C][C]7795.67803932972[/C][C]-467.678039329722[/C][/ROW]
[ROW][C]47[/C][C]7328[/C][C]7487.58340323571[/C][C]-159.583403235714[/C][/ROW]
[ROW][C]48[/C][C]7115[/C][C]6918.95059332799[/C][C]196.049406672014[/C][/ROW]
[ROW][C]49[/C][C]7115[/C][C]6873.50517016485[/C][C]241.49482983515[/C][/ROW]
[ROW][C]50[/C][C]7115[/C][C]7037.7263329453[/C][C]77.2736670547038[/C][/ROW]
[ROW][C]51[/C][C]7926[/C][C]7508.76623368356[/C][C]417.233766316439[/C][/ROW]
[ROW][C]52[/C][C]7926[/C][C]7646.77988390845[/C][C]279.220116091551[/C][/ROW]
[ROW][C]53[/C][C]7926[/C][C]7851.05068489694[/C][C]74.949315103062[/C][/ROW]
[ROW][C]54[/C][C]8681[/C][C]6814.7957609535[/C][C]1866.2042390465[/C][/ROW]
[ROW][C]55[/C][C]8681[/C][C]7872.17858743044[/C][C]808.821412569559[/C][/ROW]
[ROW][C]56[/C][C]8681[/C][C]8494.68721727045[/C][C]186.312782729554[/C][/ROW]
[ROW][C]57[/C][C]8670[/C][C]8950.53573983454[/C][C]-280.53573983454[/C][/ROW]
[ROW][C]58[/C][C]8670[/C][C]9204.11154657663[/C][C]-534.111546576632[/C][/ROW]
[ROW][C]59[/C][C]8670[/C][C]9051.38425200104[/C][C]-381.384252001038[/C][/ROW]
[ROW][C]60[/C][C]8028[/C][C]8451.32761260916[/C][C]-423.327612609155[/C][/ROW]
[ROW][C]61[/C][C]8028[/C][C]8033.72609457665[/C][C]-5.72609457664566[/C][/ROW]
[/TABLE]
Source: https://freestatistics.org/blog/index.php?pk=&T=2

Globally Unique Identifier (entire table): ba.freestatistics.org/blog/index.php?pk=&T=2

As an alternative you can also use a QR Code:  

The GUIDs for individual cells are displayed in the table below:

Interpolation Forecasts of Exponential Smoothing
tObservedFittedResiduals
1392239557.33262050093-334.332620500925
1492239404.12488551028-181.124885510277
1591519298.32544035927-147.325440359273
1691519307.89798113716-156.897981137156
1791519311.57878639134-160.578786391336
1867276846.74763359895-119.747633598953
1967277680.68427281644-953.684272816441
2067276862.91022370363-135.91022370363
2172327294.02518276833-62.0251827683323
2272327071.88180286332160.118197136677
2372327001.68984217469230.310157825313
2463706463.50440983721-93.50440983721
2563706303.3203084715866.6796915284194
2663706361.486803554138.51319644586692
2768626316.91573761577545.084262384232
2868626705.99844935848156.001550641524
2968626842.378052241319.6219477587028
3070295065.358973529611963.64102647039
3170296991.5852149163537.4147850836544
3270297169.62436394705-140.624363947047
3370317716.17076372501-685.170763725007
3470317195.19943470738-164.19943470738
3570316970.1193095714260.8806904285848
3672236266.64234347635956.357656523648
3772236927.63858519215295.361414807852
3872237198.2108955883824.7891044116159
3980657431.31895990931633.681040090692
4080657823.54668983052241.45331016948
4180658063.959487663461.04051233653536
4276576634.002759024061022.99724097594
4376577335.65272227814321.34727772186
4476577702.55697021366-45.5569702136563
4573288218.94364242559-890.943642425587
4673287795.67803932972-467.678039329722
4773287487.58340323571-159.583403235714
4871156918.95059332799196.049406672014
4971156873.50517016485241.49482983515
5071157037.726332945377.2736670547038
5179267508.76623368356417.233766316439
5279267646.77988390845279.220116091551
5379267851.0506848969474.949315103062
5486816814.79576095351866.2042390465
5586817872.17858743044808.821412569559
5686818494.68721727045186.312782729554
5786708950.53573983454-280.53573983454
5886709204.11154657663-534.111546576632
5986709051.38425200104-381.384252001038
6080288451.32761260916-423.327612609155
6180288033.72609457665-5.72609457664566


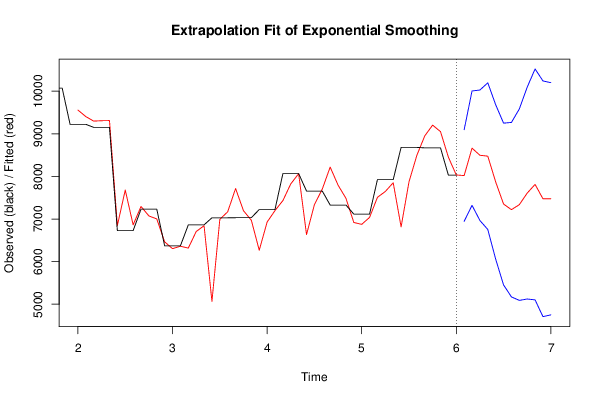
Extrapolation Forecasts of Exponential Smoothing
tForecast95% Lower Bound95% Upper Bound
628019.822979027396944.922962107329094.72299594745
638663.839228197737321.7199618380410005.9584945574
648496.376048513676964.4242147804910028.3278822469
658475.474891757536753.9252454307610197.0245380843
667870.643531405116057.913408372239683.37365443799
677351.157816349345451.748383187349250.56724951134
687219.341811353725171.290158150949267.3934645565
697336.518378964495089.240102611889583.79665531711
707608.409091748925121.5722340812510095.2459494166
717812.213404786365101.4172989860510523.0095105867
727474.630930538634707.403755228110241.8581058492
737474.944277293984749.5669037960510200.3216507919

\begin{tabular}{lllllllll}
\hline
Extrapolation Forecasts of Exponential Smoothing \tabularnewline
t & Forecast & 95% Lower Bound & 95% Upper Bound \tabularnewline
62 & 8019.82297902739 & 6944.92296210732 & 9094.72299594745 \tabularnewline
63 & 8663.83922819773 & 7321.71996183804 & 10005.9584945574 \tabularnewline
64 & 8496.37604851367 & 6964.42421478049 & 10028.3278822469 \tabularnewline
65 & 8475.47489175753 & 6753.92524543076 & 10197.0245380843 \tabularnewline
66 & 7870.64353140511 & 6057.91340837223 & 9683.37365443799 \tabularnewline
67 & 7351.15781634934 & 5451.74838318734 & 9250.56724951134 \tabularnewline
68 & 7219.34181135372 & 5171.29015815094 & 9267.3934645565 \tabularnewline
69 & 7336.51837896449 & 5089.24010261188 & 9583.79665531711 \tabularnewline
70 & 7608.40909174892 & 5121.57223408125 & 10095.2459494166 \tabularnewline
71 & 7812.21340478636 & 5101.41729898605 & 10523.0095105867 \tabularnewline
72 & 7474.63093053863 & 4707.4037552281 & 10241.8581058492 \tabularnewline
73 & 7474.94427729398 & 4749.56690379605 & 10200.3216507919 \tabularnewline
\hline
\end{tabular}
%Source: https://freestatistics.org/blog/index.php?pk=&T=3

[TABLE]
[ROW][C]Extrapolation Forecasts of Exponential Smoothing[/C][/ROW]
[ROW][C]t[/C][C]Forecast[/C][C]95% Lower Bound[/C][C]95% Upper Bound[/C][/ROW]
[ROW][C]62[/C][C]8019.82297902739[/C][C]6944.92296210732[/C][C]9094.72299594745[/C][/ROW]
[ROW][C]63[/C][C]8663.83922819773[/C][C]7321.71996183804[/C][C]10005.9584945574[/C][/ROW]
[ROW][C]64[/C][C]8496.37604851367[/C][C]6964.42421478049[/C][C]10028.3278822469[/C][/ROW]
[ROW][C]65[/C][C]8475.47489175753[/C][C]6753.92524543076[/C][C]10197.0245380843[/C][/ROW]
[ROW][C]66[/C][C]7870.64353140511[/C][C]6057.91340837223[/C][C]9683.37365443799[/C][/ROW]
[ROW][C]67[/C][C]7351.15781634934[/C][C]5451.74838318734[/C][C]9250.56724951134[/C][/ROW]
[ROW][C]68[/C][C]7219.34181135372[/C][C]5171.29015815094[/C][C]9267.3934645565[/C][/ROW]
[ROW][C]69[/C][C]7336.51837896449[/C][C]5089.24010261188[/C][C]9583.79665531711[/C][/ROW]
[ROW][C]70[/C][C]7608.40909174892[/C][C]5121.57223408125[/C][C]10095.2459494166[/C][/ROW]
[ROW][C]71[/C][C]7812.21340478636[/C][C]5101.41729898605[/C][C]10523.0095105867[/C][/ROW]
[ROW][C]72[/C][C]7474.63093053863[/C][C]4707.4037552281[/C][C]10241.8581058492[/C][/ROW]
[ROW][C]73[/C][C]7474.94427729398[/C][C]4749.56690379605[/C][C]10200.3216507919[/C][/ROW]
[/TABLE]
Source: https://freestatistics.org/blog/index.php?pk=&T=3

Globally Unique Identifier (entire table): ba.freestatistics.org/blog/index.php?pk=&T=3

As an alternative you can also use a QR Code:  

The GUIDs for individual cells are displayed in the table below:

Extrapolation Forecasts of Exponential Smoothing
tForecast95% Lower Bound95% Upper Bound
628019.822979027396944.922962107329094.72299594745
638663.839228197737321.7199618380410005.9584945574
648496.376048513676964.4242147804910028.3278822469
658475.474891757536753.9252454307610197.0245380843
667870.643531405116057.913408372239683.37365443799
677351.157816349345451.748383187349250.56724951134
687219.341811353725171.290158150949267.3934645565
697336.518378964495089.240102611889583.79665531711
707608.409091748925121.5722340812510095.2459494166
717812.213404786365101.4172989860510523.0095105867
727474.630930538634707.403755228110241.8581058492
737474.944277293984749.5669037960510200.3216507919


Parameters (Session):
par1 = 12 ; par2 = Triple ; par3 = multiplicative ;
Parameters (R input):
par1 = 12 ; par2 = Triple ; par3 = multiplicative ;
R code (references can be found in the software module):
par1 <- as.numeric(par1)
if (par2 == 'Single') K <- 1
if (par2 == 'Double') K <- 2
if (par2 == 'Triple') K <- par1
nx <- length(x)
nxmK <- nx - K
x <- ts(x, frequency = par1)
if (par2 == 'Single') fit <- HoltWinters(x, gamma=F, beta=F)
if (par2 == 'Double') fit <- HoltWinters(x, gamma=F)
if (par2 == 'Triple') fit <- HoltWinters(x, seasonal=par3)
fit
myresid <- x - fit$fitted[,'xhat']
bitmap(file='test1.png')
op <- par(mfrow=c(2,1))
plot(fit,ylab='Observed (black) / Fitted (red)',main='Interpolation Fit of Exponential Smoothing')
plot(myresid,ylab='Residuals',main='Interpolation Prediction Errors')
par(op)
dev.off()
bitmap(file='test2.png')
p <- predict(fit, par1, prediction.interval=TRUE)
np <- length(p[,1])
plot(fit,p,ylab='Observed (black) / Fitted (red)',main='Extrapolation Fit of Exponential Smoothing')
dev.off()
bitmap(file='test3.png')
op <- par(mfrow = c(2,2))
acf(as.numeric(myresid),lag.max = nx/2,main='Residual ACF')
spectrum(myresid,main='Residals Periodogram')
cpgram(myresid,main='Residal Cumulative Periodogram')
qqnorm(myresid,main='Residual Normal QQ Plot')
qqline(myresid)
par(op)
dev.off()
load(file='createtable')
a<-table.start()
a<-table.row.start(a)
a<-table.element(a,'Estimated Parameters of Exponential Smoothing',2,TRUE)
a<-table.row.end(a)
a<-table.row.start(a)
a<-table.element(a,'Parameter',header=TRUE)
a<-table.element(a,'Value',header=TRUE)
a<-table.row.end(a)
a<-table.row.start(a)
a<-table.element(a,'alpha',header=TRUE)
a<-table.element(a,fit$alpha)
a<-table.row.end(a)
a<-table.row.start(a)
a<-table.element(a,'beta',header=TRUE)
a<-table.element(a,fit$beta)
a<-table.row.end(a)
a<-table.row.start(a)
a<-table.element(a,'gamma',header=TRUE)
a<-table.element(a,fit$gamma)
a<-table.row.end(a)
a<-table.end(a)
table.save(a,file='mytable.tab')
a<-table.start()
a<-table.row.start(a)
a<-table.element(a,'Interpolation Forecasts of Exponential Smoothing',4,TRUE)
a<-table.row.end(a)
a<-table.row.start(a)
a<-table.element(a,'t',header=TRUE)
a<-table.element(a,'Observed',header=TRUE)
a<-table.element(a,'Fitted',header=TRUE)
a<-table.element(a,'Residuals',header=TRUE)
a<-table.row.end(a)
for (i in 1:nxmK) {
a<-table.row.start(a)
a<-table.element(a,i+K,header=TRUE)
a<-table.element(a,x[i+K])
a<-table.element(a,fit$fitted[i,'xhat'])
a<-table.element(a,myresid[i])
a<-table.row.end(a)
}
a<-table.end(a)
table.save(a,file='mytable1.tab')
a<-table.start()
a<-table.row.start(a)
a<-table.element(a,'Extrapolation Forecasts of Exponential Smoothing',4,TRUE)
a<-table.row.end(a)
a<-table.row.start(a)
a<-table.element(a,'t',header=TRUE)
a<-table.element(a,'Forecast',header=TRUE)
a<-table.element(a,'95% Lower Bound',header=TRUE)
a<-table.element(a,'95% Upper Bound',header=TRUE)
a<-table.row.end(a)
for (i in 1:np) {
a<-table.row.start(a)
a<-table.element(a,nx+i,header=TRUE)
a<-table.element(a,p[i,'fit'])
a<-table.element(a,p[i,'lwr'])
a<-table.element(a,p[i,'upr'])
a<-table.row.end(a)
}
a<-table.end(a)
table.save(a,file='mytable2.tab')