Free Statistics

of Irreproducible Research!

Author's title

Author*Unverified author*
R Software Modulerwasp_decompose.wasp
Title produced by softwareClassical Decomposition
Date of computationMon, 01 May 2017 12:08:18 +0100
Cite this page as followsStatistical Computations at FreeStatistics.org, Office for Research Development and Education, URL https://freestatistics.org/blog/index.php?v=date/2017/May/01/t1493636961ctpavf03yx8o6vd.htm/, Retrieved Thu, 16 May 2024 01:03:59 +0200
Statistical Computations at FreeStatistics.org, Office for Research Development and Education, URL https://freestatistics.org/blog/index.php?pk=, Retrieved Thu, 16 May 2024 01:03:59 +0200
QR Codes:

Original text written by user:
IsPrivate?No (this computation is public)
User-defined keywords
Estimated Impact0
Dataseries X:
95.2
95.34
95.32
96.04
99.65
100.85
108.18
108.18
103.14
99.71
99.39
98.99
98.83
99.52
99.5
99.5
99.39
101.79
106.03
105.41
104.32
101.17
99.79
100.08
100.27
101.63
101.74
103.73
103.29
105.71
107.42
107.57
105.13
103.61
102.35
102.14
104.32
104.69
106.02
104.78
106.36
109.27
113.46
113.46
110.61
104.37
103.82
104.1


Summary of computational transaction
Raw Inputview raw input (R code)
Raw Outputview raw output of R engine
Computing time3 seconds
R Server'Sir Ronald Aylmer Fisher' @ fisher.wessa.net

\begin{tabular}{lllllllll}
\hline
Summary of computational transaction \tabularnewline
Raw Input & view raw input (R code)  \tabularnewline
Raw Output & view raw output of R engine  \tabularnewline
Computing time & 3 seconds \tabularnewline
R Server & 'Sir Ronald Aylmer Fisher' @ fisher.wessa.net \tabularnewline
\hline
\end{tabular}
%Source: https://freestatistics.org/blog/index.php?pk=&T=0

[TABLE]
[ROW][C]Summary of computational transaction[/C][/ROW]
[ROW][C]Raw Input[/C][C]view raw input (R code) [/C][/ROW]
[ROW][C]Raw Output[/C][C]view raw output of R engine [/C][/ROW]
[ROW][C]Computing time[/C][C]3 seconds[/C][/ROW]
[ROW][C]R Server[/C][C]'Sir Ronald Aylmer Fisher' @ fisher.wessa.net[/C][/ROW]
[/TABLE]
Source: https://freestatistics.org/blog/index.php?pk=&T=0

Globally Unique Identifier (entire table): ba.freestatistics.org/blog/index.php?pk=&T=0

As an alternative you can also use a QR Code:  

The GUIDs for individual cells are displayed in the table below:

Summary of computational transaction
Raw Inputview raw input (R code)
Raw Outputview raw output of R engine
Computing time3 seconds
R Server'Sir Ronald Aylmer Fisher' @ fisher.wessa.net


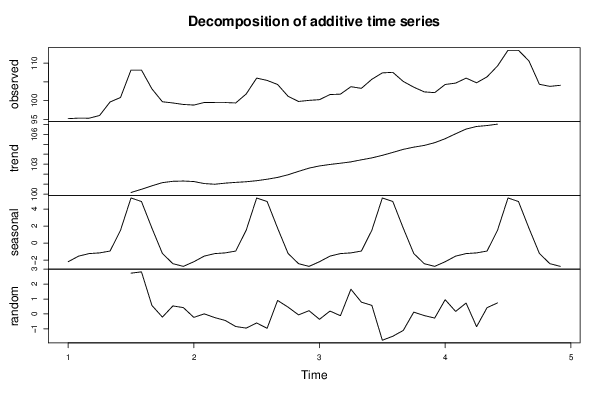
Classical Decomposition by Moving Averages
tObservationsFitTrendSeasonalRandom
195.2NANA-2.19267NA
295.34NANA-1.53267NA
395.32NANA-1.23642NA
496.04NANA-1.1549NA
599.65NANA-0.937812NA
6100.85NANA1.50635NA
7108.18105.448100.155.297332.73226
8108.18105.36100.4764.884132.82003
9103.14102.573100.8241.748990.56684
1099.7199.9215101.142-1.22101-0.211493
1199.3998.8536101.276-2.422260.536424
1298.9998.5651101.304-2.739060.424896
1398.8399.0611101.254-2.19267-0.231076
1499.5299.5161101.049-1.532670.00392361
1599.599.7461100.982-1.23642-0.246076
1699.599.9376101.092-1.1549-0.437604
1799.39100.232101.17-0.937812-0.842188
18101.79102.738101.2321.50635-0.948437
19106.03106.635101.3385.29733-0.604826
20105.41106.37101.4854.88413-0.959549
21104.32103.416101.6671.748990.90434
22101.17100.715101.936-1.221010.454757
2399.7999.8527102.275-2.42226-0.0627431
24100.0899.8618102.601-2.739060.218229
25100.27100.629102.822-2.19267-0.35941
26101.63101.437102.97-1.532670.192674
27101.74101.857103.094-1.23642-0.117326
28103.73102.074103.229-1.15491.65573
29103.29102.5103.437-0.9378120.790313
30105.71105.136103.631.506350.573646
31107.42109.182103.8855.29733-1.76191
32107.57109.065104.1814.88413-1.49497
33105.13106.236104.4871.74899-1.10566
34103.61103.488104.709-1.221010.122257
35102.35102.458104.88-2.42226-0.10816
36102.14102.418105.157-2.73906-0.277604
37104.32103.364105.557-2.192670.956007
38104.69104.521106.054-1.532670.168924
39106.02105.291106.528-1.236420.728924
40104.78105.633106.787-1.1549-0.852604
41106.36105.943106.88-0.9378120.417396
42109.27108.53107.0231.506350.740313
43113.46NANA5.29733NA
44113.46NANA4.88413NA
45110.61NANA1.74899NA
46104.37NANA-1.22101NA
47103.82NANA-2.42226NA
48104.1NANA-2.73906NA

\begin{tabular}{lllllllll}
\hline
Classical Decomposition by Moving Averages \tabularnewline
t & Observations & Fit & Trend & Seasonal & Random \tabularnewline
1 & 95.2 & NA & NA & -2.19267 & NA \tabularnewline
2 & 95.34 & NA & NA & -1.53267 & NA \tabularnewline
3 & 95.32 & NA & NA & -1.23642 & NA \tabularnewline
4 & 96.04 & NA & NA & -1.1549 & NA \tabularnewline
5 & 99.65 & NA & NA & -0.937812 & NA \tabularnewline
6 & 100.85 & NA & NA & 1.50635 & NA \tabularnewline
7 & 108.18 & 105.448 & 100.15 & 5.29733 & 2.73226 \tabularnewline
8 & 108.18 & 105.36 & 100.476 & 4.88413 & 2.82003 \tabularnewline
9 & 103.14 & 102.573 & 100.824 & 1.74899 & 0.56684 \tabularnewline
10 & 99.71 & 99.9215 & 101.142 & -1.22101 & -0.211493 \tabularnewline
11 & 99.39 & 98.8536 & 101.276 & -2.42226 & 0.536424 \tabularnewline
12 & 98.99 & 98.5651 & 101.304 & -2.73906 & 0.424896 \tabularnewline
13 & 98.83 & 99.0611 & 101.254 & -2.19267 & -0.231076 \tabularnewline
14 & 99.52 & 99.5161 & 101.049 & -1.53267 & 0.00392361 \tabularnewline
15 & 99.5 & 99.7461 & 100.982 & -1.23642 & -0.246076 \tabularnewline
16 & 99.5 & 99.9376 & 101.092 & -1.1549 & -0.437604 \tabularnewline
17 & 99.39 & 100.232 & 101.17 & -0.937812 & -0.842188 \tabularnewline
18 & 101.79 & 102.738 & 101.232 & 1.50635 & -0.948437 \tabularnewline
19 & 106.03 & 106.635 & 101.338 & 5.29733 & -0.604826 \tabularnewline
20 & 105.41 & 106.37 & 101.485 & 4.88413 & -0.959549 \tabularnewline
21 & 104.32 & 103.416 & 101.667 & 1.74899 & 0.90434 \tabularnewline
22 & 101.17 & 100.715 & 101.936 & -1.22101 & 0.454757 \tabularnewline
23 & 99.79 & 99.8527 & 102.275 & -2.42226 & -0.0627431 \tabularnewline
24 & 100.08 & 99.8618 & 102.601 & -2.73906 & 0.218229 \tabularnewline
25 & 100.27 & 100.629 & 102.822 & -2.19267 & -0.35941 \tabularnewline
26 & 101.63 & 101.437 & 102.97 & -1.53267 & 0.192674 \tabularnewline
27 & 101.74 & 101.857 & 103.094 & -1.23642 & -0.117326 \tabularnewline
28 & 103.73 & 102.074 & 103.229 & -1.1549 & 1.65573 \tabularnewline
29 & 103.29 & 102.5 & 103.437 & -0.937812 & 0.790313 \tabularnewline
30 & 105.71 & 105.136 & 103.63 & 1.50635 & 0.573646 \tabularnewline
31 & 107.42 & 109.182 & 103.885 & 5.29733 & -1.76191 \tabularnewline
32 & 107.57 & 109.065 & 104.181 & 4.88413 & -1.49497 \tabularnewline
33 & 105.13 & 106.236 & 104.487 & 1.74899 & -1.10566 \tabularnewline
34 & 103.61 & 103.488 & 104.709 & -1.22101 & 0.122257 \tabularnewline
35 & 102.35 & 102.458 & 104.88 & -2.42226 & -0.10816 \tabularnewline
36 & 102.14 & 102.418 & 105.157 & -2.73906 & -0.277604 \tabularnewline
37 & 104.32 & 103.364 & 105.557 & -2.19267 & 0.956007 \tabularnewline
38 & 104.69 & 104.521 & 106.054 & -1.53267 & 0.168924 \tabularnewline
39 & 106.02 & 105.291 & 106.528 & -1.23642 & 0.728924 \tabularnewline
40 & 104.78 & 105.633 & 106.787 & -1.1549 & -0.852604 \tabularnewline
41 & 106.36 & 105.943 & 106.88 & -0.937812 & 0.417396 \tabularnewline
42 & 109.27 & 108.53 & 107.023 & 1.50635 & 0.740313 \tabularnewline
43 & 113.46 & NA & NA & 5.29733 & NA \tabularnewline
44 & 113.46 & NA & NA & 4.88413 & NA \tabularnewline
45 & 110.61 & NA & NA & 1.74899 & NA \tabularnewline
46 & 104.37 & NA & NA & -1.22101 & NA \tabularnewline
47 & 103.82 & NA & NA & -2.42226 & NA \tabularnewline
48 & 104.1 & NA & NA & -2.73906 & NA \tabularnewline
\hline
\end{tabular}
%Source: https://freestatistics.org/blog/index.php?pk=&T=1

[TABLE]
[ROW][C]Classical Decomposition by Moving Averages[/C][/ROW]
[ROW][C]t[/C][C]Observations[/C][C]Fit[/C][C]Trend[/C][C]Seasonal[/C][C]Random[/C][/ROW]
[ROW][C]1[/C][C]95.2[/C][C]NA[/C][C]NA[/C][C]-2.19267[/C][C]NA[/C][/ROW]
[ROW][C]2[/C][C]95.34[/C][C]NA[/C][C]NA[/C][C]-1.53267[/C][C]NA[/C][/ROW]
[ROW][C]3[/C][C]95.32[/C][C]NA[/C][C]NA[/C][C]-1.23642[/C][C]NA[/C][/ROW]
[ROW][C]4[/C][C]96.04[/C][C]NA[/C][C]NA[/C][C]-1.1549[/C][C]NA[/C][/ROW]
[ROW][C]5[/C][C]99.65[/C][C]NA[/C][C]NA[/C][C]-0.937812[/C][C]NA[/C][/ROW]
[ROW][C]6[/C][C]100.85[/C][C]NA[/C][C]NA[/C][C]1.50635[/C][C]NA[/C][/ROW]
[ROW][C]7[/C][C]108.18[/C][C]105.448[/C][C]100.15[/C][C]5.29733[/C][C]2.73226[/C][/ROW]
[ROW][C]8[/C][C]108.18[/C][C]105.36[/C][C]100.476[/C][C]4.88413[/C][C]2.82003[/C][/ROW]
[ROW][C]9[/C][C]103.14[/C][C]102.573[/C][C]100.824[/C][C]1.74899[/C][C]0.56684[/C][/ROW]
[ROW][C]10[/C][C]99.71[/C][C]99.9215[/C][C]101.142[/C][C]-1.22101[/C][C]-0.211493[/C][/ROW]
[ROW][C]11[/C][C]99.39[/C][C]98.8536[/C][C]101.276[/C][C]-2.42226[/C][C]0.536424[/C][/ROW]
[ROW][C]12[/C][C]98.99[/C][C]98.5651[/C][C]101.304[/C][C]-2.73906[/C][C]0.424896[/C][/ROW]
[ROW][C]13[/C][C]98.83[/C][C]99.0611[/C][C]101.254[/C][C]-2.19267[/C][C]-0.231076[/C][/ROW]
[ROW][C]14[/C][C]99.52[/C][C]99.5161[/C][C]101.049[/C][C]-1.53267[/C][C]0.00392361[/C][/ROW]
[ROW][C]15[/C][C]99.5[/C][C]99.7461[/C][C]100.982[/C][C]-1.23642[/C][C]-0.246076[/C][/ROW]
[ROW][C]16[/C][C]99.5[/C][C]99.9376[/C][C]101.092[/C][C]-1.1549[/C][C]-0.437604[/C][/ROW]
[ROW][C]17[/C][C]99.39[/C][C]100.232[/C][C]101.17[/C][C]-0.937812[/C][C]-0.842188[/C][/ROW]
[ROW][C]18[/C][C]101.79[/C][C]102.738[/C][C]101.232[/C][C]1.50635[/C][C]-0.948437[/C][/ROW]
[ROW][C]19[/C][C]106.03[/C][C]106.635[/C][C]101.338[/C][C]5.29733[/C][C]-0.604826[/C][/ROW]
[ROW][C]20[/C][C]105.41[/C][C]106.37[/C][C]101.485[/C][C]4.88413[/C][C]-0.959549[/C][/ROW]
[ROW][C]21[/C][C]104.32[/C][C]103.416[/C][C]101.667[/C][C]1.74899[/C][C]0.90434[/C][/ROW]
[ROW][C]22[/C][C]101.17[/C][C]100.715[/C][C]101.936[/C][C]-1.22101[/C][C]0.454757[/C][/ROW]
[ROW][C]23[/C][C]99.79[/C][C]99.8527[/C][C]102.275[/C][C]-2.42226[/C][C]-0.0627431[/C][/ROW]
[ROW][C]24[/C][C]100.08[/C][C]99.8618[/C][C]102.601[/C][C]-2.73906[/C][C]0.218229[/C][/ROW]
[ROW][C]25[/C][C]100.27[/C][C]100.629[/C][C]102.822[/C][C]-2.19267[/C][C]-0.35941[/C][/ROW]
[ROW][C]26[/C][C]101.63[/C][C]101.437[/C][C]102.97[/C][C]-1.53267[/C][C]0.192674[/C][/ROW]
[ROW][C]27[/C][C]101.74[/C][C]101.857[/C][C]103.094[/C][C]-1.23642[/C][C]-0.117326[/C][/ROW]
[ROW][C]28[/C][C]103.73[/C][C]102.074[/C][C]103.229[/C][C]-1.1549[/C][C]1.65573[/C][/ROW]
[ROW][C]29[/C][C]103.29[/C][C]102.5[/C][C]103.437[/C][C]-0.937812[/C][C]0.790313[/C][/ROW]
[ROW][C]30[/C][C]105.71[/C][C]105.136[/C][C]103.63[/C][C]1.50635[/C][C]0.573646[/C][/ROW]
[ROW][C]31[/C][C]107.42[/C][C]109.182[/C][C]103.885[/C][C]5.29733[/C][C]-1.76191[/C][/ROW]
[ROW][C]32[/C][C]107.57[/C][C]109.065[/C][C]104.181[/C][C]4.88413[/C][C]-1.49497[/C][/ROW]
[ROW][C]33[/C][C]105.13[/C][C]106.236[/C][C]104.487[/C][C]1.74899[/C][C]-1.10566[/C][/ROW]
[ROW][C]34[/C][C]103.61[/C][C]103.488[/C][C]104.709[/C][C]-1.22101[/C][C]0.122257[/C][/ROW]
[ROW][C]35[/C][C]102.35[/C][C]102.458[/C][C]104.88[/C][C]-2.42226[/C][C]-0.10816[/C][/ROW]
[ROW][C]36[/C][C]102.14[/C][C]102.418[/C][C]105.157[/C][C]-2.73906[/C][C]-0.277604[/C][/ROW]
[ROW][C]37[/C][C]104.32[/C][C]103.364[/C][C]105.557[/C][C]-2.19267[/C][C]0.956007[/C][/ROW]
[ROW][C]38[/C][C]104.69[/C][C]104.521[/C][C]106.054[/C][C]-1.53267[/C][C]0.168924[/C][/ROW]
[ROW][C]39[/C][C]106.02[/C][C]105.291[/C][C]106.528[/C][C]-1.23642[/C][C]0.728924[/C][/ROW]
[ROW][C]40[/C][C]104.78[/C][C]105.633[/C][C]106.787[/C][C]-1.1549[/C][C]-0.852604[/C][/ROW]
[ROW][C]41[/C][C]106.36[/C][C]105.943[/C][C]106.88[/C][C]-0.937812[/C][C]0.417396[/C][/ROW]
[ROW][C]42[/C][C]109.27[/C][C]108.53[/C][C]107.023[/C][C]1.50635[/C][C]0.740313[/C][/ROW]
[ROW][C]43[/C][C]113.46[/C][C]NA[/C][C]NA[/C][C]5.29733[/C][C]NA[/C][/ROW]
[ROW][C]44[/C][C]113.46[/C][C]NA[/C][C]NA[/C][C]4.88413[/C][C]NA[/C][/ROW]
[ROW][C]45[/C][C]110.61[/C][C]NA[/C][C]NA[/C][C]1.74899[/C][C]NA[/C][/ROW]
[ROW][C]46[/C][C]104.37[/C][C]NA[/C][C]NA[/C][C]-1.22101[/C][C]NA[/C][/ROW]
[ROW][C]47[/C][C]103.82[/C][C]NA[/C][C]NA[/C][C]-2.42226[/C][C]NA[/C][/ROW]
[ROW][C]48[/C][C]104.1[/C][C]NA[/C][C]NA[/C][C]-2.73906[/C][C]NA[/C][/ROW]
[/TABLE]
Source: https://freestatistics.org/blog/index.php?pk=&T=1

Globally Unique Identifier (entire table): ba.freestatistics.org/blog/index.php?pk=&T=1

As an alternative you can also use a QR Code:  

The GUIDs for individual cells are displayed in the table below:

Classical Decomposition by Moving Averages
tObservationsFitTrendSeasonalRandom
195.2NANA-2.19267NA
295.34NANA-1.53267NA
395.32NANA-1.23642NA
496.04NANA-1.1549NA
599.65NANA-0.937812NA
6100.85NANA1.50635NA
7108.18105.448100.155.297332.73226
8108.18105.36100.4764.884132.82003
9103.14102.573100.8241.748990.56684
1099.7199.9215101.142-1.22101-0.211493
1199.3998.8536101.276-2.422260.536424
1298.9998.5651101.304-2.739060.424896
1398.8399.0611101.254-2.19267-0.231076
1499.5299.5161101.049-1.532670.00392361
1599.599.7461100.982-1.23642-0.246076
1699.599.9376101.092-1.1549-0.437604
1799.39100.232101.17-0.937812-0.842188
18101.79102.738101.2321.50635-0.948437
19106.03106.635101.3385.29733-0.604826
20105.41106.37101.4854.88413-0.959549
21104.32103.416101.6671.748990.90434
22101.17100.715101.936-1.221010.454757
2399.7999.8527102.275-2.42226-0.0627431
24100.0899.8618102.601-2.739060.218229
25100.27100.629102.822-2.19267-0.35941
26101.63101.437102.97-1.532670.192674
27101.74101.857103.094-1.23642-0.117326
28103.73102.074103.229-1.15491.65573
29103.29102.5103.437-0.9378120.790313
30105.71105.136103.631.506350.573646
31107.42109.182103.8855.29733-1.76191
32107.57109.065104.1814.88413-1.49497
33105.13106.236104.4871.74899-1.10566
34103.61103.488104.709-1.221010.122257
35102.35102.458104.88-2.42226-0.10816
36102.14102.418105.157-2.73906-0.277604
37104.32103.364105.557-2.192670.956007
38104.69104.521106.054-1.532670.168924
39106.02105.291106.528-1.236420.728924
40104.78105.633106.787-1.1549-0.852604
41106.36105.943106.88-0.9378120.417396
42109.27108.53107.0231.506350.740313
43113.46NANA5.29733NA
44113.46NANA4.88413NA
45110.61NANA1.74899NA
46104.37NANA-1.22101NA
47103.82NANA-2.42226NA
48104.1NANA-2.73906NA


Parameters (Session):
par1 = additive ; par2 = 12 ;
Parameters (R input):
par1 = additive ; par2 = 12 ;
R code (references can be found in the software module):
par2 <- as.numeric(par2)
x <- ts(x,freq=par2)
m <- decompose(x,type=par1)
m$figure
bitmap(file='test1.png')
plot(m)
dev.off()
mylagmax <- length(x)/2
bitmap(file='test2.png')
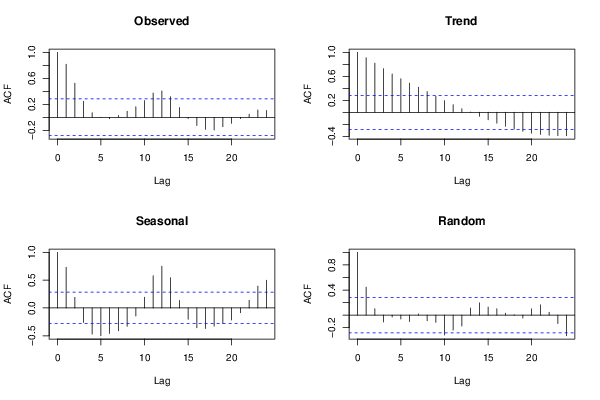
op <- par(mfrow = c(2,2))
acf(as.numeric(x),lag.max = mylagmax,main='Observed')
acf(as.numeric(m$trend),na.action=na.pass,lag.max = mylagmax,main='Trend')
acf(as.numeric(m$seasonal),na.action=na.pass,lag.max = mylagmax,main='Seasonal')
acf(as.numeric(m$random),na.action=na.pass,lag.max = mylagmax,main='Random')
par(op)
dev.off()
bitmap(file='test3.png')
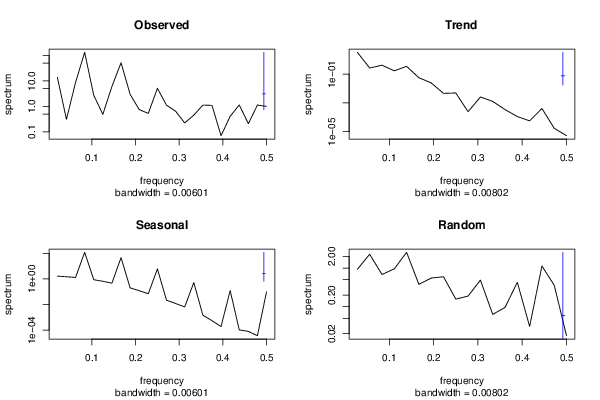
op <- par(mfrow = c(2,2))
spectrum(as.numeric(x),main='Observed')
spectrum(as.numeric(m$trend[!is.na(m$trend)]),main='Trend')
spectrum(as.numeric(m$seasonal[!is.na(m$seasonal)]),main='Seasonal')
spectrum(as.numeric(m$random[!is.na(m$random)]),main='Random')
par(op)
dev.off()
bitmap(file='test4.png')
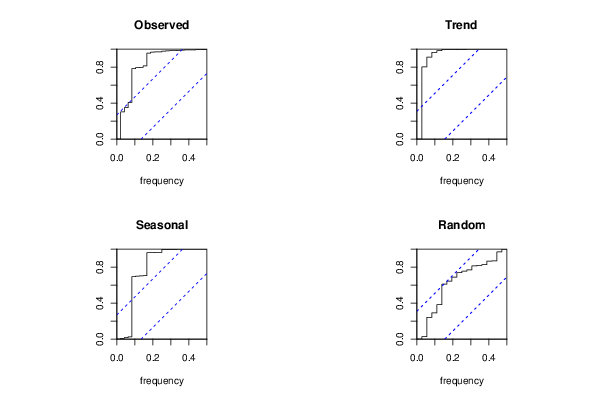
op <- par(mfrow = c(2,2))
cpgram(as.numeric(x),main='Observed')
cpgram(as.numeric(m$trend[!is.na(m$trend)]),main='Trend')
cpgram(as.numeric(m$seasonal[!is.na(m$seasonal)]),main='Seasonal')
cpgram(as.numeric(m$random[!is.na(m$random)]),main='Random')
par(op)
dev.off()
load(file='createtable')
a<-table.start()
a<-table.row.start(a)
a<-table.element(a,'Classical Decomposition by Moving Averages',6,TRUE)
a<-table.row.end(a)
a<-table.row.start(a)
a<-table.element(a,'t',header=TRUE)
a<-table.element(a,'Observations',header=TRUE)
a<-table.element(a,'Fit',header=TRUE)
a<-table.element(a,'Trend',header=TRUE)
a<-table.element(a,'Seasonal',header=TRUE)
a<-table.element(a,'Random',header=TRUE)
a<-table.row.end(a)
for (i in 1:length(m$trend)) {
a<-table.row.start(a)
a<-table.element(a,i,header=TRUE)
a<-table.element(a,x[i])
if (par1 == 'additive') a<-table.element(a,signif(m$trend[i]+m$seasonal[i],6)) else a<-table.element(a,signif(m$trend[i]*m$seasonal[i],6))
a<-table.element(a,signif(m$trend[i],6))
a<-table.element(a,signif(m$seasonal[i],6))
a<-table.element(a,signif(m$random[i],6))
a<-table.row.end(a)
}
a<-table.end(a)
table.save(a,file='mytable.tab')