Free Statistics

of Irreproducible Research!

Author's title

Author*Unverified author*
R Software Modulerwasp_exponentialsmoothing.wasp
Title produced by softwareExponential Smoothing
Date of computationMon, 01 May 2017 10:45:22 +0100
Cite this page as followsStatistical Computations at FreeStatistics.org, Office for Research Development and Education, URL https://freestatistics.org/blog/index.php?v=date/2017/May/01/t14936319489iioyo4ykwdejyz.htm/, Retrieved Wed, 15 May 2024 22:32:42 +0200
Statistical Computations at FreeStatistics.org, Office for Research Development and Education, URL https://freestatistics.org/blog/index.php?pk=, Retrieved Wed, 15 May 2024 22:32:42 +0200
QR Codes:

Original text written by user:
IsPrivate?No (this computation is public)
User-defined keywords
Estimated Impact0
Dataseries X:
96.16
96.4
96.87
97
97.26
97.42
97.64
97.93
98.1
98.29
98.42
98.49
98.67
99.1
99.37
99.54
99.58
99.77
100.06
100.26
100.57
100.94
101.03
101.12
101.26
101.94
102.26
102.51
102.61
102.76
103.04
103.22
103.47
103.64
103.76
103.85
103.98
104.68
105.07
105.19
105.39
105.66
105.76
105.89
106.04
106.37
106.57
106.67
107.08
107.64
108.47
108.7
108.82
108.99
109.18
109.31
109.5
109.7
109.9
110.09
110.47


Summary of computational transaction
Raw Inputview raw input (R code)
Raw Outputview raw output of R engine
Computing time2 seconds
R Server'George Udny Yule' @ yule.wessa.net

\begin{tabular}{lllllllll}
\hline
Summary of computational transaction \tabularnewline
Raw Input & view raw input (R code)  \tabularnewline
Raw Output & view raw output of R engine  \tabularnewline
Computing time & 2 seconds \tabularnewline
R Server & 'George Udny Yule' @ yule.wessa.net \tabularnewline
\hline
\end{tabular}
%Source: https://freestatistics.org/blog/index.php?pk=&T=0

[TABLE]
[ROW][C]Summary of computational transaction[/C][/ROW]
[ROW][C]Raw Input[/C][C]view raw input (R code) [/C][/ROW]
[ROW][C]Raw Output[/C][C]view raw output of R engine [/C][/ROW]
[ROW][C]Computing time[/C][C]2 seconds[/C][/ROW]
[ROW][C]R Server[/C][C]'George Udny Yule' @ yule.wessa.net[/C][/ROW]
[/TABLE]
Source: https://freestatistics.org/blog/index.php?pk=&T=0

Globally Unique Identifier (entire table): ba.freestatistics.org/blog/index.php?pk=&T=0

As an alternative you can also use a QR Code:  

The GUIDs for individual cells are displayed in the table below:

Summary of computational transaction
Raw Inputview raw input (R code)
Raw Outputview raw output of R engine
Computing time2 seconds
R Server'George Udny Yule' @ yule.wessa.net


Estimated Parameters of Exponential Smoothing
ParameterValue
alpha0.999950283163324
betaFALSE
gammaFALSE

\begin{tabular}{lllllllll}
\hline
Estimated Parameters of Exponential Smoothing \tabularnewline
Parameter & Value \tabularnewline
alpha & 0.999950283163324 \tabularnewline
beta & FALSE \tabularnewline
gamma & FALSE \tabularnewline
\hline
\end{tabular}
%Source: https://freestatistics.org/blog/index.php?pk=&T=1

[TABLE]
[ROW][C]Estimated Parameters of Exponential Smoothing[/C][/ROW]
[ROW][C]Parameter[/C][C]Value[/C][/ROW]
[ROW][C]alpha[/C][C]0.999950283163324[/C][/ROW]
[ROW][C]beta[/C][C]FALSE[/C][/ROW]
[ROW][C]gamma[/C][C]FALSE[/C][/ROW]
[/TABLE]
Source: https://freestatistics.org/blog/index.php?pk=&T=1

Globally Unique Identifier (entire table): ba.freestatistics.org/blog/index.php?pk=&T=1

As an alternative you can also use a QR Code:  

The GUIDs for individual cells are displayed in the table below:

Estimated Parameters of Exponential Smoothing
ParameterValue
alpha0.999950283163324
betaFALSE
gammaFALSE


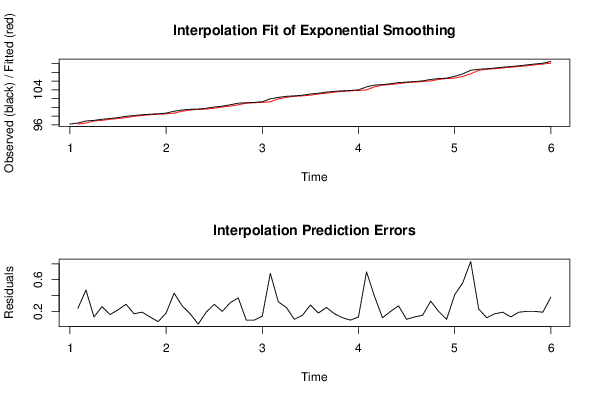
Interpolation Forecasts of Exponential Smoothing
tObservedFittedResiduals
296.496.160.240000000000009
396.8796.39998806795920.470011932040791
49796.86997663249350.130023367506453
597.2696.99999353564950.260006464350525
697.4297.25998707330110.160012926698926
797.6497.41999204466350.220007955336541
897.9397.63998906190040.290010938099584
998.197.92998558157360.170014418426433
1098.2998.09999154742090.190008452579093
1198.4298.28999055338080.130009446619198
1298.4998.41999353634160.0700064636584159
1398.6798.48999651950010.180003480499934
1499.198.66999105079640.430008949203639
1599.3799.09997862131530.270021378684703
1699.5499.36998657539120.170013424608797
1799.5899.53999154747030.040008452529662
1899.7799.57999801090630.190001989093687
19100.0699.76999055370210.290009446297859
20100.26100.0599855816480.200014418352282
21100.57100.2599900559160.310009944084157
22100.94100.5699845872860.370015412713755
23101.03100.9399816040040.0900183959958412
24101.12101.029995524570.0900044754298932
25101.26101.1199955252620.140004474737808
26101.94101.259993039420.68000696057959
27102.26101.9399661922050.320033807794999
28102.51102.2599840889310.250015911068559
29102.61102.509987570.100012430000206
30102.76102.6099950276980.150004972301645
31103.04102.7599925422270.280007457772697
32103.22103.0399860789150.180013921085049
33103.47103.2199910502770.250008949722712
34103.64103.4699875703460.170012429654122
35103.76103.639991547520.120008452480192
36103.85103.7599940335590.0900059664406285
37103.98103.8499955251880.13000447481194
38104.68103.9799935365890.700006463411242
39105.07104.6799651978930.390034802106996
40105.19105.0699806087030.120019391296552
41105.39105.1899940330160.200005966984477
42105.66105.3899900563360.270009943663993
43105.76105.659986575960.10001342404027
44105.89105.7599950276490.130004972351074
45106.04105.8899935365640.150006463435986
46106.37106.0399925421530.330007457846847
47106.57106.3699835930730.200016406926878
48106.67106.5699900558170.100009944183043
49107.08106.6699950278220.410004972178058
50107.64107.079979615850.560020384150249
51108.47107.6399721575580.830027842441979
52108.7108.4699587336410.230041266358683
53108.82108.6999885630760.120011436924059
54108.99108.8199940334110.170005966589002
55109.18108.9899915478410.190008452158892
56109.31109.1799905533810.130009446619169
57109.5109.3099935363420.19000646365842
58109.7109.499990553480.200009446520326
59109.9109.6999900561630.200009943836989
60110.09109.8999900561380.19000994386171
61110.47110.0899905533070.380009446693336

\begin{tabular}{lllllllll}
\hline
Interpolation Forecasts of Exponential Smoothing \tabularnewline
t & Observed & Fitted & Residuals \tabularnewline
2 & 96.4 & 96.16 & 0.240000000000009 \tabularnewline
3 & 96.87 & 96.3999880679592 & 0.470011932040791 \tabularnewline
4 & 97 & 96.8699766324935 & 0.130023367506453 \tabularnewline
5 & 97.26 & 96.9999935356495 & 0.260006464350525 \tabularnewline
6 & 97.42 & 97.2599870733011 & 0.160012926698926 \tabularnewline
7 & 97.64 & 97.4199920446635 & 0.220007955336541 \tabularnewline
8 & 97.93 & 97.6399890619004 & 0.290010938099584 \tabularnewline
9 & 98.1 & 97.9299855815736 & 0.170014418426433 \tabularnewline
10 & 98.29 & 98.0999915474209 & 0.190008452579093 \tabularnewline
11 & 98.42 & 98.2899905533808 & 0.130009446619198 \tabularnewline
12 & 98.49 & 98.4199935363416 & 0.0700064636584159 \tabularnewline
13 & 98.67 & 98.4899965195001 & 0.180003480499934 \tabularnewline
14 & 99.1 & 98.6699910507964 & 0.430008949203639 \tabularnewline
15 & 99.37 & 99.0999786213153 & 0.270021378684703 \tabularnewline
16 & 99.54 & 99.3699865753912 & 0.170013424608797 \tabularnewline
17 & 99.58 & 99.5399915474703 & 0.040008452529662 \tabularnewline
18 & 99.77 & 99.5799980109063 & 0.190001989093687 \tabularnewline
19 & 100.06 & 99.7699905537021 & 0.290009446297859 \tabularnewline
20 & 100.26 & 100.059985581648 & 0.200014418352282 \tabularnewline
21 & 100.57 & 100.259990055916 & 0.310009944084157 \tabularnewline
22 & 100.94 & 100.569984587286 & 0.370015412713755 \tabularnewline
23 & 101.03 & 100.939981604004 & 0.0900183959958412 \tabularnewline
24 & 101.12 & 101.02999552457 & 0.0900044754298932 \tabularnewline
25 & 101.26 & 101.119995525262 & 0.140004474737808 \tabularnewline
26 & 101.94 & 101.25999303942 & 0.68000696057959 \tabularnewline
27 & 102.26 & 101.939966192205 & 0.320033807794999 \tabularnewline
28 & 102.51 & 102.259984088931 & 0.250015911068559 \tabularnewline
29 & 102.61 & 102.50998757 & 0.100012430000206 \tabularnewline
30 & 102.76 & 102.609995027698 & 0.150004972301645 \tabularnewline
31 & 103.04 & 102.759992542227 & 0.280007457772697 \tabularnewline
32 & 103.22 & 103.039986078915 & 0.180013921085049 \tabularnewline
33 & 103.47 & 103.219991050277 & 0.250008949722712 \tabularnewline
34 & 103.64 & 103.469987570346 & 0.170012429654122 \tabularnewline
35 & 103.76 & 103.63999154752 & 0.120008452480192 \tabularnewline
36 & 103.85 & 103.759994033559 & 0.0900059664406285 \tabularnewline
37 & 103.98 & 103.849995525188 & 0.13000447481194 \tabularnewline
38 & 104.68 & 103.979993536589 & 0.700006463411242 \tabularnewline
39 & 105.07 & 104.679965197893 & 0.390034802106996 \tabularnewline
40 & 105.19 & 105.069980608703 & 0.120019391296552 \tabularnewline
41 & 105.39 & 105.189994033016 & 0.200005966984477 \tabularnewline
42 & 105.66 & 105.389990056336 & 0.270009943663993 \tabularnewline
43 & 105.76 & 105.65998657596 & 0.10001342404027 \tabularnewline
44 & 105.89 & 105.759995027649 & 0.130004972351074 \tabularnewline
45 & 106.04 & 105.889993536564 & 0.150006463435986 \tabularnewline
46 & 106.37 & 106.039992542153 & 0.330007457846847 \tabularnewline
47 & 106.57 & 106.369983593073 & 0.200016406926878 \tabularnewline
48 & 106.67 & 106.569990055817 & 0.100009944183043 \tabularnewline
49 & 107.08 & 106.669995027822 & 0.410004972178058 \tabularnewline
50 & 107.64 & 107.07997961585 & 0.560020384150249 \tabularnewline
51 & 108.47 & 107.639972157558 & 0.830027842441979 \tabularnewline
52 & 108.7 & 108.469958733641 & 0.230041266358683 \tabularnewline
53 & 108.82 & 108.699988563076 & 0.120011436924059 \tabularnewline
54 & 108.99 & 108.819994033411 & 0.170005966589002 \tabularnewline
55 & 109.18 & 108.989991547841 & 0.190008452158892 \tabularnewline
56 & 109.31 & 109.179990553381 & 0.130009446619169 \tabularnewline
57 & 109.5 & 109.309993536342 & 0.19000646365842 \tabularnewline
58 & 109.7 & 109.49999055348 & 0.200009446520326 \tabularnewline
59 & 109.9 & 109.699990056163 & 0.200009943836989 \tabularnewline
60 & 110.09 & 109.899990056138 & 0.19000994386171 \tabularnewline
61 & 110.47 & 110.089990553307 & 0.380009446693336 \tabularnewline
\hline
\end{tabular}
%Source: https://freestatistics.org/blog/index.php?pk=&T=2

[TABLE]
[ROW][C]Interpolation Forecasts of Exponential Smoothing[/C][/ROW]
[ROW][C]t[/C][C]Observed[/C][C]Fitted[/C][C]Residuals[/C][/ROW]
[ROW][C]2[/C][C]96.4[/C][C]96.16[/C][C]0.240000000000009[/C][/ROW]
[ROW][C]3[/C][C]96.87[/C][C]96.3999880679592[/C][C]0.470011932040791[/C][/ROW]
[ROW][C]4[/C][C]97[/C][C]96.8699766324935[/C][C]0.130023367506453[/C][/ROW]
[ROW][C]5[/C][C]97.26[/C][C]96.9999935356495[/C][C]0.260006464350525[/C][/ROW]
[ROW][C]6[/C][C]97.42[/C][C]97.2599870733011[/C][C]0.160012926698926[/C][/ROW]
[ROW][C]7[/C][C]97.64[/C][C]97.4199920446635[/C][C]0.220007955336541[/C][/ROW]
[ROW][C]8[/C][C]97.93[/C][C]97.6399890619004[/C][C]0.290010938099584[/C][/ROW]
[ROW][C]9[/C][C]98.1[/C][C]97.9299855815736[/C][C]0.170014418426433[/C][/ROW]
[ROW][C]10[/C][C]98.29[/C][C]98.0999915474209[/C][C]0.190008452579093[/C][/ROW]
[ROW][C]11[/C][C]98.42[/C][C]98.2899905533808[/C][C]0.130009446619198[/C][/ROW]
[ROW][C]12[/C][C]98.49[/C][C]98.4199935363416[/C][C]0.0700064636584159[/C][/ROW]
[ROW][C]13[/C][C]98.67[/C][C]98.4899965195001[/C][C]0.180003480499934[/C][/ROW]
[ROW][C]14[/C][C]99.1[/C][C]98.6699910507964[/C][C]0.430008949203639[/C][/ROW]
[ROW][C]15[/C][C]99.37[/C][C]99.0999786213153[/C][C]0.270021378684703[/C][/ROW]
[ROW][C]16[/C][C]99.54[/C][C]99.3699865753912[/C][C]0.170013424608797[/C][/ROW]
[ROW][C]17[/C][C]99.58[/C][C]99.5399915474703[/C][C]0.040008452529662[/C][/ROW]
[ROW][C]18[/C][C]99.77[/C][C]99.5799980109063[/C][C]0.190001989093687[/C][/ROW]
[ROW][C]19[/C][C]100.06[/C][C]99.7699905537021[/C][C]0.290009446297859[/C][/ROW]
[ROW][C]20[/C][C]100.26[/C][C]100.059985581648[/C][C]0.200014418352282[/C][/ROW]
[ROW][C]21[/C][C]100.57[/C][C]100.259990055916[/C][C]0.310009944084157[/C][/ROW]
[ROW][C]22[/C][C]100.94[/C][C]100.569984587286[/C][C]0.370015412713755[/C][/ROW]
[ROW][C]23[/C][C]101.03[/C][C]100.939981604004[/C][C]0.0900183959958412[/C][/ROW]
[ROW][C]24[/C][C]101.12[/C][C]101.02999552457[/C][C]0.0900044754298932[/C][/ROW]
[ROW][C]25[/C][C]101.26[/C][C]101.119995525262[/C][C]0.140004474737808[/C][/ROW]
[ROW][C]26[/C][C]101.94[/C][C]101.25999303942[/C][C]0.68000696057959[/C][/ROW]
[ROW][C]27[/C][C]102.26[/C][C]101.939966192205[/C][C]0.320033807794999[/C][/ROW]
[ROW][C]28[/C][C]102.51[/C][C]102.259984088931[/C][C]0.250015911068559[/C][/ROW]
[ROW][C]29[/C][C]102.61[/C][C]102.50998757[/C][C]0.100012430000206[/C][/ROW]
[ROW][C]30[/C][C]102.76[/C][C]102.609995027698[/C][C]0.150004972301645[/C][/ROW]
[ROW][C]31[/C][C]103.04[/C][C]102.759992542227[/C][C]0.280007457772697[/C][/ROW]
[ROW][C]32[/C][C]103.22[/C][C]103.039986078915[/C][C]0.180013921085049[/C][/ROW]
[ROW][C]33[/C][C]103.47[/C][C]103.219991050277[/C][C]0.250008949722712[/C][/ROW]
[ROW][C]34[/C][C]103.64[/C][C]103.469987570346[/C][C]0.170012429654122[/C][/ROW]
[ROW][C]35[/C][C]103.76[/C][C]103.63999154752[/C][C]0.120008452480192[/C][/ROW]
[ROW][C]36[/C][C]103.85[/C][C]103.759994033559[/C][C]0.0900059664406285[/C][/ROW]
[ROW][C]37[/C][C]103.98[/C][C]103.849995525188[/C][C]0.13000447481194[/C][/ROW]
[ROW][C]38[/C][C]104.68[/C][C]103.979993536589[/C][C]0.700006463411242[/C][/ROW]
[ROW][C]39[/C][C]105.07[/C][C]104.679965197893[/C][C]0.390034802106996[/C][/ROW]
[ROW][C]40[/C][C]105.19[/C][C]105.069980608703[/C][C]0.120019391296552[/C][/ROW]
[ROW][C]41[/C][C]105.39[/C][C]105.189994033016[/C][C]0.200005966984477[/C][/ROW]
[ROW][C]42[/C][C]105.66[/C][C]105.389990056336[/C][C]0.270009943663993[/C][/ROW]
[ROW][C]43[/C][C]105.76[/C][C]105.65998657596[/C][C]0.10001342404027[/C][/ROW]
[ROW][C]44[/C][C]105.89[/C][C]105.759995027649[/C][C]0.130004972351074[/C][/ROW]
[ROW][C]45[/C][C]106.04[/C][C]105.889993536564[/C][C]0.150006463435986[/C][/ROW]
[ROW][C]46[/C][C]106.37[/C][C]106.039992542153[/C][C]0.330007457846847[/C][/ROW]
[ROW][C]47[/C][C]106.57[/C][C]106.369983593073[/C][C]0.200016406926878[/C][/ROW]
[ROW][C]48[/C][C]106.67[/C][C]106.569990055817[/C][C]0.100009944183043[/C][/ROW]
[ROW][C]49[/C][C]107.08[/C][C]106.669995027822[/C][C]0.410004972178058[/C][/ROW]
[ROW][C]50[/C][C]107.64[/C][C]107.07997961585[/C][C]0.560020384150249[/C][/ROW]
[ROW][C]51[/C][C]108.47[/C][C]107.639972157558[/C][C]0.830027842441979[/C][/ROW]
[ROW][C]52[/C][C]108.7[/C][C]108.469958733641[/C][C]0.230041266358683[/C][/ROW]
[ROW][C]53[/C][C]108.82[/C][C]108.699988563076[/C][C]0.120011436924059[/C][/ROW]
[ROW][C]54[/C][C]108.99[/C][C]108.819994033411[/C][C]0.170005966589002[/C][/ROW]
[ROW][C]55[/C][C]109.18[/C][C]108.989991547841[/C][C]0.190008452158892[/C][/ROW]
[ROW][C]56[/C][C]109.31[/C][C]109.179990553381[/C][C]0.130009446619169[/C][/ROW]
[ROW][C]57[/C][C]109.5[/C][C]109.309993536342[/C][C]0.19000646365842[/C][/ROW]
[ROW][C]58[/C][C]109.7[/C][C]109.49999055348[/C][C]0.200009446520326[/C][/ROW]
[ROW][C]59[/C][C]109.9[/C][C]109.699990056163[/C][C]0.200009943836989[/C][/ROW]
[ROW][C]60[/C][C]110.09[/C][C]109.899990056138[/C][C]0.19000994386171[/C][/ROW]
[ROW][C]61[/C][C]110.47[/C][C]110.089990553307[/C][C]0.380009446693336[/C][/ROW]
[/TABLE]
Source: https://freestatistics.org/blog/index.php?pk=&T=2

Globally Unique Identifier (entire table): ba.freestatistics.org/blog/index.php?pk=&T=2

As an alternative you can also use a QR Code:  

The GUIDs for individual cells are displayed in the table below:

Interpolation Forecasts of Exponential Smoothing
tObservedFittedResiduals
296.496.160.240000000000009
396.8796.39998806795920.470011932040791
49796.86997663249350.130023367506453
597.2696.99999353564950.260006464350525
697.4297.25998707330110.160012926698926
797.6497.41999204466350.220007955336541
897.9397.63998906190040.290010938099584
998.197.92998558157360.170014418426433
1098.2998.09999154742090.190008452579093
1198.4298.28999055338080.130009446619198
1298.4998.41999353634160.0700064636584159
1398.6798.48999651950010.180003480499934
1499.198.66999105079640.430008949203639
1599.3799.09997862131530.270021378684703
1699.5499.36998657539120.170013424608797
1799.5899.53999154747030.040008452529662
1899.7799.57999801090630.190001989093687
19100.0699.76999055370210.290009446297859
20100.26100.0599855816480.200014418352282
21100.57100.2599900559160.310009944084157
22100.94100.5699845872860.370015412713755
23101.03100.9399816040040.0900183959958412
24101.12101.029995524570.0900044754298932
25101.26101.1199955252620.140004474737808
26101.94101.259993039420.68000696057959
27102.26101.9399661922050.320033807794999
28102.51102.2599840889310.250015911068559
29102.61102.509987570.100012430000206
30102.76102.6099950276980.150004972301645
31103.04102.7599925422270.280007457772697
32103.22103.0399860789150.180013921085049
33103.47103.2199910502770.250008949722712
34103.64103.4699875703460.170012429654122
35103.76103.639991547520.120008452480192
36103.85103.7599940335590.0900059664406285
37103.98103.8499955251880.13000447481194
38104.68103.9799935365890.700006463411242
39105.07104.6799651978930.390034802106996
40105.19105.0699806087030.120019391296552
41105.39105.1899940330160.200005966984477
42105.66105.3899900563360.270009943663993
43105.76105.659986575960.10001342404027
44105.89105.7599950276490.130004972351074
45106.04105.8899935365640.150006463435986
46106.37106.0399925421530.330007457846847
47106.57106.3699835930730.200016406926878
48106.67106.5699900558170.100009944183043
49107.08106.6699950278220.410004972178058
50107.64107.079979615850.560020384150249
51108.47107.6399721575580.830027842441979
52108.7108.4699587336410.230041266358683
53108.82108.6999885630760.120011436924059
54108.99108.8199940334110.170005966589002
55109.18108.9899915478410.190008452158892
56109.31109.1799905533810.130009446619169
57109.5109.3099935363420.19000646365842
58109.7109.499990553480.200009446520326
59109.9109.6999900561630.200009943836989
60110.09109.8999900561380.19000994386171
61110.47110.0899905533070.380009446693336


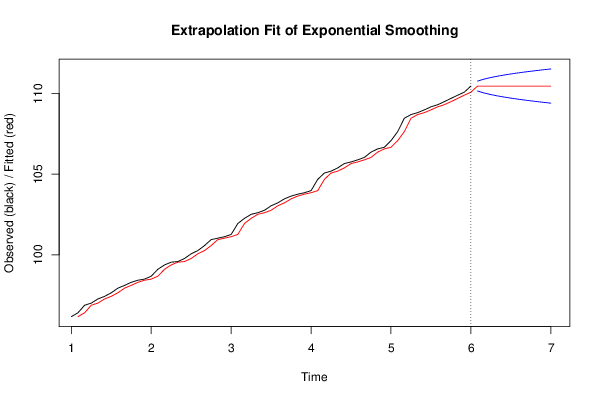
Extrapolation Forecasts of Exponential Smoothing
tForecast95% Lower Bound95% Upper Bound
62110.469981107132110.163761329375110.776200884889
63110.469981107132110.036931709418110.903030504846
64110.469981107132109.939610473112111.000351741153
65110.469981107132109.857564387894111.08239782637
66110.469981107132109.785280101895111.15468211237
67110.469981107132109.719929978779111.220032235486
68110.469981107132109.659834253954111.280127960311
69110.469981107132109.603898459641111.336063754624
70110.469981107132109.551362371826111.388599842439
71110.469981107132109.501672473779111.438289740486
72110.469981107132109.45441090375111.485551310515
73110.469981107132109.409253023895111.53070919037

\begin{tabular}{lllllllll}
\hline
Extrapolation Forecasts of Exponential Smoothing \tabularnewline
t & Forecast & 95% Lower Bound & 95% Upper Bound \tabularnewline
62 & 110.469981107132 & 110.163761329375 & 110.776200884889 \tabularnewline
63 & 110.469981107132 & 110.036931709418 & 110.903030504846 \tabularnewline
64 & 110.469981107132 & 109.939610473112 & 111.000351741153 \tabularnewline
65 & 110.469981107132 & 109.857564387894 & 111.08239782637 \tabularnewline
66 & 110.469981107132 & 109.785280101895 & 111.15468211237 \tabularnewline
67 & 110.469981107132 & 109.719929978779 & 111.220032235486 \tabularnewline
68 & 110.469981107132 & 109.659834253954 & 111.280127960311 \tabularnewline
69 & 110.469981107132 & 109.603898459641 & 111.336063754624 \tabularnewline
70 & 110.469981107132 & 109.551362371826 & 111.388599842439 \tabularnewline
71 & 110.469981107132 & 109.501672473779 & 111.438289740486 \tabularnewline
72 & 110.469981107132 & 109.45441090375 & 111.485551310515 \tabularnewline
73 & 110.469981107132 & 109.409253023895 & 111.53070919037 \tabularnewline
\hline
\end{tabular}
%Source: https://freestatistics.org/blog/index.php?pk=&T=3

[TABLE]
[ROW][C]Extrapolation Forecasts of Exponential Smoothing[/C][/ROW]
[ROW][C]t[/C][C]Forecast[/C][C]95% Lower Bound[/C][C]95% Upper Bound[/C][/ROW]
[ROW][C]62[/C][C]110.469981107132[/C][C]110.163761329375[/C][C]110.776200884889[/C][/ROW]
[ROW][C]63[/C][C]110.469981107132[/C][C]110.036931709418[/C][C]110.903030504846[/C][/ROW]
[ROW][C]64[/C][C]110.469981107132[/C][C]109.939610473112[/C][C]111.000351741153[/C][/ROW]
[ROW][C]65[/C][C]110.469981107132[/C][C]109.857564387894[/C][C]111.08239782637[/C][/ROW]
[ROW][C]66[/C][C]110.469981107132[/C][C]109.785280101895[/C][C]111.15468211237[/C][/ROW]
[ROW][C]67[/C][C]110.469981107132[/C][C]109.719929978779[/C][C]111.220032235486[/C][/ROW]
[ROW][C]68[/C][C]110.469981107132[/C][C]109.659834253954[/C][C]111.280127960311[/C][/ROW]
[ROW][C]69[/C][C]110.469981107132[/C][C]109.603898459641[/C][C]111.336063754624[/C][/ROW]
[ROW][C]70[/C][C]110.469981107132[/C][C]109.551362371826[/C][C]111.388599842439[/C][/ROW]
[ROW][C]71[/C][C]110.469981107132[/C][C]109.501672473779[/C][C]111.438289740486[/C][/ROW]
[ROW][C]72[/C][C]110.469981107132[/C][C]109.45441090375[/C][C]111.485551310515[/C][/ROW]
[ROW][C]73[/C][C]110.469981107132[/C][C]109.409253023895[/C][C]111.53070919037[/C][/ROW]
[/TABLE]
Source: https://freestatistics.org/blog/index.php?pk=&T=3

Globally Unique Identifier (entire table): ba.freestatistics.org/blog/index.php?pk=&T=3

As an alternative you can also use a QR Code:  

The GUIDs for individual cells are displayed in the table below:

Extrapolation Forecasts of Exponential Smoothing
tForecast95% Lower Bound95% Upper Bound
62110.469981107132110.163761329375110.776200884889
63110.469981107132110.036931709418110.903030504846
64110.469981107132109.939610473112111.000351741153
65110.469981107132109.857564387894111.08239782637
66110.469981107132109.785280101895111.15468211237
67110.469981107132109.719929978779111.220032235486
68110.469981107132109.659834253954111.280127960311
69110.469981107132109.603898459641111.336063754624
70110.469981107132109.551362371826111.388599842439
71110.469981107132109.501672473779111.438289740486
72110.469981107132109.45441090375111.485551310515
73110.469981107132109.409253023895111.53070919037


Parameters (Session):
par1 = 12 ; par2 = Single ; par3 = additive ;
Parameters (R input):
par1 = 12 ; par2 = Single ; par3 = additive ;
R code (references can be found in the software module):
par1 <- as.numeric(par1)
if (par2 == 'Single') K <- 1
if (par2 == 'Double') K <- 2
if (par2 == 'Triple') K <- par1
nx <- length(x)
nxmK <- nx - K
x <- ts(x, frequency = par1)
if (par2 == 'Single') fit <- HoltWinters(x, gamma=F, beta=F)
if (par2 == 'Double') fit <- HoltWinters(x, gamma=F)
if (par2 == 'Triple') fit <- HoltWinters(x, seasonal=par3)
fit
myresid <- x - fit$fitted[,'xhat']
bitmap(file='test1.png')
op <- par(mfrow=c(2,1))
plot(fit,ylab='Observed (black) / Fitted (red)',main='Interpolation Fit of Exponential Smoothing')
plot(myresid,ylab='Residuals',main='Interpolation Prediction Errors')
par(op)
dev.off()
bitmap(file='test2.png')
p <- predict(fit, par1, prediction.interval=TRUE)
np <- length(p[,1])
plot(fit,p,ylab='Observed (black) / Fitted (red)',main='Extrapolation Fit of Exponential Smoothing')
dev.off()
bitmap(file='test3.png')
op <- par(mfrow = c(2,2))
acf(as.numeric(myresid),lag.max = nx/2,main='Residual ACF')
spectrum(myresid,main='Residals Periodogram')
cpgram(myresid,main='Residal Cumulative Periodogram')
qqnorm(myresid,main='Residual Normal QQ Plot')
qqline(myresid)
par(op)
dev.off()
load(file='createtable')
a<-table.start()
a<-table.row.start(a)
a<-table.element(a,'Estimated Parameters of Exponential Smoothing',2,TRUE)
a<-table.row.end(a)
a<-table.row.start(a)
a<-table.element(a,'Parameter',header=TRUE)
a<-table.element(a,'Value',header=TRUE)
a<-table.row.end(a)
a<-table.row.start(a)
a<-table.element(a,'alpha',header=TRUE)
a<-table.element(a,fit$alpha)
a<-table.row.end(a)
a<-table.row.start(a)
a<-table.element(a,'beta',header=TRUE)
a<-table.element(a,fit$beta)
a<-table.row.end(a)
a<-table.row.start(a)
a<-table.element(a,'gamma',header=TRUE)
a<-table.element(a,fit$gamma)
a<-table.row.end(a)
a<-table.end(a)
table.save(a,file='mytable.tab')
a<-table.start()
a<-table.row.start(a)
a<-table.element(a,'Interpolation Forecasts of Exponential Smoothing',4,TRUE)
a<-table.row.end(a)
a<-table.row.start(a)
a<-table.element(a,'t',header=TRUE)
a<-table.element(a,'Observed',header=TRUE)
a<-table.element(a,'Fitted',header=TRUE)
a<-table.element(a,'Residuals',header=TRUE)
a<-table.row.end(a)
for (i in 1:nxmK) {
a<-table.row.start(a)
a<-table.element(a,i+K,header=TRUE)
a<-table.element(a,x[i+K])
a<-table.element(a,fit$fitted[i,'xhat'])
a<-table.element(a,myresid[i])
a<-table.row.end(a)
}
a<-table.end(a)
table.save(a,file='mytable1.tab')
a<-table.start()
a<-table.row.start(a)
a<-table.element(a,'Extrapolation Forecasts of Exponential Smoothing',4,TRUE)
a<-table.row.end(a)
a<-table.row.start(a)
a<-table.element(a,'t',header=TRUE)
a<-table.element(a,'Forecast',header=TRUE)
a<-table.element(a,'95% Lower Bound',header=TRUE)
a<-table.element(a,'95% Upper Bound',header=TRUE)
a<-table.row.end(a)
for (i in 1:np) {
a<-table.row.start(a)
a<-table.element(a,nx+i,header=TRUE)
a<-table.element(a,p[i,'fit'])
a<-table.element(a,p[i,'lwr'])
a<-table.element(a,p[i,'upr'])
a<-table.row.end(a)
}
a<-table.end(a)
table.save(a,file='mytable2.tab')