Free Statistics

of Irreproducible Research!

Author's title

Author*Unverified author*
R Software Modulerwasp_autocorrelation.wasp
Title produced by software(Partial) Autocorrelation Function
Date of computationFri, 17 Mar 2017 18:46:58 +0000
Cite this page as followsStatistical Computations at FreeStatistics.org, Office for Research Development and Education, URL https://freestatistics.org/blog/index.php?v=date/2017/Mar/17/t1489776506zu8eyknjcg2lphj.htm/, Retrieved Sat, 18 May 2024 05:13:59 +0200
Statistical Computations at FreeStatistics.org, Office for Research Development and Education, URL https://freestatistics.org/blog/index.php?pk=, Retrieved Sat, 18 May 2024 05:13:59 +0200
QR Codes:

Original text written by user:
IsPrivate?No (this computation is public)
User-defined keywords25-45 jaar
Estimated Impact0
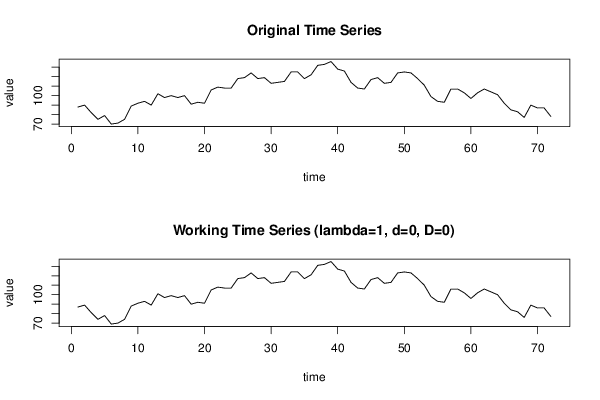
Dataseries X:
88
90
82
75
79
70
71
75
89
92
94
90
102
98
100
98
100
91
93
92
106
109
108
108
118
119
124
118
119
113
114
115
125
125
118
122
132
133
136
128
126
114
108
107
117
119
113
114
124
125
124
118
111
99
94
93
107
107
103
97
103
107
104
101
92
85
83
77
90
87
87
78


Summary of computational transaction
Raw Inputview raw input (R code)
Raw Outputview raw output of R engine
Computing time2 seconds
R Server'Gwilym Jenkins' @ jenkins.wessa.net

\begin{tabular}{lllllllll}
\hline
Summary of computational transaction \tabularnewline
Raw Input & view raw input (R code)  \tabularnewline
Raw Output & view raw output of R engine  \tabularnewline
Computing time & 2 seconds \tabularnewline
R Server & 'Gwilym Jenkins' @ jenkins.wessa.net \tabularnewline
\hline
\end{tabular}
%Source: https://freestatistics.org/blog/index.php?pk=&T=0

[TABLE]
[ROW][C]Summary of computational transaction[/C][/ROW]
[ROW][C]Raw Input[/C][C]view raw input (R code) [/C][/ROW]
[ROW][C]Raw Output[/C][C]view raw output of R engine [/C][/ROW]
[ROW][C]Computing time[/C][C]2 seconds[/C][/ROW]
[ROW][C]R Server[/C][C]'Gwilym Jenkins' @ jenkins.wessa.net[/C][/ROW]
[/TABLE]
Source: https://freestatistics.org/blog/index.php?pk=&T=0

Globally Unique Identifier (entire table): ba.freestatistics.org/blog/index.php?pk=&T=0

As an alternative you can also use a QR Code:  

The GUIDs for individual cells are displayed in the table below:

Summary of computational transaction
Raw Inputview raw input (R code)
Raw Outputview raw output of R engine
Computing time2 seconds
R Server'Gwilym Jenkins' @ jenkins.wessa.net


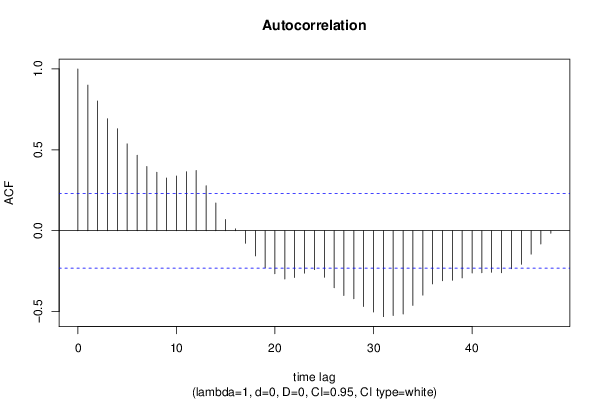
Autocorrelation Function
Time lag kACF(k)T-STATP-value
10.9001527.6380
20.8014966.80090
30.6920625.87230
40.6299115.3451e-06
50.5371544.55791e-05
60.4669993.96268.6e-05
70.3969163.36790.000609
80.3611973.06490.001532
90.32572.76370.003626
100.3379012.86720.002714
110.3650073.09720.001392
120.3724643.16050.001152
130.2782392.36090.010469
140.1711851.45260.075346
150.0697340.59170.277949
160.0117650.09980.46038
17-0.077514-0.65770.256406
18-0.155629-1.32060.095415
19-0.228783-1.94130.028069
20-0.265472-2.25260.013666
21-0.29835-2.53160.006769
22-0.288757-2.45020.008355
23-0.261949-2.22270.014688
24-0.240379-2.03970.022526
25-0.287516-2.43970.008583
26-0.352183-2.98840.001917
27-0.40028-3.39650.000557
28-0.420366-3.56690.000323
29-0.468172-3.97268.3e-05
30-0.502381-4.26283e-05
31-0.531103-4.50661.2e-05
32-0.523646-4.44331.6e-05
33-0.514272-4.36372.1e-05
34-0.461421-3.91530.000102
35-0.398068-3.37770.000591
36-0.328449-2.7870.003399
37-0.308746-2.61980.005362
38-0.306174-2.5980.005683
39-0.291587-2.47420.007856
40-0.261428-2.21830.014845
41-0.259482-2.20180.015443
42-0.257183-2.18230.016177
43-0.260267-2.20840.015199
44-0.235062-1.99460.024938
45-0.20775-1.76280.041087
46-0.144677-1.22760.111793
47-0.082166-0.69720.243961
48-0.015928-0.13520.446434

\begin{tabular}{lllllllll}
\hline
Autocorrelation Function \tabularnewline
Time lag k & ACF(k) & T-STAT & P-value \tabularnewline
1 & 0.900152 & 7.638 & 0 \tabularnewline
2 & 0.801496 & 6.8009 & 0 \tabularnewline
3 & 0.692062 & 5.8723 & 0 \tabularnewline
4 & 0.629911 & 5.345 & 1e-06 \tabularnewline
5 & 0.537154 & 4.5579 & 1e-05 \tabularnewline
6 & 0.466999 & 3.9626 & 8.6e-05 \tabularnewline
7 & 0.396916 & 3.3679 & 0.000609 \tabularnewline
8 & 0.361197 & 3.0649 & 0.001532 \tabularnewline
9 & 0.3257 & 2.7637 & 0.003626 \tabularnewline
10 & 0.337901 & 2.8672 & 0.002714 \tabularnewline
11 & 0.365007 & 3.0972 & 0.001392 \tabularnewline
12 & 0.372464 & 3.1605 & 0.001152 \tabularnewline
13 & 0.278239 & 2.3609 & 0.010469 \tabularnewline
14 & 0.171185 & 1.4526 & 0.075346 \tabularnewline
15 & 0.069734 & 0.5917 & 0.277949 \tabularnewline
16 & 0.011765 & 0.0998 & 0.46038 \tabularnewline
17 & -0.077514 & -0.6577 & 0.256406 \tabularnewline
18 & -0.155629 & -1.3206 & 0.095415 \tabularnewline
19 & -0.228783 & -1.9413 & 0.028069 \tabularnewline
20 & -0.265472 & -2.2526 & 0.013666 \tabularnewline
21 & -0.29835 & -2.5316 & 0.006769 \tabularnewline
22 & -0.288757 & -2.4502 & 0.008355 \tabularnewline
23 & -0.261949 & -2.2227 & 0.014688 \tabularnewline
24 & -0.240379 & -2.0397 & 0.022526 \tabularnewline
25 & -0.287516 & -2.4397 & 0.008583 \tabularnewline
26 & -0.352183 & -2.9884 & 0.001917 \tabularnewline
27 & -0.40028 & -3.3965 & 0.000557 \tabularnewline
28 & -0.420366 & -3.5669 & 0.000323 \tabularnewline
29 & -0.468172 & -3.9726 & 8.3e-05 \tabularnewline
30 & -0.502381 & -4.2628 & 3e-05 \tabularnewline
31 & -0.531103 & -4.5066 & 1.2e-05 \tabularnewline
32 & -0.523646 & -4.4433 & 1.6e-05 \tabularnewline
33 & -0.514272 & -4.3637 & 2.1e-05 \tabularnewline
34 & -0.461421 & -3.9153 & 0.000102 \tabularnewline
35 & -0.398068 & -3.3777 & 0.000591 \tabularnewline
36 & -0.328449 & -2.787 & 0.003399 \tabularnewline
37 & -0.308746 & -2.6198 & 0.005362 \tabularnewline
38 & -0.306174 & -2.598 & 0.005683 \tabularnewline
39 & -0.291587 & -2.4742 & 0.007856 \tabularnewline
40 & -0.261428 & -2.2183 & 0.014845 \tabularnewline
41 & -0.259482 & -2.2018 & 0.015443 \tabularnewline
42 & -0.257183 & -2.1823 & 0.016177 \tabularnewline
43 & -0.260267 & -2.2084 & 0.015199 \tabularnewline
44 & -0.235062 & -1.9946 & 0.024938 \tabularnewline
45 & -0.20775 & -1.7628 & 0.041087 \tabularnewline
46 & -0.144677 & -1.2276 & 0.111793 \tabularnewline
47 & -0.082166 & -0.6972 & 0.243961 \tabularnewline
48 & -0.015928 & -0.1352 & 0.446434 \tabularnewline
\hline
\end{tabular}
%Source: https://freestatistics.org/blog/index.php?pk=&T=1

[TABLE]
[ROW][C]Autocorrelation Function[/C][/ROW]
[ROW][C]Time lag k[/C][C]ACF(k)[/C][C]T-STAT[/C][C]P-value[/C][/ROW]
[ROW][C]1[/C][C]0.900152[/C][C]7.638[/C][C]0[/C][/ROW]
[ROW][C]2[/C][C]0.801496[/C][C]6.8009[/C][C]0[/C][/ROW]
[ROW][C]3[/C][C]0.692062[/C][C]5.8723[/C][C]0[/C][/ROW]
[ROW][C]4[/C][C]0.629911[/C][C]5.345[/C][C]1e-06[/C][/ROW]
[ROW][C]5[/C][C]0.537154[/C][C]4.5579[/C][C]1e-05[/C][/ROW]
[ROW][C]6[/C][C]0.466999[/C][C]3.9626[/C][C]8.6e-05[/C][/ROW]
[ROW][C]7[/C][C]0.396916[/C][C]3.3679[/C][C]0.000609[/C][/ROW]
[ROW][C]8[/C][C]0.361197[/C][C]3.0649[/C][C]0.001532[/C][/ROW]
[ROW][C]9[/C][C]0.3257[/C][C]2.7637[/C][C]0.003626[/C][/ROW]
[ROW][C]10[/C][C]0.337901[/C][C]2.8672[/C][C]0.002714[/C][/ROW]
[ROW][C]11[/C][C]0.365007[/C][C]3.0972[/C][C]0.001392[/C][/ROW]
[ROW][C]12[/C][C]0.372464[/C][C]3.1605[/C][C]0.001152[/C][/ROW]
[ROW][C]13[/C][C]0.278239[/C][C]2.3609[/C][C]0.010469[/C][/ROW]
[ROW][C]14[/C][C]0.171185[/C][C]1.4526[/C][C]0.075346[/C][/ROW]
[ROW][C]15[/C][C]0.069734[/C][C]0.5917[/C][C]0.277949[/C][/ROW]
[ROW][C]16[/C][C]0.011765[/C][C]0.0998[/C][C]0.46038[/C][/ROW]
[ROW][C]17[/C][C]-0.077514[/C][C]-0.6577[/C][C]0.256406[/C][/ROW]
[ROW][C]18[/C][C]-0.155629[/C][C]-1.3206[/C][C]0.095415[/C][/ROW]
[ROW][C]19[/C][C]-0.228783[/C][C]-1.9413[/C][C]0.028069[/C][/ROW]
[ROW][C]20[/C][C]-0.265472[/C][C]-2.2526[/C][C]0.013666[/C][/ROW]
[ROW][C]21[/C][C]-0.29835[/C][C]-2.5316[/C][C]0.006769[/C][/ROW]
[ROW][C]22[/C][C]-0.288757[/C][C]-2.4502[/C][C]0.008355[/C][/ROW]
[ROW][C]23[/C][C]-0.261949[/C][C]-2.2227[/C][C]0.014688[/C][/ROW]
[ROW][C]24[/C][C]-0.240379[/C][C]-2.0397[/C][C]0.022526[/C][/ROW]
[ROW][C]25[/C][C]-0.287516[/C][C]-2.4397[/C][C]0.008583[/C][/ROW]
[ROW][C]26[/C][C]-0.352183[/C][C]-2.9884[/C][C]0.001917[/C][/ROW]
[ROW][C]27[/C][C]-0.40028[/C][C]-3.3965[/C][C]0.000557[/C][/ROW]
[ROW][C]28[/C][C]-0.420366[/C][C]-3.5669[/C][C]0.000323[/C][/ROW]
[ROW][C]29[/C][C]-0.468172[/C][C]-3.9726[/C][C]8.3e-05[/C][/ROW]
[ROW][C]30[/C][C]-0.502381[/C][C]-4.2628[/C][C]3e-05[/C][/ROW]
[ROW][C]31[/C][C]-0.531103[/C][C]-4.5066[/C][C]1.2e-05[/C][/ROW]
[ROW][C]32[/C][C]-0.523646[/C][C]-4.4433[/C][C]1.6e-05[/C][/ROW]
[ROW][C]33[/C][C]-0.514272[/C][C]-4.3637[/C][C]2.1e-05[/C][/ROW]
[ROW][C]34[/C][C]-0.461421[/C][C]-3.9153[/C][C]0.000102[/C][/ROW]
[ROW][C]35[/C][C]-0.398068[/C][C]-3.3777[/C][C]0.000591[/C][/ROW]
[ROW][C]36[/C][C]-0.328449[/C][C]-2.787[/C][C]0.003399[/C][/ROW]
[ROW][C]37[/C][C]-0.308746[/C][C]-2.6198[/C][C]0.005362[/C][/ROW]
[ROW][C]38[/C][C]-0.306174[/C][C]-2.598[/C][C]0.005683[/C][/ROW]
[ROW][C]39[/C][C]-0.291587[/C][C]-2.4742[/C][C]0.007856[/C][/ROW]
[ROW][C]40[/C][C]-0.261428[/C][C]-2.2183[/C][C]0.014845[/C][/ROW]
[ROW][C]41[/C][C]-0.259482[/C][C]-2.2018[/C][C]0.015443[/C][/ROW]
[ROW][C]42[/C][C]-0.257183[/C][C]-2.1823[/C][C]0.016177[/C][/ROW]
[ROW][C]43[/C][C]-0.260267[/C][C]-2.2084[/C][C]0.015199[/C][/ROW]
[ROW][C]44[/C][C]-0.235062[/C][C]-1.9946[/C][C]0.024938[/C][/ROW]
[ROW][C]45[/C][C]-0.20775[/C][C]-1.7628[/C][C]0.041087[/C][/ROW]
[ROW][C]46[/C][C]-0.144677[/C][C]-1.2276[/C][C]0.111793[/C][/ROW]
[ROW][C]47[/C][C]-0.082166[/C][C]-0.6972[/C][C]0.243961[/C][/ROW]
[ROW][C]48[/C][C]-0.015928[/C][C]-0.1352[/C][C]0.446434[/C][/ROW]
[/TABLE]
Source: https://freestatistics.org/blog/index.php?pk=&T=1

Globally Unique Identifier (entire table): ba.freestatistics.org/blog/index.php?pk=&T=1

As an alternative you can also use a QR Code:  

The GUIDs for individual cells are displayed in the table below:

Autocorrelation Function
Time lag kACF(k)T-STATP-value
10.9001527.6380
20.8014966.80090
30.6920625.87230
40.6299115.3451e-06
50.5371544.55791e-05
60.4669993.96268.6e-05
70.3969163.36790.000609
80.3611973.06490.001532
90.32572.76370.003626
100.3379012.86720.002714
110.3650073.09720.001392
120.3724643.16050.001152
130.2782392.36090.010469
140.1711851.45260.075346
150.0697340.59170.277949
160.0117650.09980.46038
17-0.077514-0.65770.256406
18-0.155629-1.32060.095415
19-0.228783-1.94130.028069
20-0.265472-2.25260.013666
21-0.29835-2.53160.006769
22-0.288757-2.45020.008355
23-0.261949-2.22270.014688
24-0.240379-2.03970.022526
25-0.287516-2.43970.008583
26-0.352183-2.98840.001917
27-0.40028-3.39650.000557
28-0.420366-3.56690.000323
29-0.468172-3.97268.3e-05
30-0.502381-4.26283e-05
31-0.531103-4.50661.2e-05
32-0.523646-4.44331.6e-05
33-0.514272-4.36372.1e-05
34-0.461421-3.91530.000102
35-0.398068-3.37770.000591
36-0.328449-2.7870.003399
37-0.308746-2.61980.005362
38-0.306174-2.5980.005683
39-0.291587-2.47420.007856
40-0.261428-2.21830.014845
41-0.259482-2.20180.015443
42-0.257183-2.18230.016177
43-0.260267-2.20840.015199
44-0.235062-1.99460.024938
45-0.20775-1.76280.041087
46-0.144677-1.22760.111793
47-0.082166-0.69720.243961
48-0.015928-0.13520.446434


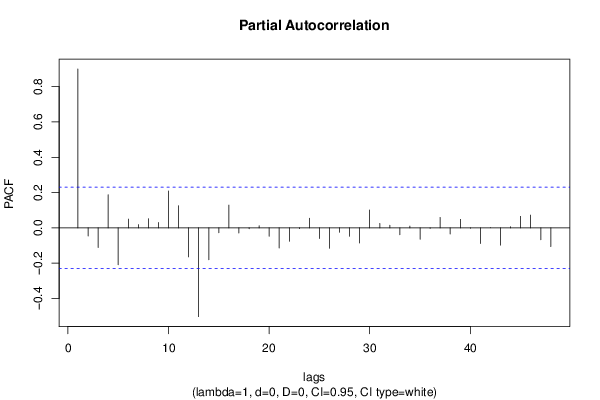
Partial Autocorrelation Function
Time lag kPACF(k)T-STATP-value
10.9001527.6380
2-0.046265-0.39260.347898
3-0.111658-0.94740.17329
40.1872591.58890.058227
5-0.208586-1.76990.040488
60.049680.42150.337306
70.0186580.15830.437326
80.0520940.4420.329894
90.0302110.25630.399208
100.2088891.77250.040272
110.1252511.06280.145715
12-0.164207-1.39330.083901
13-0.502703-4.26563e-05
14-0.180822-1.53430.064666
15-0.027743-0.23540.407279
160.1288961.09370.138862
17-0.029237-0.24810.402388
18-0.005366-0.04550.481905
190.0125680.10660.457685
20-0.046929-0.39820.345829
21-0.113702-0.96480.168939
22-0.075661-0.6420.261454
23-0.004167-0.03540.485946
240.0546210.46350.32221
25-0.060271-0.51140.305311
26-0.114953-0.97540.166313
27-0.025101-0.2130.41597
28-0.047829-0.40580.343032
29-0.08548-0.72530.235303
300.1010040.8570.197131
310.0254220.21570.414912
320.0146830.12460.450598
33-0.038758-0.32890.371604
340.0101840.08640.465688
35-0.063946-0.54260.294541
36-0.002712-0.0230.490853
370.0593870.50390.307931
38-0.034507-0.29280.385258
390.048320.410.34151
40-0.002368-0.02010.492012
41-0.0883-0.74920.228075
42-0.000453-0.00380.498471
43-0.097752-0.82950.204794
440.0069110.05860.476698
450.0652090.55330.29088
460.0724340.61460.270372
47-0.067361-0.57160.284693
48-0.105992-0.89940.185727

\begin{tabular}{lllllllll}
\hline
Partial Autocorrelation Function \tabularnewline
Time lag k & PACF(k) & T-STAT & P-value \tabularnewline
1 & 0.900152 & 7.638 & 0 \tabularnewline
2 & -0.046265 & -0.3926 & 0.347898 \tabularnewline
3 & -0.111658 & -0.9474 & 0.17329 \tabularnewline
4 & 0.187259 & 1.5889 & 0.058227 \tabularnewline
5 & -0.208586 & -1.7699 & 0.040488 \tabularnewline
6 & 0.04968 & 0.4215 & 0.337306 \tabularnewline
7 & 0.018658 & 0.1583 & 0.437326 \tabularnewline
8 & 0.052094 & 0.442 & 0.329894 \tabularnewline
9 & 0.030211 & 0.2563 & 0.399208 \tabularnewline
10 & 0.208889 & 1.7725 & 0.040272 \tabularnewline
11 & 0.125251 & 1.0628 & 0.145715 \tabularnewline
12 & -0.164207 & -1.3933 & 0.083901 \tabularnewline
13 & -0.502703 & -4.2656 & 3e-05 \tabularnewline
14 & -0.180822 & -1.5343 & 0.064666 \tabularnewline
15 & -0.027743 & -0.2354 & 0.407279 \tabularnewline
16 & 0.128896 & 1.0937 & 0.138862 \tabularnewline
17 & -0.029237 & -0.2481 & 0.402388 \tabularnewline
18 & -0.005366 & -0.0455 & 0.481905 \tabularnewline
19 & 0.012568 & 0.1066 & 0.457685 \tabularnewline
20 & -0.046929 & -0.3982 & 0.345829 \tabularnewline
21 & -0.113702 & -0.9648 & 0.168939 \tabularnewline
22 & -0.075661 & -0.642 & 0.261454 \tabularnewline
23 & -0.004167 & -0.0354 & 0.485946 \tabularnewline
24 & 0.054621 & 0.4635 & 0.32221 \tabularnewline
25 & -0.060271 & -0.5114 & 0.305311 \tabularnewline
26 & -0.114953 & -0.9754 & 0.166313 \tabularnewline
27 & -0.025101 & -0.213 & 0.41597 \tabularnewline
28 & -0.047829 & -0.4058 & 0.343032 \tabularnewline
29 & -0.08548 & -0.7253 & 0.235303 \tabularnewline
30 & 0.101004 & 0.857 & 0.197131 \tabularnewline
31 & 0.025422 & 0.2157 & 0.414912 \tabularnewline
32 & 0.014683 & 0.1246 & 0.450598 \tabularnewline
33 & -0.038758 & -0.3289 & 0.371604 \tabularnewline
34 & 0.010184 & 0.0864 & 0.465688 \tabularnewline
35 & -0.063946 & -0.5426 & 0.294541 \tabularnewline
36 & -0.002712 & -0.023 & 0.490853 \tabularnewline
37 & 0.059387 & 0.5039 & 0.307931 \tabularnewline
38 & -0.034507 & -0.2928 & 0.385258 \tabularnewline
39 & 0.04832 & 0.41 & 0.34151 \tabularnewline
40 & -0.002368 & -0.0201 & 0.492012 \tabularnewline
41 & -0.0883 & -0.7492 & 0.228075 \tabularnewline
42 & -0.000453 & -0.0038 & 0.498471 \tabularnewline
43 & -0.097752 & -0.8295 & 0.204794 \tabularnewline
44 & 0.006911 & 0.0586 & 0.476698 \tabularnewline
45 & 0.065209 & 0.5533 & 0.29088 \tabularnewline
46 & 0.072434 & 0.6146 & 0.270372 \tabularnewline
47 & -0.067361 & -0.5716 & 0.284693 \tabularnewline
48 & -0.105992 & -0.8994 & 0.185727 \tabularnewline
\hline
\end{tabular}
%Source: https://freestatistics.org/blog/index.php?pk=&T=2

[TABLE]
[ROW][C]Partial Autocorrelation Function[/C][/ROW]
[ROW][C]Time lag k[/C][C]PACF(k)[/C][C]T-STAT[/C][C]P-value[/C][/ROW]
[ROW][C]1[/C][C]0.900152[/C][C]7.638[/C][C]0[/C][/ROW]
[ROW][C]2[/C][C]-0.046265[/C][C]-0.3926[/C][C]0.347898[/C][/ROW]
[ROW][C]3[/C][C]-0.111658[/C][C]-0.9474[/C][C]0.17329[/C][/ROW]
[ROW][C]4[/C][C]0.187259[/C][C]1.5889[/C][C]0.058227[/C][/ROW]
[ROW][C]5[/C][C]-0.208586[/C][C]-1.7699[/C][C]0.040488[/C][/ROW]
[ROW][C]6[/C][C]0.04968[/C][C]0.4215[/C][C]0.337306[/C][/ROW]
[ROW][C]7[/C][C]0.018658[/C][C]0.1583[/C][C]0.437326[/C][/ROW]
[ROW][C]8[/C][C]0.052094[/C][C]0.442[/C][C]0.329894[/C][/ROW]
[ROW][C]9[/C][C]0.030211[/C][C]0.2563[/C][C]0.399208[/C][/ROW]
[ROW][C]10[/C][C]0.208889[/C][C]1.7725[/C][C]0.040272[/C][/ROW]
[ROW][C]11[/C][C]0.125251[/C][C]1.0628[/C][C]0.145715[/C][/ROW]
[ROW][C]12[/C][C]-0.164207[/C][C]-1.3933[/C][C]0.083901[/C][/ROW]
[ROW][C]13[/C][C]-0.502703[/C][C]-4.2656[/C][C]3e-05[/C][/ROW]
[ROW][C]14[/C][C]-0.180822[/C][C]-1.5343[/C][C]0.064666[/C][/ROW]
[ROW][C]15[/C][C]-0.027743[/C][C]-0.2354[/C][C]0.407279[/C][/ROW]
[ROW][C]16[/C][C]0.128896[/C][C]1.0937[/C][C]0.138862[/C][/ROW]
[ROW][C]17[/C][C]-0.029237[/C][C]-0.2481[/C][C]0.402388[/C][/ROW]
[ROW][C]18[/C][C]-0.005366[/C][C]-0.0455[/C][C]0.481905[/C][/ROW]
[ROW][C]19[/C][C]0.012568[/C][C]0.1066[/C][C]0.457685[/C][/ROW]
[ROW][C]20[/C][C]-0.046929[/C][C]-0.3982[/C][C]0.345829[/C][/ROW]
[ROW][C]21[/C][C]-0.113702[/C][C]-0.9648[/C][C]0.168939[/C][/ROW]
[ROW][C]22[/C][C]-0.075661[/C][C]-0.642[/C][C]0.261454[/C][/ROW]
[ROW][C]23[/C][C]-0.004167[/C][C]-0.0354[/C][C]0.485946[/C][/ROW]
[ROW][C]24[/C][C]0.054621[/C][C]0.4635[/C][C]0.32221[/C][/ROW]
[ROW][C]25[/C][C]-0.060271[/C][C]-0.5114[/C][C]0.305311[/C][/ROW]
[ROW][C]26[/C][C]-0.114953[/C][C]-0.9754[/C][C]0.166313[/C][/ROW]
[ROW][C]27[/C][C]-0.025101[/C][C]-0.213[/C][C]0.41597[/C][/ROW]
[ROW][C]28[/C][C]-0.047829[/C][C]-0.4058[/C][C]0.343032[/C][/ROW]
[ROW][C]29[/C][C]-0.08548[/C][C]-0.7253[/C][C]0.235303[/C][/ROW]
[ROW][C]30[/C][C]0.101004[/C][C]0.857[/C][C]0.197131[/C][/ROW]
[ROW][C]31[/C][C]0.025422[/C][C]0.2157[/C][C]0.414912[/C][/ROW]
[ROW][C]32[/C][C]0.014683[/C][C]0.1246[/C][C]0.450598[/C][/ROW]
[ROW][C]33[/C][C]-0.038758[/C][C]-0.3289[/C][C]0.371604[/C][/ROW]
[ROW][C]34[/C][C]0.010184[/C][C]0.0864[/C][C]0.465688[/C][/ROW]
[ROW][C]35[/C][C]-0.063946[/C][C]-0.5426[/C][C]0.294541[/C][/ROW]
[ROW][C]36[/C][C]-0.002712[/C][C]-0.023[/C][C]0.490853[/C][/ROW]
[ROW][C]37[/C][C]0.059387[/C][C]0.5039[/C][C]0.307931[/C][/ROW]
[ROW][C]38[/C][C]-0.034507[/C][C]-0.2928[/C][C]0.385258[/C][/ROW]
[ROW][C]39[/C][C]0.04832[/C][C]0.41[/C][C]0.34151[/C][/ROW]
[ROW][C]40[/C][C]-0.002368[/C][C]-0.0201[/C][C]0.492012[/C][/ROW]
[ROW][C]41[/C][C]-0.0883[/C][C]-0.7492[/C][C]0.228075[/C][/ROW]
[ROW][C]42[/C][C]-0.000453[/C][C]-0.0038[/C][C]0.498471[/C][/ROW]
[ROW][C]43[/C][C]-0.097752[/C][C]-0.8295[/C][C]0.204794[/C][/ROW]
[ROW][C]44[/C][C]0.006911[/C][C]0.0586[/C][C]0.476698[/C][/ROW]
[ROW][C]45[/C][C]0.065209[/C][C]0.5533[/C][C]0.29088[/C][/ROW]
[ROW][C]46[/C][C]0.072434[/C][C]0.6146[/C][C]0.270372[/C][/ROW]
[ROW][C]47[/C][C]-0.067361[/C][C]-0.5716[/C][C]0.284693[/C][/ROW]
[ROW][C]48[/C][C]-0.105992[/C][C]-0.8994[/C][C]0.185727[/C][/ROW]
[/TABLE]
Source: https://freestatistics.org/blog/index.php?pk=&T=2

Globally Unique Identifier (entire table): ba.freestatistics.org/blog/index.php?pk=&T=2

As an alternative you can also use a QR Code:  

The GUIDs for individual cells are displayed in the table below:

Partial Autocorrelation Function
Time lag kPACF(k)T-STATP-value
10.9001527.6380
2-0.046265-0.39260.347898
3-0.111658-0.94740.17329
40.1872591.58890.058227
5-0.208586-1.76990.040488
60.049680.42150.337306
70.0186580.15830.437326
80.0520940.4420.329894
90.0302110.25630.399208
100.2088891.77250.040272
110.1252511.06280.145715
12-0.164207-1.39330.083901
13-0.502703-4.26563e-05
14-0.180822-1.53430.064666
15-0.027743-0.23540.407279
160.1288961.09370.138862
17-0.029237-0.24810.402388
18-0.005366-0.04550.481905
190.0125680.10660.457685
20-0.046929-0.39820.345829
21-0.113702-0.96480.168939
22-0.075661-0.6420.261454
23-0.004167-0.03540.485946
240.0546210.46350.32221
25-0.060271-0.51140.305311
26-0.114953-0.97540.166313
27-0.025101-0.2130.41597
28-0.047829-0.40580.343032
29-0.08548-0.72530.235303
300.1010040.8570.197131
310.0254220.21570.414912
320.0146830.12460.450598
33-0.038758-0.32890.371604
340.0101840.08640.465688
35-0.063946-0.54260.294541
36-0.002712-0.0230.490853
370.0593870.50390.307931
38-0.034507-0.29280.385258
390.048320.410.34151
40-0.002368-0.02010.492012
41-0.0883-0.74920.228075
42-0.000453-0.00380.498471
43-0.097752-0.82950.204794
440.0069110.05860.476698
450.0652090.55330.29088
460.0724340.61460.270372
47-0.067361-0.57160.284693
48-0.105992-0.89940.185727


Parameters (Session):
par1 = 48 ; par2 = 1 ; par3 = 0 ; par4 = 0 ; par5 = 12 ; par6 = White Noise ; par7 = 0.95 ;
Parameters (R input):
par1 = 48 ; par2 = 1 ; par3 = 0 ; par4 = 0 ; par5 = 12 ; par6 = White Noise ; par7 = 0.95 ; par8 = ;
R code (references can be found in the software module):
if (par1 == 'Default') {
par1 = 10*log10(length(x))
} else {
par1 <- as.numeric(par1)
}
par2 <- as.numeric(par2)
par3 <- as.numeric(par3)
par4 <- as.numeric(par4)
par5 <- as.numeric(par5)
if (par6 == 'White Noise') par6 <- 'white' else par6 <- 'ma'
par7 <- as.numeric(par7)
if (par8 != '') par8 <- as.numeric(par8)
x <- na.omit(x)
ox <- x
if (par8 == '') {
if (par2 == 0) {
x <- log(x)
} else {
x <- (x ^ par2 - 1) / par2
}
} else {
x <- log(x,base=par8)
}
if (par3 > 0) x <- diff(x,lag=1,difference=par3)
if (par4 > 0) x <- diff(x,lag=par5,difference=par4)
bitmap(file='picts.png')
op <- par(mfrow=c(2,1))
plot(ox,type='l',main='Original Time Series',xlab='time',ylab='value')
if (par8=='') {
mytitle <- paste('Working Time Series (lambda=',par2,', d=',par3,', D=',par4,')',sep='')
mysub <- paste('(lambda=',par2,', d=',par3,', D=',par4,', CI=', par7, ', CI type=',par6,')',sep='')
} else {
mytitle <- paste('Working Time Series (base=',par8,', d=',par3,', D=',par4,')',sep='')
mysub <- paste('(base=',par8,', d=',par3,', D=',par4,', CI=', par7, ', CI type=',par6,')',sep='')
}
plot(x,type='l', main=mytitle,xlab='time',ylab='value')
par(op)
dev.off()
bitmap(file='pic1.png')
racf <- acf(x, par1, main='Autocorrelation', xlab='time lag', ylab='ACF', ci.type=par6, ci=par7, sub=mysub)
dev.off()
bitmap(file='pic2.png')
rpacf <- pacf(x,par1,main='Partial Autocorrelation',xlab='lags',ylab='PACF',sub=mysub)
dev.off()
(myacf <- c(racf$acf))
(mypacf <- c(rpacf$acf))
lengthx <- length(x)
sqrtn <- sqrt(lengthx)
load(file='createtable')
a<-table.start()
a<-table.row.start(a)
a<-table.element(a,'Autocorrelation Function',4,TRUE)
a<-table.row.end(a)
a<-table.row.start(a)
a<-table.element(a,'Time lag k',header=TRUE)
a<-table.element(a,hyperlink('basics.htm','ACF(k)','click here for more information about the Autocorrelation Function'),header=TRUE)
a<-table.element(a,'T-STAT',header=TRUE)
a<-table.element(a,'P-value',header=TRUE)
a<-table.row.end(a)
for (i in 2:(par1+1)) {
a<-table.row.start(a)
a<-table.element(a,i-1,header=TRUE)
a<-table.element(a,round(myacf[i],6))
mytstat <- myacf[i]*sqrtn
a<-table.element(a,round(mytstat,4))
a<-table.element(a,round(1-pt(abs(mytstat),lengthx),6))
a<-table.row.end(a)
}
a<-table.end(a)
table.save(a,file='mytable.tab')
a<-table.start()
a<-table.row.start(a)
a<-table.element(a,'Partial Autocorrelation Function',4,TRUE)
a<-table.row.end(a)
a<-table.row.start(a)
a<-table.element(a,'Time lag k',header=TRUE)
a<-table.element(a,hyperlink('basics.htm','PACF(k)','click here for more information about the Partial Autocorrelation Function'),header=TRUE)
a<-table.element(a,'T-STAT',header=TRUE)
a<-table.element(a,'P-value',header=TRUE)
a<-table.row.end(a)
for (i in 1:par1) {
a<-table.row.start(a)
a<-table.element(a,i,header=TRUE)
a<-table.element(a,round(mypacf[i],6))
mytstat <- mypacf[i]*sqrtn
a<-table.element(a,round(mytstat,4))
a<-table.element(a,round(1-pt(abs(mytstat),lengthx),6))
a<-table.row.end(a)
}
a<-table.end(a)
table.save(a,file='mytable1.tab')