Free Statistics

of Irreproducible Research!

Author's title

Author*Unverified author*
R Software Modulerwasp_harrell_davis.wasp
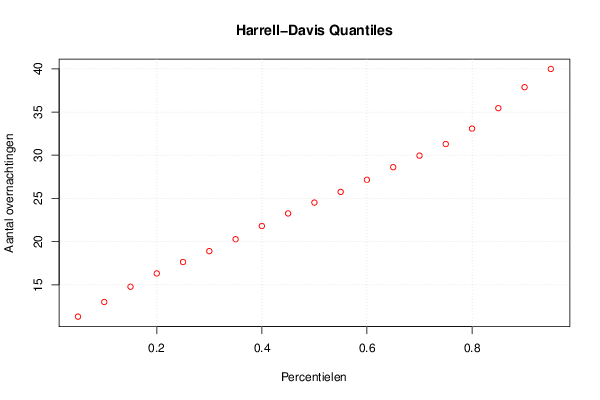
Title produced by softwareHarrell-Davis Quantiles
Date of computationFri, 03 Mar 2017 10:25:35 +0000
Cite this page as followsStatistical Computations at FreeStatistics.org, Office for Research Development and Education, URL https://freestatistics.org/blog/index.php?v=date/2017/Mar/03/t14885367814fkmf9g030bjw65.htm/, Retrieved Fri, 17 May 2024 22:39:24 +0200
Statistical Computations at FreeStatistics.org, Office for Research Development and Education, URL https://freestatistics.org/blog/index.php?pk=, Retrieved Fri, 17 May 2024 22:39:24 +0200
QR Codes:

Original text written by user:
IsPrivate?No (this computation is public)
User-defined keywords
Estimated Impact0
Dataseries X:
11
13
15
29
31
22
36
39
30
20
18
13
11
16
20
29
31
24
40
41
25
19
19
18
10
17
25
30
32
24
38
36
26
25
26
16
12
15
21
33
32
24
41
38
28
24
30
18


Summary of computational transaction
Raw Inputview raw input (R code)
Raw Outputview raw output of R engine
Computing time1 seconds
R Server'George Udny Yule' @ yule.wessa.net

\begin{tabular}{lllllllll}
\hline
Summary of computational transaction \tabularnewline
Raw Input & view raw input (R code)  \tabularnewline
Raw Output & view raw output of R engine  \tabularnewline
Computing time & 1 seconds \tabularnewline
R Server & 'George Udny Yule' @ yule.wessa.net \tabularnewline
\hline
\end{tabular}
%Source: https://freestatistics.org/blog/index.php?pk=&T=0

[TABLE]
[ROW][C]Summary of computational transaction[/C][/ROW]
[ROW][C]Raw Input[/C][C]view raw input (R code) [/C][/ROW]
[ROW][C]Raw Output[/C][C]view raw output of R engine [/C][/ROW]
[ROW][C]Computing time[/C][C]1 seconds[/C][/ROW]
[ROW][C]R Server[/C][C]'George Udny Yule' @ yule.wessa.net[/C][/ROW]
[/TABLE]
Source: https://freestatistics.org/blog/index.php?pk=&T=0

Globally Unique Identifier (entire table): ba.freestatistics.org/blog/index.php?pk=&T=0

As an alternative you can also use a QR Code:  

The GUIDs for individual cells are displayed in the table below:

Summary of computational transaction
Raw Inputview raw input (R code)
Raw Outputview raw output of R engine
Computing time1 seconds
R Server'George Udny Yule' @ yule.wessa.net


Harrell-Davis Quantiles
quantilesvaluestandard error
0.0511.31936128434160.888285522775273
0.113.01373828017831.43454256318925
0.1514.77886198511841.52931363322259
0.216.32152203879461.44230619657323
0.2517.6436357975851.39082176599694
0.318.89817503374211.5481048093521
0.3520.28159210030951.89061091771644
0.421.80865761449062.0173107357105
0.4523.26092396469951.76250218970827
0.524.51898971807061.54163148475538
0.5525.7569580182551.70628840410018
0.627.15569322639271.93106879090619
0.6528.61329768403681.80099381058577
0.729.94818337719271.50725306739993
0.7531.29407820093961.59429186201774
0.833.07732678935542.15459898247476
0.8535.44216813380762.39660102857806
0.937.87004489926421.80984119750444
0.9539.98126491451461.17851086452201

\begin{tabular}{lllllllll}
\hline
Harrell-Davis Quantiles \tabularnewline
quantiles & value & standard error \tabularnewline
0.05 & 11.3193612843416 & 0.888285522775273 \tabularnewline
0.1 & 13.0137382801783 & 1.43454256318925 \tabularnewline
0.15 & 14.7788619851184 & 1.52931363322259 \tabularnewline
0.2 & 16.3215220387946 & 1.44230619657323 \tabularnewline
0.25 & 17.643635797585 & 1.39082176599694 \tabularnewline
0.3 & 18.8981750337421 & 1.5481048093521 \tabularnewline
0.35 & 20.2815921003095 & 1.89061091771644 \tabularnewline
0.4 & 21.8086576144906 & 2.0173107357105 \tabularnewline
0.45 & 23.2609239646995 & 1.76250218970827 \tabularnewline
0.5 & 24.5189897180706 & 1.54163148475538 \tabularnewline
0.55 & 25.756958018255 & 1.70628840410018 \tabularnewline
0.6 & 27.1556932263927 & 1.93106879090619 \tabularnewline
0.65 & 28.6132976840368 & 1.80099381058577 \tabularnewline
0.7 & 29.9481833771927 & 1.50725306739993 \tabularnewline
0.75 & 31.2940782009396 & 1.59429186201774 \tabularnewline
0.8 & 33.0773267893554 & 2.15459898247476 \tabularnewline
0.85 & 35.4421681338076 & 2.39660102857806 \tabularnewline
0.9 & 37.8700448992642 & 1.80984119750444 \tabularnewline
0.95 & 39.9812649145146 & 1.17851086452201 \tabularnewline
\hline
\end{tabular}
%Source: https://freestatistics.org/blog/index.php?pk=&T=1

[TABLE]
[ROW][C]Harrell-Davis Quantiles[/C][/ROW]
[ROW][C]quantiles[/C][C]value[/C][C]standard error[/C][/ROW]
[ROW][C]0.05[/C][C]11.3193612843416[/C][C]0.888285522775273[/C][/ROW]
[ROW][C]0.1[/C][C]13.0137382801783[/C][C]1.43454256318925[/C][/ROW]
[ROW][C]0.15[/C][C]14.7788619851184[/C][C]1.52931363322259[/C][/ROW]
[ROW][C]0.2[/C][C]16.3215220387946[/C][C]1.44230619657323[/C][/ROW]
[ROW][C]0.25[/C][C]17.643635797585[/C][C]1.39082176599694[/C][/ROW]
[ROW][C]0.3[/C][C]18.8981750337421[/C][C]1.5481048093521[/C][/ROW]
[ROW][C]0.35[/C][C]20.2815921003095[/C][C]1.89061091771644[/C][/ROW]
[ROW][C]0.4[/C][C]21.8086576144906[/C][C]2.0173107357105[/C][/ROW]
[ROW][C]0.45[/C][C]23.2609239646995[/C][C]1.76250218970827[/C][/ROW]
[ROW][C]0.5[/C][C]24.5189897180706[/C][C]1.54163148475538[/C][/ROW]
[ROW][C]0.55[/C][C]25.756958018255[/C][C]1.70628840410018[/C][/ROW]
[ROW][C]0.6[/C][C]27.1556932263927[/C][C]1.93106879090619[/C][/ROW]
[ROW][C]0.65[/C][C]28.6132976840368[/C][C]1.80099381058577[/C][/ROW]
[ROW][C]0.7[/C][C]29.9481833771927[/C][C]1.50725306739993[/C][/ROW]
[ROW][C]0.75[/C][C]31.2940782009396[/C][C]1.59429186201774[/C][/ROW]
[ROW][C]0.8[/C][C]33.0773267893554[/C][C]2.15459898247476[/C][/ROW]
[ROW][C]0.85[/C][C]35.4421681338076[/C][C]2.39660102857806[/C][/ROW]
[ROW][C]0.9[/C][C]37.8700448992642[/C][C]1.80984119750444[/C][/ROW]
[ROW][C]0.95[/C][C]39.9812649145146[/C][C]1.17851086452201[/C][/ROW]
[/TABLE]
Source: https://freestatistics.org/blog/index.php?pk=&T=1

Globally Unique Identifier (entire table): ba.freestatistics.org/blog/index.php?pk=&T=1

As an alternative you can also use a QR Code:  

The GUIDs for individual cells are displayed in the table below:

Harrell-Davis Quantiles
quantilesvaluestandard error
0.0511.31936128434160.888285522775273
0.113.01373828017831.43454256318925
0.1514.77886198511841.52931363322259
0.216.32152203879461.44230619657323
0.2517.6436357975851.39082176599694
0.318.89817503374211.5481048093521
0.3520.28159210030951.89061091771644
0.421.80865761449062.0173107357105
0.4523.26092396469951.76250218970827
0.524.51898971807061.54163148475538
0.5525.7569580182551.70628840410018
0.627.15569322639271.93106879090619
0.6528.61329768403681.80099381058577
0.729.94818337719271.50725306739993
0.7531.29407820093961.59429186201774
0.833.07732678935542.15459898247476
0.8535.44216813380762.39660102857806
0.937.87004489926421.80984119750444
0.9539.98126491451461.17851086452201


Parameters (Session):
par1 = 0.05 ; par2 = 0.95 ; par3 = 0.05 ;
Parameters (R input):
par1 = 0.05 ; par2 = 0.95 ; par3 = 0.05 ;
R code (references can be found in the software module):
par1 <- as(par1,'numeric')
par2 <- as(par2,'numeric')
par3 <- as(par3,'numeric')
library(Hmisc)
myseq <- seq(par1, par2, par3)
hd <- hdquantile(x, probs = myseq, se = TRUE, na.rm = FALSE, names = TRUE, weights=FALSE)
bitmap(file='test1.png')
plot(myseq,hd,col=2,main=main,xlab=xlab,ylab=ylab)
grid()
dev.off()
load(file='createtable')
a<-table.start()
a<-table.row.start(a)
a<-table.element(a,'Harrell-Davis Quantiles',3,TRUE)
a<-table.row.end(a)
a<-table.row.start(a)
a<-table.element(a,'quantiles',header=TRUE)
a<-table.element(a,'value',header=TRUE)
a<-table.element(a,'standard error',header=TRUE)
a<-table.row.end(a)
length(hd)
for (i in 1:length(hd))
{
a<-table.row.start(a)
a<-table.element(a,as(labels(hd)[i],'numeric'),header=TRUE)
a<-table.element(a,as.matrix(hd[i])[1,1])
a<-table.element(a,as.matrix(attr(hd,'se')[i])[1,1])
a<-table.row.end(a)
}
a<-table.end(a)
table.save(a,file='mytable.tab')