Free Statistics

of Irreproducible Research!

Author's title

Author*The author of this computation has been verified*
R Software Modulerwasp_autocorrelation.wasp
Title produced by software(Partial) Autocorrelation Function
Date of computationWed, 25 Jan 2017 10:53:29 +0100
Cite this page as followsStatistical Computations at FreeStatistics.org, Office for Research Development and Education, URL https://freestatistics.org/blog/index.php?v=date/2017/Jan/25/t1485338017zmqe6wr21k4dvaa.htm/, Retrieved Tue, 14 May 2024 08:26:01 +0000
Statistical Computations at FreeStatistics.org, Office for Research Development and Education, URL https://freestatistics.org/blog/index.php?pk=306431, Retrieved Tue, 14 May 2024 08:26:01 +0000
QR Codes:

Original text written by user:
IsPrivate?No (this computation is public)
User-defined keywords
Estimated Impact49
Family? (F = Feedback message, R = changed R code, M = changed R Module, P = changed Parameters, D = changed Data)
-       [(Partial) Autocorrelation Function] [] [2017-01-25 09:53:29] [cefbb908b49c27a772f794ee9c78d9df] [Current]
Feedback Forum

Post a new message
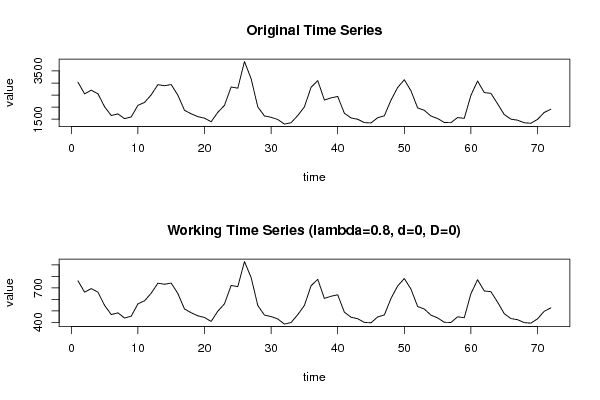
Dataseries X:
3035
2552
2704
2554
2014
1655
1721
1524
1596
2074
2199
2512
2933
2889
2938
2497
1870
1726
1607
1545
1396
1787
2076
2837
2787
3891
3179
2011
1636
1580
1489
1300
1356
1653
2013
2823
3102
2294
2385
2444
1748
1554
1498
1361
1346
1564
1640
2293
2815
3137
2679
1969
1870
1633
1529
1366
1357
1570
1535
2491
3084
2605
2573
2143
1693
1504
1461
1354
1333
1492
1781
1915


Summary of computational transaction
Raw Input view raw input (R code)
Raw Outputview raw output of R engine
Computing time1 seconds
R ServerBig Analytics Cloud Computing Center

\begin{tabular}{lllllllll}
\hline
Summary of computational transaction \tabularnewline
Raw Input view raw input (R code)  \tabularnewline
Raw Outputview raw output of R engine  \tabularnewline
Computing time1 seconds \tabularnewline
R ServerBig Analytics Cloud Computing Center \tabularnewline
\hline
\end{tabular}
%Source: https://freestatistics.org/blog/index.php?pk=306431&T=0

[TABLE]
[ROW]
Summary of computational transaction[/C][/ROW] [ROW]Raw Input[/C] view raw input (R code) [/C][/ROW] [ROW]Raw Output[/C]view raw output of R engine [/C][/ROW] [ROW]Computing time[/C]1 seconds[/C][/ROW] [ROW]R Server[/C]Big Analytics Cloud Computing Center[/C][/ROW] [/TABLE] Source: https://freestatistics.org/blog/index.php?pk=306431&T=0

Globally Unique Identifier (entire table): ba.freestatistics.org/blog/index.php?pk=306431&T=0

As an alternative you can also use a QR Code:  

The GUIDs for individual cells are displayed in the table below:

Summary of computational transaction
Raw Input view raw input (R code)
Raw Outputview raw output of R engine
Computing time1 seconds
R ServerBig Analytics Cloud Computing Center


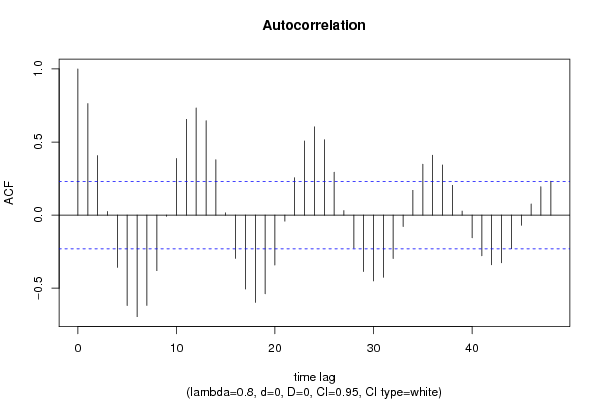
Autocorrelation Function
Time lag kACF(k)T-STATP-value
10.7627966.47250
20.4070253.45370.000465
30.0253660.21520.415095
4-0.357632-3.03460.001675
5-0.618556-5.24861e-06
6-0.694399-5.89220
7-0.617254-5.23761e-06
8-0.379714-3.2220.000956
9-0.007781-0.0660.473771
100.3874833.28790.000781
110.6549235.55720
120.732866.21850
130.6455515.47770
140.3790983.21680.000972
150.0157870.1340.446905
16-0.295565-2.5080.007199
17-0.505156-4.28642.8e-05
18-0.596935-5.06522e-06
19-0.538083-4.56581e-05
20-0.341525-2.89790.002487
21-0.041256-0.35010.363655
220.2554432.16750.016752
230.5066384.2992.6e-05
240.6038445.12381e-06
250.5157444.37622e-05
260.2935732.49110.007521
270.0311390.26420.396181
28-0.225475-1.91320.029848
29-0.385732-3.2730.000818
30-0.449721-3.8160.000142
31-0.425403-3.60970.000282
32-0.296669-2.51730.007026
33-0.078138-0.6630.254717
340.1696751.43970.077138
350.3484542.95670.002101
360.4096143.47570.000434
370.3426222.90720.002422
380.2039091.73020.043938
390.0273840.23240.408459
40-0.15533-1.3180.095838
41-0.277534-2.3550.010627
42-0.339544-2.88110.002609
43-0.325237-2.75970.003666
44-0.229104-1.9440.027901
45-0.068672-0.58270.280958
460.0768220.65190.258285
470.1936761.64340.052331
480.2317911.96680.026529

\begin{tabular}{lllllllll}
\hline
Autocorrelation Function \tabularnewline
Time lag k & ACF(k) & T-STAT & P-value \tabularnewline
1 & 0.762796 & 6.4725 & 0 \tabularnewline
2 & 0.407025 & 3.4537 & 0.000465 \tabularnewline
3 & 0.025366 & 0.2152 & 0.415095 \tabularnewline
4 & -0.357632 & -3.0346 & 0.001675 \tabularnewline
5 & -0.618556 & -5.2486 & 1e-06 \tabularnewline
6 & -0.694399 & -5.8922 & 0 \tabularnewline
7 & -0.617254 & -5.2376 & 1e-06 \tabularnewline
8 & -0.379714 & -3.222 & 0.000956 \tabularnewline
9 & -0.007781 & -0.066 & 0.473771 \tabularnewline
10 & 0.387483 & 3.2879 & 0.000781 \tabularnewline
11 & 0.654923 & 5.5572 & 0 \tabularnewline
12 & 0.73286 & 6.2185 & 0 \tabularnewline
13 & 0.645551 & 5.4777 & 0 \tabularnewline
14 & 0.379098 & 3.2168 & 0.000972 \tabularnewline
15 & 0.015787 & 0.134 & 0.446905 \tabularnewline
16 & -0.295565 & -2.508 & 0.007199 \tabularnewline
17 & -0.505156 & -4.2864 & 2.8e-05 \tabularnewline
18 & -0.596935 & -5.0652 & 2e-06 \tabularnewline
19 & -0.538083 & -4.5658 & 1e-05 \tabularnewline
20 & -0.341525 & -2.8979 & 0.002487 \tabularnewline
21 & -0.041256 & -0.3501 & 0.363655 \tabularnewline
22 & 0.255443 & 2.1675 & 0.016752 \tabularnewline
23 & 0.506638 & 4.299 & 2.6e-05 \tabularnewline
24 & 0.603844 & 5.1238 & 1e-06 \tabularnewline
25 & 0.515744 & 4.3762 & 2e-05 \tabularnewline
26 & 0.293573 & 2.4911 & 0.007521 \tabularnewline
27 & 0.031139 & 0.2642 & 0.396181 \tabularnewline
28 & -0.225475 & -1.9132 & 0.029848 \tabularnewline
29 & -0.385732 & -3.273 & 0.000818 \tabularnewline
30 & -0.449721 & -3.816 & 0.000142 \tabularnewline
31 & -0.425403 & -3.6097 & 0.000282 \tabularnewline
32 & -0.296669 & -2.5173 & 0.007026 \tabularnewline
33 & -0.078138 & -0.663 & 0.254717 \tabularnewline
34 & 0.169675 & 1.4397 & 0.077138 \tabularnewline
35 & 0.348454 & 2.9567 & 0.002101 \tabularnewline
36 & 0.409614 & 3.4757 & 0.000434 \tabularnewline
37 & 0.342622 & 2.9072 & 0.002422 \tabularnewline
38 & 0.203909 & 1.7302 & 0.043938 \tabularnewline
39 & 0.027384 & 0.2324 & 0.408459 \tabularnewline
40 & -0.15533 & -1.318 & 0.095838 \tabularnewline
41 & -0.277534 & -2.355 & 0.010627 \tabularnewline
42 & -0.339544 & -2.8811 & 0.002609 \tabularnewline
43 & -0.325237 & -2.7597 & 0.003666 \tabularnewline
44 & -0.229104 & -1.944 & 0.027901 \tabularnewline
45 & -0.068672 & -0.5827 & 0.280958 \tabularnewline
46 & 0.076822 & 0.6519 & 0.258285 \tabularnewline
47 & 0.193676 & 1.6434 & 0.052331 \tabularnewline
48 & 0.231791 & 1.9668 & 0.026529 \tabularnewline
\hline
\end{tabular}
%Source: https://freestatistics.org/blog/index.php?pk=306431&T=1

[TABLE]
[ROW][C]Autocorrelation Function[/C][/ROW]
[ROW][C]Time lag k[/C][C]ACF(k)[/C][C]T-STAT[/C][C]P-value[/C][/ROW]
[ROW][C]1[/C][C]0.762796[/C][C]6.4725[/C][C]0[/C][/ROW]
[ROW][C]2[/C][C]0.407025[/C][C]3.4537[/C][C]0.000465[/C][/ROW]
[ROW][C]3[/C][C]0.025366[/C][C]0.2152[/C][C]0.415095[/C][/ROW]
[ROW][C]4[/C][C]-0.357632[/C][C]-3.0346[/C][C]0.001675[/C][/ROW]
[ROW][C]5[/C][C]-0.618556[/C][C]-5.2486[/C][C]1e-06[/C][/ROW]
[ROW][C]6[/C][C]-0.694399[/C][C]-5.8922[/C][C]0[/C][/ROW]
[ROW][C]7[/C][C]-0.617254[/C][C]-5.2376[/C][C]1e-06[/C][/ROW]
[ROW][C]8[/C][C]-0.379714[/C][C]-3.222[/C][C]0.000956[/C][/ROW]
[ROW][C]9[/C][C]-0.007781[/C][C]-0.066[/C][C]0.473771[/C][/ROW]
[ROW][C]10[/C][C]0.387483[/C][C]3.2879[/C][C]0.000781[/C][/ROW]
[ROW][C]11[/C][C]0.654923[/C][C]5.5572[/C][C]0[/C][/ROW]
[ROW][C]12[/C][C]0.73286[/C][C]6.2185[/C][C]0[/C][/ROW]
[ROW][C]13[/C][C]0.645551[/C][C]5.4777[/C][C]0[/C][/ROW]
[ROW][C]14[/C][C]0.379098[/C][C]3.2168[/C][C]0.000972[/C][/ROW]
[ROW][C]15[/C][C]0.015787[/C][C]0.134[/C][C]0.446905[/C][/ROW]
[ROW][C]16[/C][C]-0.295565[/C][C]-2.508[/C][C]0.007199[/C][/ROW]
[ROW][C]17[/C][C]-0.505156[/C][C]-4.2864[/C][C]2.8e-05[/C][/ROW]
[ROW][C]18[/C][C]-0.596935[/C][C]-5.0652[/C][C]2e-06[/C][/ROW]
[ROW][C]19[/C][C]-0.538083[/C][C]-4.5658[/C][C]1e-05[/C][/ROW]
[ROW][C]20[/C][C]-0.341525[/C][C]-2.8979[/C][C]0.002487[/C][/ROW]
[ROW][C]21[/C][C]-0.041256[/C][C]-0.3501[/C][C]0.363655[/C][/ROW]
[ROW][C]22[/C][C]0.255443[/C][C]2.1675[/C][C]0.016752[/C][/ROW]
[ROW][C]23[/C][C]0.506638[/C][C]4.299[/C][C]2.6e-05[/C][/ROW]
[ROW][C]24[/C][C]0.603844[/C][C]5.1238[/C][C]1e-06[/C][/ROW]
[ROW][C]25[/C][C]0.515744[/C][C]4.3762[/C][C]2e-05[/C][/ROW]
[ROW][C]26[/C][C]0.293573[/C][C]2.4911[/C][C]0.007521[/C][/ROW]
[ROW][C]27[/C][C]0.031139[/C][C]0.2642[/C][C]0.396181[/C][/ROW]
[ROW][C]28[/C][C]-0.225475[/C][C]-1.9132[/C][C]0.029848[/C][/ROW]
[ROW][C]29[/C][C]-0.385732[/C][C]-3.273[/C][C]0.000818[/C][/ROW]
[ROW][C]30[/C][C]-0.449721[/C][C]-3.816[/C][C]0.000142[/C][/ROW]
[ROW][C]31[/C][C]-0.425403[/C][C]-3.6097[/C][C]0.000282[/C][/ROW]
[ROW][C]32[/C][C]-0.296669[/C][C]-2.5173[/C][C]0.007026[/C][/ROW]
[ROW][C]33[/C][C]-0.078138[/C][C]-0.663[/C][C]0.254717[/C][/ROW]
[ROW][C]34[/C][C]0.169675[/C][C]1.4397[/C][C]0.077138[/C][/ROW]
[ROW][C]35[/C][C]0.348454[/C][C]2.9567[/C][C]0.002101[/C][/ROW]
[ROW][C]36[/C][C]0.409614[/C][C]3.4757[/C][C]0.000434[/C][/ROW]
[ROW][C]37[/C][C]0.342622[/C][C]2.9072[/C][C]0.002422[/C][/ROW]
[ROW][C]38[/C][C]0.203909[/C][C]1.7302[/C][C]0.043938[/C][/ROW]
[ROW][C]39[/C][C]0.027384[/C][C]0.2324[/C][C]0.408459[/C][/ROW]
[ROW][C]40[/C][C]-0.15533[/C][C]-1.318[/C][C]0.095838[/C][/ROW]
[ROW][C]41[/C][C]-0.277534[/C][C]-2.355[/C][C]0.010627[/C][/ROW]
[ROW][C]42[/C][C]-0.339544[/C][C]-2.8811[/C][C]0.002609[/C][/ROW]
[ROW][C]43[/C][C]-0.325237[/C][C]-2.7597[/C][C]0.003666[/C][/ROW]
[ROW][C]44[/C][C]-0.229104[/C][C]-1.944[/C][C]0.027901[/C][/ROW]
[ROW][C]45[/C][C]-0.068672[/C][C]-0.5827[/C][C]0.280958[/C][/ROW]
[ROW][C]46[/C][C]0.076822[/C][C]0.6519[/C][C]0.258285[/C][/ROW]
[ROW][C]47[/C][C]0.193676[/C][C]1.6434[/C][C]0.052331[/C][/ROW]
[ROW][C]48[/C][C]0.231791[/C][C]1.9668[/C][C]0.026529[/C][/ROW]
[/TABLE]
Source: https://freestatistics.org/blog/index.php?pk=306431&T=1

Globally Unique Identifier (entire table): ba.freestatistics.org/blog/index.php?pk=306431&T=1

As an alternative you can also use a QR Code:  

The GUIDs for individual cells are displayed in the table below:

Autocorrelation Function
Time lag kACF(k)T-STATP-value
10.7627966.47250
20.4070253.45370.000465
30.0253660.21520.415095
4-0.357632-3.03460.001675
5-0.618556-5.24861e-06
6-0.694399-5.89220
7-0.617254-5.23761e-06
8-0.379714-3.2220.000956
9-0.007781-0.0660.473771
100.3874833.28790.000781
110.6549235.55720
120.732866.21850
130.6455515.47770
140.3790983.21680.000972
150.0157870.1340.446905
16-0.295565-2.5080.007199
17-0.505156-4.28642.8e-05
18-0.596935-5.06522e-06
19-0.538083-4.56581e-05
20-0.341525-2.89790.002487
21-0.041256-0.35010.363655
220.2554432.16750.016752
230.5066384.2992.6e-05
240.6038445.12381e-06
250.5157444.37622e-05
260.2935732.49110.007521
270.0311390.26420.396181
28-0.225475-1.91320.029848
29-0.385732-3.2730.000818
30-0.449721-3.8160.000142
31-0.425403-3.60970.000282
32-0.296669-2.51730.007026
33-0.078138-0.6630.254717
340.1696751.43970.077138
350.3484542.95670.002101
360.4096143.47570.000434
370.3426222.90720.002422
380.2039091.73020.043938
390.0273840.23240.408459
40-0.15533-1.3180.095838
41-0.277534-2.3550.010627
42-0.339544-2.88110.002609
43-0.325237-2.75970.003666
44-0.229104-1.9440.027901
45-0.068672-0.58270.280958
460.0768220.65190.258285
470.1936761.64340.052331
480.2317911.96680.026529


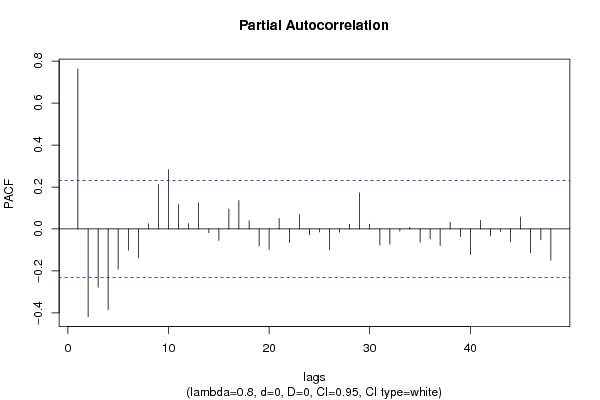
Partial Autocorrelation Function
Time lag kPACF(k)T-STATP-value
10.7627966.47250
2-0.418116-3.54780.000344
3-0.278196-2.36060.010479
4-0.383925-3.25770.000857
5-0.192141-1.63040.053695
6-0.101176-0.85850.196731
7-0.137849-1.16970.122993
80.0241630.2050.419064
90.2120511.79930.03808
100.2826842.39870.009524
110.1152890.97830.16561
120.025840.21930.413534
130.1244581.05610.147235
14-0.017654-0.14980.440671
15-0.055174-0.46820.320541
160.0951720.80760.211002
170.1360611.15450.126054
180.0394720.33490.369327
19-0.080898-0.68640.247321
20-0.097947-0.83110.204329
210.0498750.42320.336705
22-0.064581-0.5480.292698
230.0691170.58650.279695
24-0.027732-0.23530.407315
25-0.014551-0.12350.451038
26-0.099386-0.84330.200922
27-0.015959-0.13540.446332
280.0220050.18670.426203
290.1721671.46090.074198
300.0223310.18950.425125
31-0.076175-0.64640.260047
32-0.072503-0.61520.270178
33-0.010242-0.08690.465493
340.0079010.0670.473366
35-0.062763-0.53260.297988
36-0.048272-0.40960.341658
37-0.078668-0.66750.253288
380.0317560.26950.394174
39-0.036725-0.31160.378115
40-0.121893-1.03430.15223
410.0408010.34620.365097
42-0.032931-0.27940.390359
43-0.011489-0.09750.461306
44-0.060903-0.51680.303446
450.0570960.48450.31476
46-0.11321-0.96060.16998
47-0.051495-0.43690.331729
48-0.148558-1.26060.10577

\begin{tabular}{lllllllll}
\hline
Partial Autocorrelation Function \tabularnewline
Time lag k & PACF(k) & T-STAT & P-value \tabularnewline
1 & 0.762796 & 6.4725 & 0 \tabularnewline
2 & -0.418116 & -3.5478 & 0.000344 \tabularnewline
3 & -0.278196 & -2.3606 & 0.010479 \tabularnewline
4 & -0.383925 & -3.2577 & 0.000857 \tabularnewline
5 & -0.192141 & -1.6304 & 0.053695 \tabularnewline
6 & -0.101176 & -0.8585 & 0.196731 \tabularnewline
7 & -0.137849 & -1.1697 & 0.122993 \tabularnewline
8 & 0.024163 & 0.205 & 0.419064 \tabularnewline
9 & 0.212051 & 1.7993 & 0.03808 \tabularnewline
10 & 0.282684 & 2.3987 & 0.009524 \tabularnewline
11 & 0.115289 & 0.9783 & 0.16561 \tabularnewline
12 & 0.02584 & 0.2193 & 0.413534 \tabularnewline
13 & 0.124458 & 1.0561 & 0.147235 \tabularnewline
14 & -0.017654 & -0.1498 & 0.440671 \tabularnewline
15 & -0.055174 & -0.4682 & 0.320541 \tabularnewline
16 & 0.095172 & 0.8076 & 0.211002 \tabularnewline
17 & 0.136061 & 1.1545 & 0.126054 \tabularnewline
18 & 0.039472 & 0.3349 & 0.369327 \tabularnewline
19 & -0.080898 & -0.6864 & 0.247321 \tabularnewline
20 & -0.097947 & -0.8311 & 0.204329 \tabularnewline
21 & 0.049875 & 0.4232 & 0.336705 \tabularnewline
22 & -0.064581 & -0.548 & 0.292698 \tabularnewline
23 & 0.069117 & 0.5865 & 0.279695 \tabularnewline
24 & -0.027732 & -0.2353 & 0.407315 \tabularnewline
25 & -0.014551 & -0.1235 & 0.451038 \tabularnewline
26 & -0.099386 & -0.8433 & 0.200922 \tabularnewline
27 & -0.015959 & -0.1354 & 0.446332 \tabularnewline
28 & 0.022005 & 0.1867 & 0.426203 \tabularnewline
29 & 0.172167 & 1.4609 & 0.074198 \tabularnewline
30 & 0.022331 & 0.1895 & 0.425125 \tabularnewline
31 & -0.076175 & -0.6464 & 0.260047 \tabularnewline
32 & -0.072503 & -0.6152 & 0.270178 \tabularnewline
33 & -0.010242 & -0.0869 & 0.465493 \tabularnewline
34 & 0.007901 & 0.067 & 0.473366 \tabularnewline
35 & -0.062763 & -0.5326 & 0.297988 \tabularnewline
36 & -0.048272 & -0.4096 & 0.341658 \tabularnewline
37 & -0.078668 & -0.6675 & 0.253288 \tabularnewline
38 & 0.031756 & 0.2695 & 0.394174 \tabularnewline
39 & -0.036725 & -0.3116 & 0.378115 \tabularnewline
40 & -0.121893 & -1.0343 & 0.15223 \tabularnewline
41 & 0.040801 & 0.3462 & 0.365097 \tabularnewline
42 & -0.032931 & -0.2794 & 0.390359 \tabularnewline
43 & -0.011489 & -0.0975 & 0.461306 \tabularnewline
44 & -0.060903 & -0.5168 & 0.303446 \tabularnewline
45 & 0.057096 & 0.4845 & 0.31476 \tabularnewline
46 & -0.11321 & -0.9606 & 0.16998 \tabularnewline
47 & -0.051495 & -0.4369 & 0.331729 \tabularnewline
48 & -0.148558 & -1.2606 & 0.10577 \tabularnewline
\hline
\end{tabular}
%Source: https://freestatistics.org/blog/index.php?pk=306431&T=2

[TABLE]
[ROW][C]Partial Autocorrelation Function[/C][/ROW]
[ROW][C]Time lag k[/C][C]PACF(k)[/C][C]T-STAT[/C][C]P-value[/C][/ROW]
[ROW][C]1[/C][C]0.762796[/C][C]6.4725[/C][C]0[/C][/ROW]
[ROW][C]2[/C][C]-0.418116[/C][C]-3.5478[/C][C]0.000344[/C][/ROW]
[ROW][C]3[/C][C]-0.278196[/C][C]-2.3606[/C][C]0.010479[/C][/ROW]
[ROW][C]4[/C][C]-0.383925[/C][C]-3.2577[/C][C]0.000857[/C][/ROW]
[ROW][C]5[/C][C]-0.192141[/C][C]-1.6304[/C][C]0.053695[/C][/ROW]
[ROW][C]6[/C][C]-0.101176[/C][C]-0.8585[/C][C]0.196731[/C][/ROW]
[ROW][C]7[/C][C]-0.137849[/C][C]-1.1697[/C][C]0.122993[/C][/ROW]
[ROW][C]8[/C][C]0.024163[/C][C]0.205[/C][C]0.419064[/C][/ROW]
[ROW][C]9[/C][C]0.212051[/C][C]1.7993[/C][C]0.03808[/C][/ROW]
[ROW][C]10[/C][C]0.282684[/C][C]2.3987[/C][C]0.009524[/C][/ROW]
[ROW][C]11[/C][C]0.115289[/C][C]0.9783[/C][C]0.16561[/C][/ROW]
[ROW][C]12[/C][C]0.02584[/C][C]0.2193[/C][C]0.413534[/C][/ROW]
[ROW][C]13[/C][C]0.124458[/C][C]1.0561[/C][C]0.147235[/C][/ROW]
[ROW][C]14[/C][C]-0.017654[/C][C]-0.1498[/C][C]0.440671[/C][/ROW]
[ROW][C]15[/C][C]-0.055174[/C][C]-0.4682[/C][C]0.320541[/C][/ROW]
[ROW][C]16[/C][C]0.095172[/C][C]0.8076[/C][C]0.211002[/C][/ROW]
[ROW][C]17[/C][C]0.136061[/C][C]1.1545[/C][C]0.126054[/C][/ROW]
[ROW][C]18[/C][C]0.039472[/C][C]0.3349[/C][C]0.369327[/C][/ROW]
[ROW][C]19[/C][C]-0.080898[/C][C]-0.6864[/C][C]0.247321[/C][/ROW]
[ROW][C]20[/C][C]-0.097947[/C][C]-0.8311[/C][C]0.204329[/C][/ROW]
[ROW][C]21[/C][C]0.049875[/C][C]0.4232[/C][C]0.336705[/C][/ROW]
[ROW][C]22[/C][C]-0.064581[/C][C]-0.548[/C][C]0.292698[/C][/ROW]
[ROW][C]23[/C][C]0.069117[/C][C]0.5865[/C][C]0.279695[/C][/ROW]
[ROW][C]24[/C][C]-0.027732[/C][C]-0.2353[/C][C]0.407315[/C][/ROW]
[ROW][C]25[/C][C]-0.014551[/C][C]-0.1235[/C][C]0.451038[/C][/ROW]
[ROW][C]26[/C][C]-0.099386[/C][C]-0.8433[/C][C]0.200922[/C][/ROW]
[ROW][C]27[/C][C]-0.015959[/C][C]-0.1354[/C][C]0.446332[/C][/ROW]
[ROW][C]28[/C][C]0.022005[/C][C]0.1867[/C][C]0.426203[/C][/ROW]
[ROW][C]29[/C][C]0.172167[/C][C]1.4609[/C][C]0.074198[/C][/ROW]
[ROW][C]30[/C][C]0.022331[/C][C]0.1895[/C][C]0.425125[/C][/ROW]
[ROW][C]31[/C][C]-0.076175[/C][C]-0.6464[/C][C]0.260047[/C][/ROW]
[ROW][C]32[/C][C]-0.072503[/C][C]-0.6152[/C][C]0.270178[/C][/ROW]
[ROW][C]33[/C][C]-0.010242[/C][C]-0.0869[/C][C]0.465493[/C][/ROW]
[ROW][C]34[/C][C]0.007901[/C][C]0.067[/C][C]0.473366[/C][/ROW]
[ROW][C]35[/C][C]-0.062763[/C][C]-0.5326[/C][C]0.297988[/C][/ROW]
[ROW][C]36[/C][C]-0.048272[/C][C]-0.4096[/C][C]0.341658[/C][/ROW]
[ROW][C]37[/C][C]-0.078668[/C][C]-0.6675[/C][C]0.253288[/C][/ROW]
[ROW][C]38[/C][C]0.031756[/C][C]0.2695[/C][C]0.394174[/C][/ROW]
[ROW][C]39[/C][C]-0.036725[/C][C]-0.3116[/C][C]0.378115[/C][/ROW]
[ROW][C]40[/C][C]-0.121893[/C][C]-1.0343[/C][C]0.15223[/C][/ROW]
[ROW][C]41[/C][C]0.040801[/C][C]0.3462[/C][C]0.365097[/C][/ROW]
[ROW][C]42[/C][C]-0.032931[/C][C]-0.2794[/C][C]0.390359[/C][/ROW]
[ROW][C]43[/C][C]-0.011489[/C][C]-0.0975[/C][C]0.461306[/C][/ROW]
[ROW][C]44[/C][C]-0.060903[/C][C]-0.5168[/C][C]0.303446[/C][/ROW]
[ROW][C]45[/C][C]0.057096[/C][C]0.4845[/C][C]0.31476[/C][/ROW]
[ROW][C]46[/C][C]-0.11321[/C][C]-0.9606[/C][C]0.16998[/C][/ROW]
[ROW][C]47[/C][C]-0.051495[/C][C]-0.4369[/C][C]0.331729[/C][/ROW]
[ROW][C]48[/C][C]-0.148558[/C][C]-1.2606[/C][C]0.10577[/C][/ROW]
[/TABLE]
Source: https://freestatistics.org/blog/index.php?pk=306431&T=2

Globally Unique Identifier (entire table): ba.freestatistics.org/blog/index.php?pk=306431&T=2

As an alternative you can also use a QR Code:  

The GUIDs for individual cells are displayed in the table below:

Partial Autocorrelation Function
Time lag kPACF(k)T-STATP-value
10.7627966.47250
2-0.418116-3.54780.000344
3-0.278196-2.36060.010479
4-0.383925-3.25770.000857
5-0.192141-1.63040.053695
6-0.101176-0.85850.196731
7-0.137849-1.16970.122993
80.0241630.2050.419064
90.2120511.79930.03808
100.2826842.39870.009524
110.1152890.97830.16561
120.025840.21930.413534
130.1244581.05610.147235
14-0.017654-0.14980.440671
15-0.055174-0.46820.320541
160.0951720.80760.211002
170.1360611.15450.126054
180.0394720.33490.369327
19-0.080898-0.68640.247321
20-0.097947-0.83110.204329
210.0498750.42320.336705
22-0.064581-0.5480.292698
230.0691170.58650.279695
24-0.027732-0.23530.407315
25-0.014551-0.12350.451038
26-0.099386-0.84330.200922
27-0.015959-0.13540.446332
280.0220050.18670.426203
290.1721671.46090.074198
300.0223310.18950.425125
31-0.076175-0.64640.260047
32-0.072503-0.61520.270178
33-0.010242-0.08690.465493
340.0079010.0670.473366
35-0.062763-0.53260.297988
36-0.048272-0.40960.341658
37-0.078668-0.66750.253288
380.0317560.26950.394174
39-0.036725-0.31160.378115
40-0.121893-1.03430.15223
410.0408010.34620.365097
42-0.032931-0.27940.390359
43-0.011489-0.09750.461306
44-0.060903-0.51680.303446
450.0570960.48450.31476
46-0.11321-0.96060.16998
47-0.051495-0.43690.331729
48-0.148558-1.26060.10577


Parameters (Session):
par1 = 1 ; par2 = 2 ; par3 = Pearson Chi-Squared ;
Parameters (R input):
par1 = 48 ; par2 = 0.8 ; par3 = 0 ; par4 = 0 ; par5 = 12 ; par6 = White Noise ; par7 = 0.95 ; par8 = ;
R code (references can be found in the software module):
if (par1 == 'Default') {
par1 = 10*log10(length(x))
} else {
par1 <- as.numeric(par1)
}
par2 <- as.numeric(par2)
par3 <- as.numeric(par3)
par4 <- as.numeric(par4)
par5 <- as.numeric(par5)
if (par6 == 'White Noise') par6 <- 'white' else par6 <- 'ma'
par7 <- as.numeric(par7)
if (par8 != '') par8 <- as.numeric(par8)
x <- na.omit(x)
ox <- x
if (par8 == '') {
if (par2 == 0) {
x <- log(x)
} else {
x <- (x ^ par2 - 1) / par2
}
} else {
x <- log(x,base=par8)
}
if (par3 > 0) x <- diff(x,lag=1,difference=par3)
if (par4 > 0) x <- diff(x,lag=par5,difference=par4)
bitmap(file='picts.png')
op <- par(mfrow=c(2,1))
plot(ox,type='l',main='Original Time Series',xlab='time',ylab='value')
if (par8=='') {
mytitle <- paste('Working Time Series (lambda=',par2,', d=',par3,', D=',par4,')',sep='')
mysub <- paste('(lambda=',par2,', d=',par3,', D=',par4,', CI=', par7, ', CI type=',par6,')',sep='')
} else {
mytitle <- paste('Working Time Series (base=',par8,', d=',par3,', D=',par4,')',sep='')
mysub <- paste('(base=',par8,', d=',par3,', D=',par4,', CI=', par7, ', CI type=',par6,')',sep='')
}
plot(x,type='l', main=mytitle,xlab='time',ylab='value')
par(op)
dev.off()
bitmap(file='pic1.png')
racf <- acf(x, par1, main='Autocorrelation', xlab='time lag', ylab='ACF', ci.type=par6, ci=par7, sub=mysub)
dev.off()
bitmap(file='pic2.png')
rpacf <- pacf(x,par1,main='Partial Autocorrelation',xlab='lags',ylab='PACF',sub=mysub)
dev.off()
(myacf <- c(racf$acf))
(mypacf <- c(rpacf$acf))
lengthx <- length(x)
sqrtn <- sqrt(lengthx)
load(file='createtable')
a<-table.start()
a<-table.row.start(a)
a<-table.element(a,'Autocorrelation Function',4,TRUE)
a<-table.row.end(a)
a<-table.row.start(a)
a<-table.element(a,'Time lag k',header=TRUE)
a<-table.element(a,'ACF(k)',header=TRUE)
a<-table.element(a,'T-STAT',header=TRUE)
a<-table.element(a,'P-value',header=TRUE)
a<-table.row.end(a)
for (i in 2:(par1+1)) {
a<-table.row.start(a)
a<-table.element(a,i-1,header=TRUE)
a<-table.element(a,round(myacf[i],6))
mytstat <- myacf[i]*sqrtn
a<-table.element(a,round(mytstat,4))
a<-table.element(a,round(1-pt(abs(mytstat),lengthx),6))
a<-table.row.end(a)
}
a<-table.end(a)
table.save(a,file='mytable.tab')
a<-table.start()
a<-table.row.start(a)
a<-table.element(a,'Partial Autocorrelation Function',4,TRUE)
a<-table.row.end(a)
a<-table.row.start(a)
a<-table.element(a,'Time lag k',header=TRUE)
a<-table.element(a,'PACF(k)',header=TRUE)
a<-table.element(a,'T-STAT',header=TRUE)
a<-table.element(a,'P-value',header=TRUE)
a<-table.row.end(a)
for (i in 1:par1) {
a<-table.row.start(a)
a<-table.element(a,i,header=TRUE)
a<-table.element(a,round(mypacf[i],6))
mytstat <- mypacf[i]*sqrtn
a<-table.element(a,round(mytstat,4))
a<-table.element(a,round(1-pt(abs(mytstat),lengthx),6))
a<-table.row.end(a)
}
a<-table.end(a)
table.save(a,file='mytable1.tab')