Free Statistics

of Irreproducible Research!

Author's title

Author*The author of this computation has been verified*
R Software Modulerwasp_autocorrelation.wasp
Title produced by software(Partial) Autocorrelation Function
Date of computationWed, 25 Jan 2017 10:51:49 +0100
Cite this page as followsStatistical Computations at FreeStatistics.org, Office for Research Development and Education, URL https://freestatistics.org/blog/index.php?v=date/2017/Jan/25/t1485337922yk8v8eevam9vgke.htm/, Retrieved Tue, 14 May 2024 04:19:43 +0000
Statistical Computations at FreeStatistics.org, Office for Research Development and Education, URL https://freestatistics.org/blog/index.php?pk=306413, Retrieved Tue, 14 May 2024 04:19:43 +0000
QR Codes:

Original text written by user:
IsPrivate?No (this computation is public)
User-defined keywords
Estimated Impact56
Family? (F = Feedback message, R = changed R code, M = changed R Module, P = changed Parameters, D = changed Data)
-       [(Partial) Autocorrelation Function] [] [2017-01-25 09:51:49] [cefbb908b49c27a772f794ee9c78d9df] [Current]
Feedback Forum

Post a new message
Dataseries X:
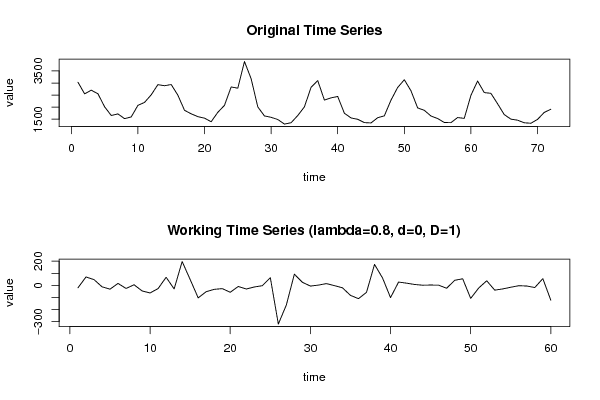
3035
2552
2704
2554
2014
1655
1721
1524
1596
2074
2199
2512
2933
2889
2938
2497
1870
1726
1607
1545
1396
1787
2076
2837
2787
3891
3179
2011
1636
1580
1489
1300
1356
1653
2013
2823
3102
2294
2385
2444
1748
1554
1498
1361
1346
1564
1640
2293
2815
3137
2679
1969
1870
1633
1529
1366
1357
1570
1535
2491
3084
2605
2573
2143
1693
1504
1461
1354
1333
1492
1781
1915


Summary of computational transaction
Raw Input view raw input (R code)
Raw Outputview raw output of R engine
Computing time2 seconds
R ServerBig Analytics Cloud Computing Center

\begin{tabular}{lllllllll}
\hline
Summary of computational transaction \tabularnewline
Raw Input view raw input (R code)  \tabularnewline
Raw Outputview raw output of R engine  \tabularnewline
Computing time2 seconds \tabularnewline
R ServerBig Analytics Cloud Computing Center \tabularnewline
\hline
\end{tabular}
%Source: https://freestatistics.org/blog/index.php?pk=306413&T=0

[TABLE]
[ROW]
Summary of computational transaction[/C][/ROW] [ROW]Raw Input[/C] view raw input (R code) [/C][/ROW] [ROW]Raw Output[/C]view raw output of R engine [/C][/ROW] [ROW]Computing time[/C]2 seconds[/C][/ROW] [ROW]R Server[/C]Big Analytics Cloud Computing Center[/C][/ROW] [/TABLE] Source: https://freestatistics.org/blog/index.php?pk=306413&T=0

Globally Unique Identifier (entire table): ba.freestatistics.org/blog/index.php?pk=306413&T=0

As an alternative you can also use a QR Code:  

The GUIDs for individual cells are displayed in the table below:

Summary of computational transaction
Raw Input view raw input (R code)
Raw Outputview raw output of R engine
Computing time2 seconds
R ServerBig Analytics Cloud Computing Center


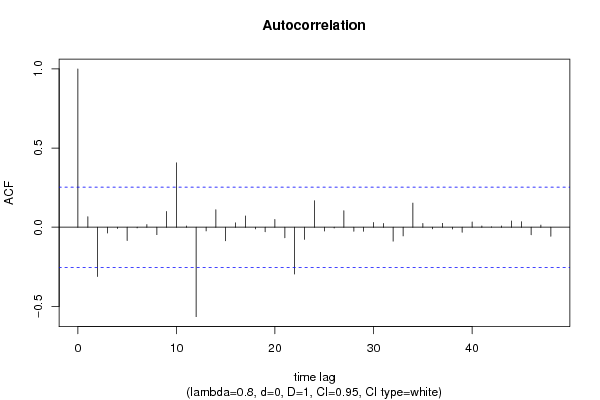
Autocorrelation Function
Time lag kACF(k)T-STATP-value
10.0658050.50970.306057
2-0.310893-2.40820.009561
3-0.036183-0.28030.390116
4-0.0076-0.05890.476627
5-0.083388-0.64590.260396
6-0.004044-0.03130.487556
70.0168190.13030.448391
8-0.046598-0.36090.359703
90.0989820.76670.22313
100.4066983.15030.001272
110.0076320.05910.476528
12-0.564845-4.37532.5e-05
13-0.02324-0.180.428874
140.1109390.85930.196789
15-0.085791-0.66450.254448
160.0277960.21530.415129
170.0710730.55050.292001
18-0.010597-0.08210.467427
19-0.029118-0.22550.41116
200.0495020.38340.351375
21-0.066975-0.51880.302908
22-0.295735-2.29080.012753
23-0.07694-0.5960.276717
240.1675971.29820.099594
25-0.024102-0.18670.426267
26-0.005395-0.04180.483403
270.1039530.80520.211938
28-0.025448-0.19710.4222
29-0.025006-0.19370.423534
300.0300390.23270.408399
310.0238760.18490.42695
32-0.087906-0.68090.249271
33-0.05466-0.42340.336762
340.1522331.17920.121489
350.0236130.18290.427745
36-0.010178-0.07880.468713
370.0246560.1910.424593
38-0.01113-0.08620.465792
39-0.031591-0.24470.40376
400.0329330.25510.399761
410.0083430.06460.474345
420.0008240.00640.497465
430.0078340.06070.475906
440.0391750.30350.381298
450.0345020.26730.395095
46-0.047226-0.36580.357896
470.013450.10420.458686
48-0.056585-0.43830.331369

\begin{tabular}{lllllllll}
\hline
Autocorrelation Function \tabularnewline
Time lag k & ACF(k) & T-STAT & P-value \tabularnewline
1 & 0.065805 & 0.5097 & 0.306057 \tabularnewline
2 & -0.310893 & -2.4082 & 0.009561 \tabularnewline
3 & -0.036183 & -0.2803 & 0.390116 \tabularnewline
4 & -0.0076 & -0.0589 & 0.476627 \tabularnewline
5 & -0.083388 & -0.6459 & 0.260396 \tabularnewline
6 & -0.004044 & -0.0313 & 0.487556 \tabularnewline
7 & 0.016819 & 0.1303 & 0.448391 \tabularnewline
8 & -0.046598 & -0.3609 & 0.359703 \tabularnewline
9 & 0.098982 & 0.7667 & 0.22313 \tabularnewline
10 & 0.406698 & 3.1503 & 0.001272 \tabularnewline
11 & 0.007632 & 0.0591 & 0.476528 \tabularnewline
12 & -0.564845 & -4.3753 & 2.5e-05 \tabularnewline
13 & -0.02324 & -0.18 & 0.428874 \tabularnewline
14 & 0.110939 & 0.8593 & 0.196789 \tabularnewline
15 & -0.085791 & -0.6645 & 0.254448 \tabularnewline
16 & 0.027796 & 0.2153 & 0.415129 \tabularnewline
17 & 0.071073 & 0.5505 & 0.292001 \tabularnewline
18 & -0.010597 & -0.0821 & 0.467427 \tabularnewline
19 & -0.029118 & -0.2255 & 0.41116 \tabularnewline
20 & 0.049502 & 0.3834 & 0.351375 \tabularnewline
21 & -0.066975 & -0.5188 & 0.302908 \tabularnewline
22 & -0.295735 & -2.2908 & 0.012753 \tabularnewline
23 & -0.07694 & -0.596 & 0.276717 \tabularnewline
24 & 0.167597 & 1.2982 & 0.099594 \tabularnewline
25 & -0.024102 & -0.1867 & 0.426267 \tabularnewline
26 & -0.005395 & -0.0418 & 0.483403 \tabularnewline
27 & 0.103953 & 0.8052 & 0.211938 \tabularnewline
28 & -0.025448 & -0.1971 & 0.4222 \tabularnewline
29 & -0.025006 & -0.1937 & 0.423534 \tabularnewline
30 & 0.030039 & 0.2327 & 0.408399 \tabularnewline
31 & 0.023876 & 0.1849 & 0.42695 \tabularnewline
32 & -0.087906 & -0.6809 & 0.249271 \tabularnewline
33 & -0.05466 & -0.4234 & 0.336762 \tabularnewline
34 & 0.152233 & 1.1792 & 0.121489 \tabularnewline
35 & 0.023613 & 0.1829 & 0.427745 \tabularnewline
36 & -0.010178 & -0.0788 & 0.468713 \tabularnewline
37 & 0.024656 & 0.191 & 0.424593 \tabularnewline
38 & -0.01113 & -0.0862 & 0.465792 \tabularnewline
39 & -0.031591 & -0.2447 & 0.40376 \tabularnewline
40 & 0.032933 & 0.2551 & 0.399761 \tabularnewline
41 & 0.008343 & 0.0646 & 0.474345 \tabularnewline
42 & 0.000824 & 0.0064 & 0.497465 \tabularnewline
43 & 0.007834 & 0.0607 & 0.475906 \tabularnewline
44 & 0.039175 & 0.3035 & 0.381298 \tabularnewline
45 & 0.034502 & 0.2673 & 0.395095 \tabularnewline
46 & -0.047226 & -0.3658 & 0.357896 \tabularnewline
47 & 0.01345 & 0.1042 & 0.458686 \tabularnewline
48 & -0.056585 & -0.4383 & 0.331369 \tabularnewline
\hline
\end{tabular}
%Source: https://freestatistics.org/blog/index.php?pk=306413&T=1

[TABLE]
[ROW][C]Autocorrelation Function[/C][/ROW]
[ROW][C]Time lag k[/C][C]ACF(k)[/C][C]T-STAT[/C][C]P-value[/C][/ROW]
[ROW][C]1[/C][C]0.065805[/C][C]0.5097[/C][C]0.306057[/C][/ROW]
[ROW][C]2[/C][C]-0.310893[/C][C]-2.4082[/C][C]0.009561[/C][/ROW]
[ROW][C]3[/C][C]-0.036183[/C][C]-0.2803[/C][C]0.390116[/C][/ROW]
[ROW][C]4[/C][C]-0.0076[/C][C]-0.0589[/C][C]0.476627[/C][/ROW]
[ROW][C]5[/C][C]-0.083388[/C][C]-0.6459[/C][C]0.260396[/C][/ROW]
[ROW][C]6[/C][C]-0.004044[/C][C]-0.0313[/C][C]0.487556[/C][/ROW]
[ROW][C]7[/C][C]0.016819[/C][C]0.1303[/C][C]0.448391[/C][/ROW]
[ROW][C]8[/C][C]-0.046598[/C][C]-0.3609[/C][C]0.359703[/C][/ROW]
[ROW][C]9[/C][C]0.098982[/C][C]0.7667[/C][C]0.22313[/C][/ROW]
[ROW][C]10[/C][C]0.406698[/C][C]3.1503[/C][C]0.001272[/C][/ROW]
[ROW][C]11[/C][C]0.007632[/C][C]0.0591[/C][C]0.476528[/C][/ROW]
[ROW][C]12[/C][C]-0.564845[/C][C]-4.3753[/C][C]2.5e-05[/C][/ROW]
[ROW][C]13[/C][C]-0.02324[/C][C]-0.18[/C][C]0.428874[/C][/ROW]
[ROW][C]14[/C][C]0.110939[/C][C]0.8593[/C][C]0.196789[/C][/ROW]
[ROW][C]15[/C][C]-0.085791[/C][C]-0.6645[/C][C]0.254448[/C][/ROW]
[ROW][C]16[/C][C]0.027796[/C][C]0.2153[/C][C]0.415129[/C][/ROW]
[ROW][C]17[/C][C]0.071073[/C][C]0.5505[/C][C]0.292001[/C][/ROW]
[ROW][C]18[/C][C]-0.010597[/C][C]-0.0821[/C][C]0.467427[/C][/ROW]
[ROW][C]19[/C][C]-0.029118[/C][C]-0.2255[/C][C]0.41116[/C][/ROW]
[ROW][C]20[/C][C]0.049502[/C][C]0.3834[/C][C]0.351375[/C][/ROW]
[ROW][C]21[/C][C]-0.066975[/C][C]-0.5188[/C][C]0.302908[/C][/ROW]
[ROW][C]22[/C][C]-0.295735[/C][C]-2.2908[/C][C]0.012753[/C][/ROW]
[ROW][C]23[/C][C]-0.07694[/C][C]-0.596[/C][C]0.276717[/C][/ROW]
[ROW][C]24[/C][C]0.167597[/C][C]1.2982[/C][C]0.099594[/C][/ROW]
[ROW][C]25[/C][C]-0.024102[/C][C]-0.1867[/C][C]0.426267[/C][/ROW]
[ROW][C]26[/C][C]-0.005395[/C][C]-0.0418[/C][C]0.483403[/C][/ROW]
[ROW][C]27[/C][C]0.103953[/C][C]0.8052[/C][C]0.211938[/C][/ROW]
[ROW][C]28[/C][C]-0.025448[/C][C]-0.1971[/C][C]0.4222[/C][/ROW]
[ROW][C]29[/C][C]-0.025006[/C][C]-0.1937[/C][C]0.423534[/C][/ROW]
[ROW][C]30[/C][C]0.030039[/C][C]0.2327[/C][C]0.408399[/C][/ROW]
[ROW][C]31[/C][C]0.023876[/C][C]0.1849[/C][C]0.42695[/C][/ROW]
[ROW][C]32[/C][C]-0.087906[/C][C]-0.6809[/C][C]0.249271[/C][/ROW]
[ROW][C]33[/C][C]-0.05466[/C][C]-0.4234[/C][C]0.336762[/C][/ROW]
[ROW][C]34[/C][C]0.152233[/C][C]1.1792[/C][C]0.121489[/C][/ROW]
[ROW][C]35[/C][C]0.023613[/C][C]0.1829[/C][C]0.427745[/C][/ROW]
[ROW][C]36[/C][C]-0.010178[/C][C]-0.0788[/C][C]0.468713[/C][/ROW]
[ROW][C]37[/C][C]0.024656[/C][C]0.191[/C][C]0.424593[/C][/ROW]
[ROW][C]38[/C][C]-0.01113[/C][C]-0.0862[/C][C]0.465792[/C][/ROW]
[ROW][C]39[/C][C]-0.031591[/C][C]-0.2447[/C][C]0.40376[/C][/ROW]
[ROW][C]40[/C][C]0.032933[/C][C]0.2551[/C][C]0.399761[/C][/ROW]
[ROW][C]41[/C][C]0.008343[/C][C]0.0646[/C][C]0.474345[/C][/ROW]
[ROW][C]42[/C][C]0.000824[/C][C]0.0064[/C][C]0.497465[/C][/ROW]
[ROW][C]43[/C][C]0.007834[/C][C]0.0607[/C][C]0.475906[/C][/ROW]
[ROW][C]44[/C][C]0.039175[/C][C]0.3035[/C][C]0.381298[/C][/ROW]
[ROW][C]45[/C][C]0.034502[/C][C]0.2673[/C][C]0.395095[/C][/ROW]
[ROW][C]46[/C][C]-0.047226[/C][C]-0.3658[/C][C]0.357896[/C][/ROW]
[ROW][C]47[/C][C]0.01345[/C][C]0.1042[/C][C]0.458686[/C][/ROW]
[ROW][C]48[/C][C]-0.056585[/C][C]-0.4383[/C][C]0.331369[/C][/ROW]
[/TABLE]
Source: https://freestatistics.org/blog/index.php?pk=306413&T=1

Globally Unique Identifier (entire table): ba.freestatistics.org/blog/index.php?pk=306413&T=1

As an alternative you can also use a QR Code:  

The GUIDs for individual cells are displayed in the table below:

Autocorrelation Function
Time lag kACF(k)T-STATP-value
10.0658050.50970.306057
2-0.310893-2.40820.009561
3-0.036183-0.28030.390116
4-0.0076-0.05890.476627
5-0.083388-0.64590.260396
6-0.004044-0.03130.487556
70.0168190.13030.448391
8-0.046598-0.36090.359703
90.0989820.76670.22313
100.4066983.15030.001272
110.0076320.05910.476528
12-0.564845-4.37532.5e-05
13-0.02324-0.180.428874
140.1109390.85930.196789
15-0.085791-0.66450.254448
160.0277960.21530.415129
170.0710730.55050.292001
18-0.010597-0.08210.467427
19-0.029118-0.22550.41116
200.0495020.38340.351375
21-0.066975-0.51880.302908
22-0.295735-2.29080.012753
23-0.07694-0.5960.276717
240.1675971.29820.099594
25-0.024102-0.18670.426267
26-0.005395-0.04180.483403
270.1039530.80520.211938
28-0.025448-0.19710.4222
29-0.025006-0.19370.423534
300.0300390.23270.408399
310.0238760.18490.42695
32-0.087906-0.68090.249271
33-0.05466-0.42340.336762
340.1522331.17920.121489
350.0236130.18290.427745
36-0.010178-0.07880.468713
370.0246560.1910.424593
38-0.01113-0.08620.465792
39-0.031591-0.24470.40376
400.0329330.25510.399761
410.0083430.06460.474345
420.0008240.00640.497465
430.0078340.06070.475906
440.0391750.30350.381298
450.0345020.26730.395095
46-0.047226-0.36580.357896
470.013450.10420.458686
48-0.056585-0.43830.331369


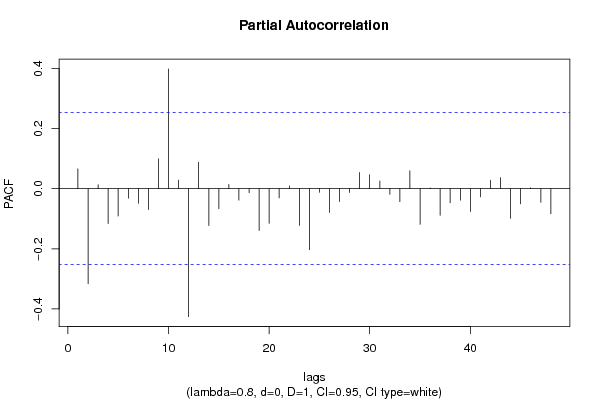
Partial Autocorrelation Function
Time lag kPACF(k)T-STATP-value
10.0658050.50970.306057
2-0.316594-2.45230.00856
30.0129330.10020.46027
4-0.116044-0.89890.186158
5-0.091197-0.70640.241334
6-0.031605-0.24480.403718
7-0.048403-0.37490.354519
8-0.0696-0.53910.2959
90.0992560.76880.222503
100.3984433.08630.001532
110.0285180.22090.412961
12-0.425944-3.29940.000817
130.0877160.67940.249733
14-0.122717-0.95060.17282
15-0.067149-0.52010.302442
160.0136710.10590.458009
17-0.038224-0.29610.384095
18-0.013899-0.10770.457311
19-0.139208-1.07830.142607
20-0.115233-0.89260.18782
21-0.030609-0.23710.406694
220.0086870.06730.473287
23-0.122299-0.94730.173637
24-0.202878-1.57150.060665
25-0.011964-0.09270.463236
26-0.079455-0.61550.270291
27-0.042604-0.330.37127
28-0.012686-0.09830.461026
290.0539480.41790.338764
300.0466060.3610.35968
310.0253840.19660.422394
32-0.018795-0.14560.442369
33-0.043161-0.33430.369651
340.0592280.45880.324024
35-0.118745-0.91980.180681
360.0025010.01940.492305
37-0.088463-0.68520.247919
38-0.047097-0.36480.358267
39-0.038278-0.29650.383935
40-0.075855-0.58760.279513
41-0.02723-0.21090.416831
420.0278710.21590.414904
430.0368410.28540.388173
44-0.09823-0.76090.224853
45-0.050536-0.39150.348425
460.0026830.02080.491743
47-0.04501-0.34860.364288
48-0.083312-0.64530.260587

\begin{tabular}{lllllllll}
\hline
Partial Autocorrelation Function \tabularnewline
Time lag k & PACF(k) & T-STAT & P-value \tabularnewline
1 & 0.065805 & 0.5097 & 0.306057 \tabularnewline
2 & -0.316594 & -2.4523 & 0.00856 \tabularnewline
3 & 0.012933 & 0.1002 & 0.46027 \tabularnewline
4 & -0.116044 & -0.8989 & 0.186158 \tabularnewline
5 & -0.091197 & -0.7064 & 0.241334 \tabularnewline
6 & -0.031605 & -0.2448 & 0.403718 \tabularnewline
7 & -0.048403 & -0.3749 & 0.354519 \tabularnewline
8 & -0.0696 & -0.5391 & 0.2959 \tabularnewline
9 & 0.099256 & 0.7688 & 0.222503 \tabularnewline
10 & 0.398443 & 3.0863 & 0.001532 \tabularnewline
11 & 0.028518 & 0.2209 & 0.412961 \tabularnewline
12 & -0.425944 & -3.2994 & 0.000817 \tabularnewline
13 & 0.087716 & 0.6794 & 0.249733 \tabularnewline
14 & -0.122717 & -0.9506 & 0.17282 \tabularnewline
15 & -0.067149 & -0.5201 & 0.302442 \tabularnewline
16 & 0.013671 & 0.1059 & 0.458009 \tabularnewline
17 & -0.038224 & -0.2961 & 0.384095 \tabularnewline
18 & -0.013899 & -0.1077 & 0.457311 \tabularnewline
19 & -0.139208 & -1.0783 & 0.142607 \tabularnewline
20 & -0.115233 & -0.8926 & 0.18782 \tabularnewline
21 & -0.030609 & -0.2371 & 0.406694 \tabularnewline
22 & 0.008687 & 0.0673 & 0.473287 \tabularnewline
23 & -0.122299 & -0.9473 & 0.173637 \tabularnewline
24 & -0.202878 & -1.5715 & 0.060665 \tabularnewline
25 & -0.011964 & -0.0927 & 0.463236 \tabularnewline
26 & -0.079455 & -0.6155 & 0.270291 \tabularnewline
27 & -0.042604 & -0.33 & 0.37127 \tabularnewline
28 & -0.012686 & -0.0983 & 0.461026 \tabularnewline
29 & 0.053948 & 0.4179 & 0.338764 \tabularnewline
30 & 0.046606 & 0.361 & 0.35968 \tabularnewline
31 & 0.025384 & 0.1966 & 0.422394 \tabularnewline
32 & -0.018795 & -0.1456 & 0.442369 \tabularnewline
33 & -0.043161 & -0.3343 & 0.369651 \tabularnewline
34 & 0.059228 & 0.4588 & 0.324024 \tabularnewline
35 & -0.118745 & -0.9198 & 0.180681 \tabularnewline
36 & 0.002501 & 0.0194 & 0.492305 \tabularnewline
37 & -0.088463 & -0.6852 & 0.247919 \tabularnewline
38 & -0.047097 & -0.3648 & 0.358267 \tabularnewline
39 & -0.038278 & -0.2965 & 0.383935 \tabularnewline
40 & -0.075855 & -0.5876 & 0.279513 \tabularnewline
41 & -0.02723 & -0.2109 & 0.416831 \tabularnewline
42 & 0.027871 & 0.2159 & 0.414904 \tabularnewline
43 & 0.036841 & 0.2854 & 0.388173 \tabularnewline
44 & -0.09823 & -0.7609 & 0.224853 \tabularnewline
45 & -0.050536 & -0.3915 & 0.348425 \tabularnewline
46 & 0.002683 & 0.0208 & 0.491743 \tabularnewline
47 & -0.04501 & -0.3486 & 0.364288 \tabularnewline
48 & -0.083312 & -0.6453 & 0.260587 \tabularnewline
\hline
\end{tabular}
%Source: https://freestatistics.org/blog/index.php?pk=306413&T=2

[TABLE]
[ROW][C]Partial Autocorrelation Function[/C][/ROW]
[ROW][C]Time lag k[/C][C]PACF(k)[/C][C]T-STAT[/C][C]P-value[/C][/ROW]
[ROW][C]1[/C][C]0.065805[/C][C]0.5097[/C][C]0.306057[/C][/ROW]
[ROW][C]2[/C][C]-0.316594[/C][C]-2.4523[/C][C]0.00856[/C][/ROW]
[ROW][C]3[/C][C]0.012933[/C][C]0.1002[/C][C]0.46027[/C][/ROW]
[ROW][C]4[/C][C]-0.116044[/C][C]-0.8989[/C][C]0.186158[/C][/ROW]
[ROW][C]5[/C][C]-0.091197[/C][C]-0.7064[/C][C]0.241334[/C][/ROW]
[ROW][C]6[/C][C]-0.031605[/C][C]-0.2448[/C][C]0.403718[/C][/ROW]
[ROW][C]7[/C][C]-0.048403[/C][C]-0.3749[/C][C]0.354519[/C][/ROW]
[ROW][C]8[/C][C]-0.0696[/C][C]-0.5391[/C][C]0.2959[/C][/ROW]
[ROW][C]9[/C][C]0.099256[/C][C]0.7688[/C][C]0.222503[/C][/ROW]
[ROW][C]10[/C][C]0.398443[/C][C]3.0863[/C][C]0.001532[/C][/ROW]
[ROW][C]11[/C][C]0.028518[/C][C]0.2209[/C][C]0.412961[/C][/ROW]
[ROW][C]12[/C][C]-0.425944[/C][C]-3.2994[/C][C]0.000817[/C][/ROW]
[ROW][C]13[/C][C]0.087716[/C][C]0.6794[/C][C]0.249733[/C][/ROW]
[ROW][C]14[/C][C]-0.122717[/C][C]-0.9506[/C][C]0.17282[/C][/ROW]
[ROW][C]15[/C][C]-0.067149[/C][C]-0.5201[/C][C]0.302442[/C][/ROW]
[ROW][C]16[/C][C]0.013671[/C][C]0.1059[/C][C]0.458009[/C][/ROW]
[ROW][C]17[/C][C]-0.038224[/C][C]-0.2961[/C][C]0.384095[/C][/ROW]
[ROW][C]18[/C][C]-0.013899[/C][C]-0.1077[/C][C]0.457311[/C][/ROW]
[ROW][C]19[/C][C]-0.139208[/C][C]-1.0783[/C][C]0.142607[/C][/ROW]
[ROW][C]20[/C][C]-0.115233[/C][C]-0.8926[/C][C]0.18782[/C][/ROW]
[ROW][C]21[/C][C]-0.030609[/C][C]-0.2371[/C][C]0.406694[/C][/ROW]
[ROW][C]22[/C][C]0.008687[/C][C]0.0673[/C][C]0.473287[/C][/ROW]
[ROW][C]23[/C][C]-0.122299[/C][C]-0.9473[/C][C]0.173637[/C][/ROW]
[ROW][C]24[/C][C]-0.202878[/C][C]-1.5715[/C][C]0.060665[/C][/ROW]
[ROW][C]25[/C][C]-0.011964[/C][C]-0.0927[/C][C]0.463236[/C][/ROW]
[ROW][C]26[/C][C]-0.079455[/C][C]-0.6155[/C][C]0.270291[/C][/ROW]
[ROW][C]27[/C][C]-0.042604[/C][C]-0.33[/C][C]0.37127[/C][/ROW]
[ROW][C]28[/C][C]-0.012686[/C][C]-0.0983[/C][C]0.461026[/C][/ROW]
[ROW][C]29[/C][C]0.053948[/C][C]0.4179[/C][C]0.338764[/C][/ROW]
[ROW][C]30[/C][C]0.046606[/C][C]0.361[/C][C]0.35968[/C][/ROW]
[ROW][C]31[/C][C]0.025384[/C][C]0.1966[/C][C]0.422394[/C][/ROW]
[ROW][C]32[/C][C]-0.018795[/C][C]-0.1456[/C][C]0.442369[/C][/ROW]
[ROW][C]33[/C][C]-0.043161[/C][C]-0.3343[/C][C]0.369651[/C][/ROW]
[ROW][C]34[/C][C]0.059228[/C][C]0.4588[/C][C]0.324024[/C][/ROW]
[ROW][C]35[/C][C]-0.118745[/C][C]-0.9198[/C][C]0.180681[/C][/ROW]
[ROW][C]36[/C][C]0.002501[/C][C]0.0194[/C][C]0.492305[/C][/ROW]
[ROW][C]37[/C][C]-0.088463[/C][C]-0.6852[/C][C]0.247919[/C][/ROW]
[ROW][C]38[/C][C]-0.047097[/C][C]-0.3648[/C][C]0.358267[/C][/ROW]
[ROW][C]39[/C][C]-0.038278[/C][C]-0.2965[/C][C]0.383935[/C][/ROW]
[ROW][C]40[/C][C]-0.075855[/C][C]-0.5876[/C][C]0.279513[/C][/ROW]
[ROW][C]41[/C][C]-0.02723[/C][C]-0.2109[/C][C]0.416831[/C][/ROW]
[ROW][C]42[/C][C]0.027871[/C][C]0.2159[/C][C]0.414904[/C][/ROW]
[ROW][C]43[/C][C]0.036841[/C][C]0.2854[/C][C]0.388173[/C][/ROW]
[ROW][C]44[/C][C]-0.09823[/C][C]-0.7609[/C][C]0.224853[/C][/ROW]
[ROW][C]45[/C][C]-0.050536[/C][C]-0.3915[/C][C]0.348425[/C][/ROW]
[ROW][C]46[/C][C]0.002683[/C][C]0.0208[/C][C]0.491743[/C][/ROW]
[ROW][C]47[/C][C]-0.04501[/C][C]-0.3486[/C][C]0.364288[/C][/ROW]
[ROW][C]48[/C][C]-0.083312[/C][C]-0.6453[/C][C]0.260587[/C][/ROW]
[/TABLE]
Source: https://freestatistics.org/blog/index.php?pk=306413&T=2

Globally Unique Identifier (entire table): ba.freestatistics.org/blog/index.php?pk=306413&T=2

As an alternative you can also use a QR Code:  

The GUIDs for individual cells are displayed in the table below:

Partial Autocorrelation Function
Time lag kPACF(k)T-STATP-value
10.0658050.50970.306057
2-0.316594-2.45230.00856
30.0129330.10020.46027
4-0.116044-0.89890.186158
5-0.091197-0.70640.241334
6-0.031605-0.24480.403718
7-0.048403-0.37490.354519
8-0.0696-0.53910.2959
90.0992560.76880.222503
100.3984433.08630.001532
110.0285180.22090.412961
12-0.425944-3.29940.000817
130.0877160.67940.249733
14-0.122717-0.95060.17282
15-0.067149-0.52010.302442
160.0136710.10590.458009
17-0.038224-0.29610.384095
18-0.013899-0.10770.457311
19-0.139208-1.07830.142607
20-0.115233-0.89260.18782
21-0.030609-0.23710.406694
220.0086870.06730.473287
23-0.122299-0.94730.173637
24-0.202878-1.57150.060665
25-0.011964-0.09270.463236
26-0.079455-0.61550.270291
27-0.042604-0.330.37127
28-0.012686-0.09830.461026
290.0539480.41790.338764
300.0466060.3610.35968
310.0253840.19660.422394
32-0.018795-0.14560.442369
33-0.043161-0.33430.369651
340.0592280.45880.324024
35-0.118745-0.91980.180681
360.0025010.01940.492305
37-0.088463-0.68520.247919
38-0.047097-0.36480.358267
39-0.038278-0.29650.383935
40-0.075855-0.58760.279513
41-0.02723-0.21090.416831
420.0278710.21590.414904
430.0368410.28540.388173
44-0.09823-0.76090.224853
45-0.050536-0.39150.348425
460.0026830.02080.491743
47-0.04501-0.34860.364288
48-0.083312-0.64530.260587


Parameters (Session):
par1 = 1 ; par2 = 2 ; par3 = Pearson Chi-Squared ;
Parameters (R input):
par1 = 48 ; par2 = 0.8 ; par3 = 0 ; par4 = 1 ; par5 = 12 ; par6 = White Noise ; par7 = 0.95 ; par8 = ;
R code (references can be found in the software module):
par8 <- ''
par7 <- '0.95'
par6 <- 'White Noise'
par5 <- '12'
par4 <- '0'
par3 <- '0'
par2 <- '0.2'
par1 <- '48'
if (par1 == 'Default') {
par1 = 10*log10(length(x))
} else {
par1 <- as.numeric(par1)
}
par2 <- as.numeric(par2)
par3 <- as.numeric(par3)
par4 <- as.numeric(par4)
par5 <- as.numeric(par5)
if (par6 == 'White Noise') par6 <- 'white' else par6 <- 'ma'
par7 <- as.numeric(par7)
if (par8 != '') par8 <- as.numeric(par8)
x <- na.omit(x)
ox <- x
if (par8 == '') {
if (par2 == 0) {
x <- log(x)
} else {
x <- (x ^ par2 - 1) / par2
}
} else {
x <- log(x,base=par8)
}
if (par3 > 0) x <- diff(x,lag=1,difference=par3)
if (par4 > 0) x <- diff(x,lag=par5,difference=par4)
bitmap(file='picts.png')
op <- par(mfrow=c(2,1))
plot(ox,type='l',main='Original Time Series',xlab='time',ylab='value')
if (par8=='') {
mytitle <- paste('Working Time Series (lambda=',par2,', d=',par3,', D=',par4,')',sep='')
mysub <- paste('(lambda=',par2,', d=',par3,', D=',par4,', CI=', par7, ', CI type=',par6,')',sep='')
} else {
mytitle <- paste('Working Time Series (base=',par8,', d=',par3,', D=',par4,')',sep='')
mysub <- paste('(base=',par8,', d=',par3,', D=',par4,', CI=', par7, ', CI type=',par6,')',sep='')
}
plot(x,type='l', main=mytitle,xlab='time',ylab='value')
par(op)
dev.off()
bitmap(file='pic1.png')
racf <- acf(x, par1, main='Autocorrelation', xlab='time lag', ylab='ACF', ci.type=par6, ci=par7, sub=mysub)
dev.off()
bitmap(file='pic2.png')
rpacf <- pacf(x,par1,main='Partial Autocorrelation',xlab='lags',ylab='PACF',sub=mysub)
dev.off()
(myacf <- c(racf$acf))
(mypacf <- c(rpacf$acf))
lengthx <- length(x)
sqrtn <- sqrt(lengthx)
load(file='createtable')
a<-table.start()
a<-table.row.start(a)
a<-table.element(a,'Autocorrelation Function',4,TRUE)
a<-table.row.end(a)
a<-table.row.start(a)
a<-table.element(a,'Time lag k',header=TRUE)
a<-table.element(a,'ACF(k)',header=TRUE)
a<-table.element(a,'T-STAT',header=TRUE)
a<-table.element(a,'P-value',header=TRUE)
a<-table.row.end(a)
for (i in 2:(par1+1)) {
a<-table.row.start(a)
a<-table.element(a,i-1,header=TRUE)
a<-table.element(a,round(myacf[i],6))
mytstat <- myacf[i]*sqrtn
a<-table.element(a,round(mytstat,4))
a<-table.element(a,round(1-pt(abs(mytstat),lengthx),6))
a<-table.row.end(a)
}
a<-table.end(a)
table.save(a,file='mytable.tab')
a<-table.start()
a<-table.row.start(a)
a<-table.element(a,'Partial Autocorrelation Function',4,TRUE)
a<-table.row.end(a)
a<-table.row.start(a)
a<-table.element(a,'Time lag k',header=TRUE)
a<-table.element(a,'PACF(k)',header=TRUE)
a<-table.element(a,'T-STAT',header=TRUE)
a<-table.element(a,'P-value',header=TRUE)
a<-table.row.end(a)
for (i in 1:par1) {
a<-table.row.start(a)
a<-table.element(a,i,header=TRUE)
a<-table.element(a,round(mypacf[i],6))
mytstat <- mypacf[i]*sqrtn
a<-table.element(a,round(mytstat,4))
a<-table.element(a,round(1-pt(abs(mytstat),lengthx),6))
a<-table.row.end(a)
}
a<-table.end(a)
table.save(a,file='mytable1.tab')