Free Statistics

of Irreproducible Research!

Author's title

Author*The author of this computation has been verified*
R Software Modulerwasp_autocorrelation.wasp
Title produced by software(Partial) Autocorrelation Function
Date of computationMon, 23 Jan 2017 12:28:24 +0100
Cite this page as followsStatistical Computations at FreeStatistics.org, Office for Research Development and Education, URL https://freestatistics.org/blog/index.php?v=date/2017/Jan/23/t1485170926ljhjfphhhuil0jk.htm/, Retrieved Wed, 15 May 2024 11:00:45 +0000
Statistical Computations at FreeStatistics.org, Office for Research Development and Education, URL https://freestatistics.org/blog/index.php?pk=305063, Retrieved Wed, 15 May 2024 11:00:45 +0000
QR Codes:

Original text written by user:
IsPrivate?No (this computation is public)
User-defined keywords
Estimated Impact70
Family? (F = Feedback message, R = changed R code, M = changed R Module, P = changed Parameters, D = changed Data)
-       [(Partial) Autocorrelation Function] [] [2017-01-23 11:28:24] [1e2c9196efc58119c3757b6c78ac7c5f] [Current]
Feedback Forum

Post a new message
Dataseries X:
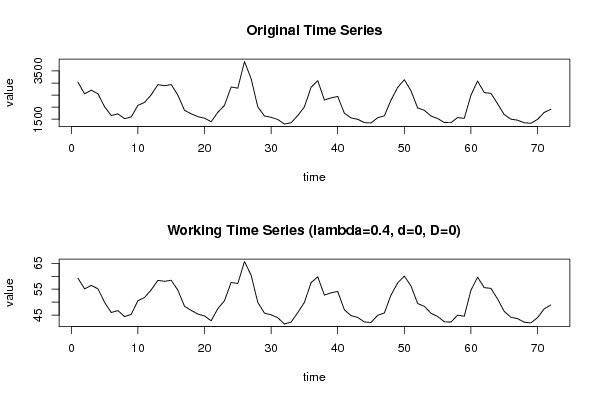
3035
2552
2704
2554
2014
1655
1721
1524
1596
2074
2199
2512
2933
2889
2938
2497
1870
1726
1607
1545
1396
1787
2076
2837
2787
3891
3179
2011
1636
1580
1489
1300
1356
1653
2013
2823
3102
2294
2385
2444
1748
1554
1498
1361
1346
1564
1640
2293
2815
3137
2679
1969
1870
1633
1529
1366
1357
1570
1535
2491
3084
2605
2573
2143
1693
1504
1461
1354
1333
1492
1781
1915


Summary of computational transaction
Raw Input view raw input (R code)
Raw Outputview raw output of R engine
Computing time2 seconds
R ServerBig Analytics Cloud Computing Center

\begin{tabular}{lllllllll}
\hline
Summary of computational transaction \tabularnewline
Raw Input view raw input (R code)  \tabularnewline
Raw Outputview raw output of R engine  \tabularnewline
Computing time2 seconds \tabularnewline
R ServerBig Analytics Cloud Computing Center \tabularnewline
\hline
\end{tabular}
%Source: https://freestatistics.org/blog/index.php?pk=305063&T=0

[TABLE]
[ROW]
Summary of computational transaction[/C][/ROW] [ROW]Raw Input[/C] view raw input (R code) [/C][/ROW] [ROW]Raw Output[/C]view raw output of R engine [/C][/ROW] [ROW]Computing time[/C]2 seconds[/C][/ROW] [ROW]R Server[/C]Big Analytics Cloud Computing Center[/C][/ROW] [/TABLE] Source: https://freestatistics.org/blog/index.php?pk=305063&T=0

Globally Unique Identifier (entire table): ba.freestatistics.org/blog/index.php?pk=305063&T=0

As an alternative you can also use a QR Code:  

The GUIDs for individual cells are displayed in the table below:

Summary of computational transaction
Raw Input view raw input (R code)
Raw Outputview raw output of R engine
Computing time2 seconds
R ServerBig Analytics Cloud Computing Center


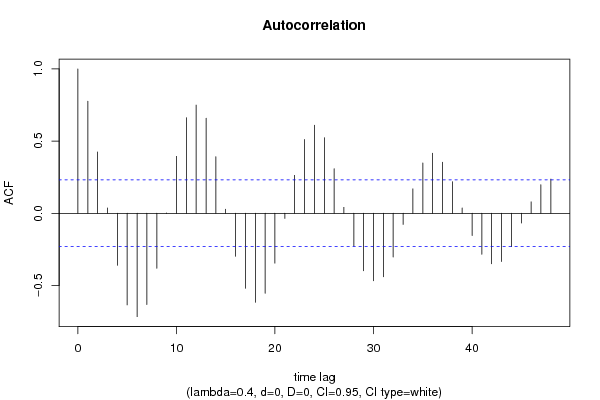
Autocorrelation Function
Time lag kACF(k)T-STATP-value
10.7759846.58440
20.4249953.60620.000285
30.0363360.30830.379363
4-0.359845-3.05340.001585
5-0.635236-5.39020
6-0.716543-6.08010
7-0.632608-5.36790
8-0.381273-3.23520.000919
90.0017390.01480.494132
100.3942053.34490.000655
110.6624485.62110
120.749256.35760
130.6580755.5840
140.3920323.32650.000693
150.0275080.23340.408052
16-0.298354-2.53160.006769
17-0.519597-4.40891.8e-05
18-0.616502-5.23121e-06
19-0.554131-4.7026e-06
20-0.345902-2.93510.002236
21-0.035813-0.30390.381047
220.2627492.22950.01445
230.5111874.33762.3e-05
240.6096375.17291e-06
250.5238134.44471.6e-05
260.3078992.61260.005466
270.0406250.34470.365656
28-0.227351-1.92910.028828
29-0.399093-3.38640.000575
30-0.467494-3.96688.5e-05
31-0.440577-3.73840.000184
32-0.303576-2.57590.006025
33-0.077301-0.65590.256982
340.1692621.43620.077633
350.3487652.95940.002085
360.4163683.5330.000361
370.3532112.99710.001869
380.2180191.84990.034212
390.0361680.30690.379905
40-0.154382-1.310.097184
41-0.284063-2.41040.009246
42-0.350242-2.97190.002011
43-0.334087-2.83480.002974
44-0.23135-1.96310.026751
45-0.067053-0.5690.285576
460.0791620.67170.251959
470.1970421.6720.049437
480.2365732.00740.024231

\begin{tabular}{lllllllll}
\hline
Autocorrelation Function \tabularnewline
Time lag k & ACF(k) & T-STAT & P-value \tabularnewline
1 & 0.775984 & 6.5844 & 0 \tabularnewline
2 & 0.424995 & 3.6062 & 0.000285 \tabularnewline
3 & 0.036336 & 0.3083 & 0.379363 \tabularnewline
4 & -0.359845 & -3.0534 & 0.001585 \tabularnewline
5 & -0.635236 & -5.3902 & 0 \tabularnewline
6 & -0.716543 & -6.0801 & 0 \tabularnewline
7 & -0.632608 & -5.3679 & 0 \tabularnewline
8 & -0.381273 & -3.2352 & 0.000919 \tabularnewline
9 & 0.001739 & 0.0148 & 0.494132 \tabularnewline
10 & 0.394205 & 3.3449 & 0.000655 \tabularnewline
11 & 0.662448 & 5.6211 & 0 \tabularnewline
12 & 0.74925 & 6.3576 & 0 \tabularnewline
13 & 0.658075 & 5.584 & 0 \tabularnewline
14 & 0.392032 & 3.3265 & 0.000693 \tabularnewline
15 & 0.027508 & 0.2334 & 0.408052 \tabularnewline
16 & -0.298354 & -2.5316 & 0.006769 \tabularnewline
17 & -0.519597 & -4.4089 & 1.8e-05 \tabularnewline
18 & -0.616502 & -5.2312 & 1e-06 \tabularnewline
19 & -0.554131 & -4.702 & 6e-06 \tabularnewline
20 & -0.345902 & -2.9351 & 0.002236 \tabularnewline
21 & -0.035813 & -0.3039 & 0.381047 \tabularnewline
22 & 0.262749 & 2.2295 & 0.01445 \tabularnewline
23 & 0.511187 & 4.3376 & 2.3e-05 \tabularnewline
24 & 0.609637 & 5.1729 & 1e-06 \tabularnewline
25 & 0.523813 & 4.4447 & 1.6e-05 \tabularnewline
26 & 0.307899 & 2.6126 & 0.005466 \tabularnewline
27 & 0.040625 & 0.3447 & 0.365656 \tabularnewline
28 & -0.227351 & -1.9291 & 0.028828 \tabularnewline
29 & -0.399093 & -3.3864 & 0.000575 \tabularnewline
30 & -0.467494 & -3.9668 & 8.5e-05 \tabularnewline
31 & -0.440577 & -3.7384 & 0.000184 \tabularnewline
32 & -0.303576 & -2.5759 & 0.006025 \tabularnewline
33 & -0.077301 & -0.6559 & 0.256982 \tabularnewline
34 & 0.169262 & 1.4362 & 0.077633 \tabularnewline
35 & 0.348765 & 2.9594 & 0.002085 \tabularnewline
36 & 0.416368 & 3.533 & 0.000361 \tabularnewline
37 & 0.353211 & 2.9971 & 0.001869 \tabularnewline
38 & 0.218019 & 1.8499 & 0.034212 \tabularnewline
39 & 0.036168 & 0.3069 & 0.379905 \tabularnewline
40 & -0.154382 & -1.31 & 0.097184 \tabularnewline
41 & -0.284063 & -2.4104 & 0.009246 \tabularnewline
42 & -0.350242 & -2.9719 & 0.002011 \tabularnewline
43 & -0.334087 & -2.8348 & 0.002974 \tabularnewline
44 & -0.23135 & -1.9631 & 0.026751 \tabularnewline
45 & -0.067053 & -0.569 & 0.285576 \tabularnewline
46 & 0.079162 & 0.6717 & 0.251959 \tabularnewline
47 & 0.197042 & 1.672 & 0.049437 \tabularnewline
48 & 0.236573 & 2.0074 & 0.024231 \tabularnewline
\hline
\end{tabular}
%Source: https://freestatistics.org/blog/index.php?pk=305063&T=1

[TABLE]
[ROW][C]Autocorrelation Function[/C][/ROW]
[ROW][C]Time lag k[/C][C]ACF(k)[/C][C]T-STAT[/C][C]P-value[/C][/ROW]
[ROW][C]1[/C][C]0.775984[/C][C]6.5844[/C][C]0[/C][/ROW]
[ROW][C]2[/C][C]0.424995[/C][C]3.6062[/C][C]0.000285[/C][/ROW]
[ROW][C]3[/C][C]0.036336[/C][C]0.3083[/C][C]0.379363[/C][/ROW]
[ROW][C]4[/C][C]-0.359845[/C][C]-3.0534[/C][C]0.001585[/C][/ROW]
[ROW][C]5[/C][C]-0.635236[/C][C]-5.3902[/C][C]0[/C][/ROW]
[ROW][C]6[/C][C]-0.716543[/C][C]-6.0801[/C][C]0[/C][/ROW]
[ROW][C]7[/C][C]-0.632608[/C][C]-5.3679[/C][C]0[/C][/ROW]
[ROW][C]8[/C][C]-0.381273[/C][C]-3.2352[/C][C]0.000919[/C][/ROW]
[ROW][C]9[/C][C]0.001739[/C][C]0.0148[/C][C]0.494132[/C][/ROW]
[ROW][C]10[/C][C]0.394205[/C][C]3.3449[/C][C]0.000655[/C][/ROW]
[ROW][C]11[/C][C]0.662448[/C][C]5.6211[/C][C]0[/C][/ROW]
[ROW][C]12[/C][C]0.74925[/C][C]6.3576[/C][C]0[/C][/ROW]
[ROW][C]13[/C][C]0.658075[/C][C]5.584[/C][C]0[/C][/ROW]
[ROW][C]14[/C][C]0.392032[/C][C]3.3265[/C][C]0.000693[/C][/ROW]
[ROW][C]15[/C][C]0.027508[/C][C]0.2334[/C][C]0.408052[/C][/ROW]
[ROW][C]16[/C][C]-0.298354[/C][C]-2.5316[/C][C]0.006769[/C][/ROW]
[ROW][C]17[/C][C]-0.519597[/C][C]-4.4089[/C][C]1.8e-05[/C][/ROW]
[ROW][C]18[/C][C]-0.616502[/C][C]-5.2312[/C][C]1e-06[/C][/ROW]
[ROW][C]19[/C][C]-0.554131[/C][C]-4.702[/C][C]6e-06[/C][/ROW]
[ROW][C]20[/C][C]-0.345902[/C][C]-2.9351[/C][C]0.002236[/C][/ROW]
[ROW][C]21[/C][C]-0.035813[/C][C]-0.3039[/C][C]0.381047[/C][/ROW]
[ROW][C]22[/C][C]0.262749[/C][C]2.2295[/C][C]0.01445[/C][/ROW]
[ROW][C]23[/C][C]0.511187[/C][C]4.3376[/C][C]2.3e-05[/C][/ROW]
[ROW][C]24[/C][C]0.609637[/C][C]5.1729[/C][C]1e-06[/C][/ROW]
[ROW][C]25[/C][C]0.523813[/C][C]4.4447[/C][C]1.6e-05[/C][/ROW]
[ROW][C]26[/C][C]0.307899[/C][C]2.6126[/C][C]0.005466[/C][/ROW]
[ROW][C]27[/C][C]0.040625[/C][C]0.3447[/C][C]0.365656[/C][/ROW]
[ROW][C]28[/C][C]-0.227351[/C][C]-1.9291[/C][C]0.028828[/C][/ROW]
[ROW][C]29[/C][C]-0.399093[/C][C]-3.3864[/C][C]0.000575[/C][/ROW]
[ROW][C]30[/C][C]-0.467494[/C][C]-3.9668[/C][C]8.5e-05[/C][/ROW]
[ROW][C]31[/C][C]-0.440577[/C][C]-3.7384[/C][C]0.000184[/C][/ROW]
[ROW][C]32[/C][C]-0.303576[/C][C]-2.5759[/C][C]0.006025[/C][/ROW]
[ROW][C]33[/C][C]-0.077301[/C][C]-0.6559[/C][C]0.256982[/C][/ROW]
[ROW][C]34[/C][C]0.169262[/C][C]1.4362[/C][C]0.077633[/C][/ROW]
[ROW][C]35[/C][C]0.348765[/C][C]2.9594[/C][C]0.002085[/C][/ROW]
[ROW][C]36[/C][C]0.416368[/C][C]3.533[/C][C]0.000361[/C][/ROW]
[ROW][C]37[/C][C]0.353211[/C][C]2.9971[/C][C]0.001869[/C][/ROW]
[ROW][C]38[/C][C]0.218019[/C][C]1.8499[/C][C]0.034212[/C][/ROW]
[ROW][C]39[/C][C]0.036168[/C][C]0.3069[/C][C]0.379905[/C][/ROW]
[ROW][C]40[/C][C]-0.154382[/C][C]-1.31[/C][C]0.097184[/C][/ROW]
[ROW][C]41[/C][C]-0.284063[/C][C]-2.4104[/C][C]0.009246[/C][/ROW]
[ROW][C]42[/C][C]-0.350242[/C][C]-2.9719[/C][C]0.002011[/C][/ROW]
[ROW][C]43[/C][C]-0.334087[/C][C]-2.8348[/C][C]0.002974[/C][/ROW]
[ROW][C]44[/C][C]-0.23135[/C][C]-1.9631[/C][C]0.026751[/C][/ROW]
[ROW][C]45[/C][C]-0.067053[/C][C]-0.569[/C][C]0.285576[/C][/ROW]
[ROW][C]46[/C][C]0.079162[/C][C]0.6717[/C][C]0.251959[/C][/ROW]
[ROW][C]47[/C][C]0.197042[/C][C]1.672[/C][C]0.049437[/C][/ROW]
[ROW][C]48[/C][C]0.236573[/C][C]2.0074[/C][C]0.024231[/C][/ROW]
[/TABLE]
Source: https://freestatistics.org/blog/index.php?pk=305063&T=1

Globally Unique Identifier (entire table): ba.freestatistics.org/blog/index.php?pk=305063&T=1

As an alternative you can also use a QR Code:  

The GUIDs for individual cells are displayed in the table below:

Autocorrelation Function
Time lag kACF(k)T-STATP-value
10.7759846.58440
20.4249953.60620.000285
30.0363360.30830.379363
4-0.359845-3.05340.001585
5-0.635236-5.39020
6-0.716543-6.08010
7-0.632608-5.36790
8-0.381273-3.23520.000919
90.0017390.01480.494132
100.3942053.34490.000655
110.6624485.62110
120.749256.35760
130.6580755.5840
140.3920323.32650.000693
150.0275080.23340.408052
16-0.298354-2.53160.006769
17-0.519597-4.40891.8e-05
18-0.616502-5.23121e-06
19-0.554131-4.7026e-06
20-0.345902-2.93510.002236
21-0.035813-0.30390.381047
220.2627492.22950.01445
230.5111874.33762.3e-05
240.6096375.17291e-06
250.5238134.44471.6e-05
260.3078992.61260.005466
270.0406250.34470.365656
28-0.227351-1.92910.028828
29-0.399093-3.38640.000575
30-0.467494-3.96688.5e-05
31-0.440577-3.73840.000184
32-0.303576-2.57590.006025
33-0.077301-0.65590.256982
340.1692621.43620.077633
350.3487652.95940.002085
360.4163683.5330.000361
370.3532112.99710.001869
380.2180191.84990.034212
390.0361680.30690.379905
40-0.154382-1.310.097184
41-0.284063-2.41040.009246
42-0.350242-2.97190.002011
43-0.334087-2.83480.002974
44-0.23135-1.96310.026751
45-0.067053-0.5690.285576
460.0791620.67170.251959
470.1970421.6720.049437
480.2365732.00740.024231


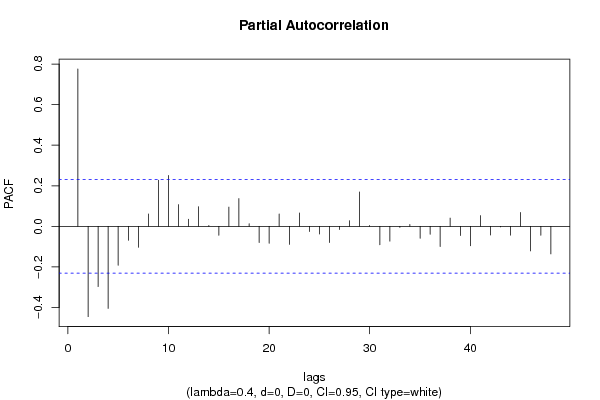
Partial Autocorrelation Function
Time lag kPACF(k)T-STATP-value
10.7759846.58440
2-0.445286-3.77840.000161
3-0.297113-2.52110.006957
4-0.404415-3.43160.000499
5-0.192065-1.62970.053763
6-0.068356-0.580.281856
7-0.103273-0.87630.19189
80.0604780.51320.304701
90.2276391.93160.028674
100.2504982.12550.018486
110.1071280.9090.183188
120.0353110.29960.382665
130.096430.81820.207961
140.0040640.03450.486293
15-0.044005-0.37340.354977
160.0948110.80450.211879
170.136651.15950.125039
180.0128880.10940.456611
19-0.080096-0.67960.249458
20-0.08324-0.70630.241136
210.0608740.51650.303533
22-0.089163-0.75660.225887
230.0659670.55970.288695
24-0.025324-0.21490.415232
25-0.037764-0.32040.374783
26-0.080082-0.67950.249494
27-0.015384-0.13050.448253
280.027950.23720.4066
290.1693021.43660.077585
300.0040540.03440.486329
31-0.091094-0.7730.221038
32-0.072861-0.61820.269182
33-0.005255-0.04460.482279
340.0093260.07910.468573
35-0.058924-0.50.309306
36-0.039303-0.33350.369864
37-0.099273-0.84240.201189
380.0406420.34490.365604
39-0.044833-0.38040.352376
40-0.095464-0.810.210294
410.053050.45010.32698
42-0.042764-0.36290.358883
43-0.002668-0.02260.490999
44-0.043546-0.36950.356419
450.0685920.5820.281185
46-0.121152-1.0280.153694
47-0.0441-0.37420.354678
48-0.135881-1.1530.126364

\begin{tabular}{lllllllll}
\hline
Partial Autocorrelation Function \tabularnewline
Time lag k & PACF(k) & T-STAT & P-value \tabularnewline
1 & 0.775984 & 6.5844 & 0 \tabularnewline
2 & -0.445286 & -3.7784 & 0.000161 \tabularnewline
3 & -0.297113 & -2.5211 & 0.006957 \tabularnewline
4 & -0.404415 & -3.4316 & 0.000499 \tabularnewline
5 & -0.192065 & -1.6297 & 0.053763 \tabularnewline
6 & -0.068356 & -0.58 & 0.281856 \tabularnewline
7 & -0.103273 & -0.8763 & 0.19189 \tabularnewline
8 & 0.060478 & 0.5132 & 0.304701 \tabularnewline
9 & 0.227639 & 1.9316 & 0.028674 \tabularnewline
10 & 0.250498 & 2.1255 & 0.018486 \tabularnewline
11 & 0.107128 & 0.909 & 0.183188 \tabularnewline
12 & 0.035311 & 0.2996 & 0.382665 \tabularnewline
13 & 0.09643 & 0.8182 & 0.207961 \tabularnewline
14 & 0.004064 & 0.0345 & 0.486293 \tabularnewline
15 & -0.044005 & -0.3734 & 0.354977 \tabularnewline
16 & 0.094811 & 0.8045 & 0.211879 \tabularnewline
17 & 0.13665 & 1.1595 & 0.125039 \tabularnewline
18 & 0.012888 & 0.1094 & 0.456611 \tabularnewline
19 & -0.080096 & -0.6796 & 0.249458 \tabularnewline
20 & -0.08324 & -0.7063 & 0.241136 \tabularnewline
21 & 0.060874 & 0.5165 & 0.303533 \tabularnewline
22 & -0.089163 & -0.7566 & 0.225887 \tabularnewline
23 & 0.065967 & 0.5597 & 0.288695 \tabularnewline
24 & -0.025324 & -0.2149 & 0.415232 \tabularnewline
25 & -0.037764 & -0.3204 & 0.374783 \tabularnewline
26 & -0.080082 & -0.6795 & 0.249494 \tabularnewline
27 & -0.015384 & -0.1305 & 0.448253 \tabularnewline
28 & 0.02795 & 0.2372 & 0.4066 \tabularnewline
29 & 0.169302 & 1.4366 & 0.077585 \tabularnewline
30 & 0.004054 & 0.0344 & 0.486329 \tabularnewline
31 & -0.091094 & -0.773 & 0.221038 \tabularnewline
32 & -0.072861 & -0.6182 & 0.269182 \tabularnewline
33 & -0.005255 & -0.0446 & 0.482279 \tabularnewline
34 & 0.009326 & 0.0791 & 0.468573 \tabularnewline
35 & -0.058924 & -0.5 & 0.309306 \tabularnewline
36 & -0.039303 & -0.3335 & 0.369864 \tabularnewline
37 & -0.099273 & -0.8424 & 0.201189 \tabularnewline
38 & 0.040642 & 0.3449 & 0.365604 \tabularnewline
39 & -0.044833 & -0.3804 & 0.352376 \tabularnewline
40 & -0.095464 & -0.81 & 0.210294 \tabularnewline
41 & 0.05305 & 0.4501 & 0.32698 \tabularnewline
42 & -0.042764 & -0.3629 & 0.358883 \tabularnewline
43 & -0.002668 & -0.0226 & 0.490999 \tabularnewline
44 & -0.043546 & -0.3695 & 0.356419 \tabularnewline
45 & 0.068592 & 0.582 & 0.281185 \tabularnewline
46 & -0.121152 & -1.028 & 0.153694 \tabularnewline
47 & -0.0441 & -0.3742 & 0.354678 \tabularnewline
48 & -0.135881 & -1.153 & 0.126364 \tabularnewline
\hline
\end{tabular}
%Source: https://freestatistics.org/blog/index.php?pk=305063&T=2

[TABLE]
[ROW][C]Partial Autocorrelation Function[/C][/ROW]
[ROW][C]Time lag k[/C][C]PACF(k)[/C][C]T-STAT[/C][C]P-value[/C][/ROW]
[ROW][C]1[/C][C]0.775984[/C][C]6.5844[/C][C]0[/C][/ROW]
[ROW][C]2[/C][C]-0.445286[/C][C]-3.7784[/C][C]0.000161[/C][/ROW]
[ROW][C]3[/C][C]-0.297113[/C][C]-2.5211[/C][C]0.006957[/C][/ROW]
[ROW][C]4[/C][C]-0.404415[/C][C]-3.4316[/C][C]0.000499[/C][/ROW]
[ROW][C]5[/C][C]-0.192065[/C][C]-1.6297[/C][C]0.053763[/C][/ROW]
[ROW][C]6[/C][C]-0.068356[/C][C]-0.58[/C][C]0.281856[/C][/ROW]
[ROW][C]7[/C][C]-0.103273[/C][C]-0.8763[/C][C]0.19189[/C][/ROW]
[ROW][C]8[/C][C]0.060478[/C][C]0.5132[/C][C]0.304701[/C][/ROW]
[ROW][C]9[/C][C]0.227639[/C][C]1.9316[/C][C]0.028674[/C][/ROW]
[ROW][C]10[/C][C]0.250498[/C][C]2.1255[/C][C]0.018486[/C][/ROW]
[ROW][C]11[/C][C]0.107128[/C][C]0.909[/C][C]0.183188[/C][/ROW]
[ROW][C]12[/C][C]0.035311[/C][C]0.2996[/C][C]0.382665[/C][/ROW]
[ROW][C]13[/C][C]0.09643[/C][C]0.8182[/C][C]0.207961[/C][/ROW]
[ROW][C]14[/C][C]0.004064[/C][C]0.0345[/C][C]0.486293[/C][/ROW]
[ROW][C]15[/C][C]-0.044005[/C][C]-0.3734[/C][C]0.354977[/C][/ROW]
[ROW][C]16[/C][C]0.094811[/C][C]0.8045[/C][C]0.211879[/C][/ROW]
[ROW][C]17[/C][C]0.13665[/C][C]1.1595[/C][C]0.125039[/C][/ROW]
[ROW][C]18[/C][C]0.012888[/C][C]0.1094[/C][C]0.456611[/C][/ROW]
[ROW][C]19[/C][C]-0.080096[/C][C]-0.6796[/C][C]0.249458[/C][/ROW]
[ROW][C]20[/C][C]-0.08324[/C][C]-0.7063[/C][C]0.241136[/C][/ROW]
[ROW][C]21[/C][C]0.060874[/C][C]0.5165[/C][C]0.303533[/C][/ROW]
[ROW][C]22[/C][C]-0.089163[/C][C]-0.7566[/C][C]0.225887[/C][/ROW]
[ROW][C]23[/C][C]0.065967[/C][C]0.5597[/C][C]0.288695[/C][/ROW]
[ROW][C]24[/C][C]-0.025324[/C][C]-0.2149[/C][C]0.415232[/C][/ROW]
[ROW][C]25[/C][C]-0.037764[/C][C]-0.3204[/C][C]0.374783[/C][/ROW]
[ROW][C]26[/C][C]-0.080082[/C][C]-0.6795[/C][C]0.249494[/C][/ROW]
[ROW][C]27[/C][C]-0.015384[/C][C]-0.1305[/C][C]0.448253[/C][/ROW]
[ROW][C]28[/C][C]0.02795[/C][C]0.2372[/C][C]0.4066[/C][/ROW]
[ROW][C]29[/C][C]0.169302[/C][C]1.4366[/C][C]0.077585[/C][/ROW]
[ROW][C]30[/C][C]0.004054[/C][C]0.0344[/C][C]0.486329[/C][/ROW]
[ROW][C]31[/C][C]-0.091094[/C][C]-0.773[/C][C]0.221038[/C][/ROW]
[ROW][C]32[/C][C]-0.072861[/C][C]-0.6182[/C][C]0.269182[/C][/ROW]
[ROW][C]33[/C][C]-0.005255[/C][C]-0.0446[/C][C]0.482279[/C][/ROW]
[ROW][C]34[/C][C]0.009326[/C][C]0.0791[/C][C]0.468573[/C][/ROW]
[ROW][C]35[/C][C]-0.058924[/C][C]-0.5[/C][C]0.309306[/C][/ROW]
[ROW][C]36[/C][C]-0.039303[/C][C]-0.3335[/C][C]0.369864[/C][/ROW]
[ROW][C]37[/C][C]-0.099273[/C][C]-0.8424[/C][C]0.201189[/C][/ROW]
[ROW][C]38[/C][C]0.040642[/C][C]0.3449[/C][C]0.365604[/C][/ROW]
[ROW][C]39[/C][C]-0.044833[/C][C]-0.3804[/C][C]0.352376[/C][/ROW]
[ROW][C]40[/C][C]-0.095464[/C][C]-0.81[/C][C]0.210294[/C][/ROW]
[ROW][C]41[/C][C]0.05305[/C][C]0.4501[/C][C]0.32698[/C][/ROW]
[ROW][C]42[/C][C]-0.042764[/C][C]-0.3629[/C][C]0.358883[/C][/ROW]
[ROW][C]43[/C][C]-0.002668[/C][C]-0.0226[/C][C]0.490999[/C][/ROW]
[ROW][C]44[/C][C]-0.043546[/C][C]-0.3695[/C][C]0.356419[/C][/ROW]
[ROW][C]45[/C][C]0.068592[/C][C]0.582[/C][C]0.281185[/C][/ROW]
[ROW][C]46[/C][C]-0.121152[/C][C]-1.028[/C][C]0.153694[/C][/ROW]
[ROW][C]47[/C][C]-0.0441[/C][C]-0.3742[/C][C]0.354678[/C][/ROW]
[ROW][C]48[/C][C]-0.135881[/C][C]-1.153[/C][C]0.126364[/C][/ROW]
[/TABLE]
Source: https://freestatistics.org/blog/index.php?pk=305063&T=2

Globally Unique Identifier (entire table): ba.freestatistics.org/blog/index.php?pk=305063&T=2

As an alternative you can also use a QR Code:  

The GUIDs for individual cells are displayed in the table below:

Partial Autocorrelation Function
Time lag kPACF(k)T-STATP-value
10.7759846.58440
2-0.445286-3.77840.000161
3-0.297113-2.52110.006957
4-0.404415-3.43160.000499
5-0.192065-1.62970.053763
6-0.068356-0.580.281856
7-0.103273-0.87630.19189
80.0604780.51320.304701
90.2276391.93160.028674
100.2504982.12550.018486
110.1071280.9090.183188
120.0353110.29960.382665
130.096430.81820.207961
140.0040640.03450.486293
15-0.044005-0.37340.354977
160.0948110.80450.211879
170.136651.15950.125039
180.0128880.10940.456611
19-0.080096-0.67960.249458
20-0.08324-0.70630.241136
210.0608740.51650.303533
22-0.089163-0.75660.225887
230.0659670.55970.288695
24-0.025324-0.21490.415232
25-0.037764-0.32040.374783
26-0.080082-0.67950.249494
27-0.015384-0.13050.448253
280.027950.23720.4066
290.1693021.43660.077585
300.0040540.03440.486329
31-0.091094-0.7730.221038
32-0.072861-0.61820.269182
33-0.005255-0.04460.482279
340.0093260.07910.468573
35-0.058924-0.50.309306
36-0.039303-0.33350.369864
37-0.099273-0.84240.201189
380.0406420.34490.365604
39-0.044833-0.38040.352376
40-0.095464-0.810.210294
410.053050.45010.32698
42-0.042764-0.36290.358883
43-0.002668-0.02260.490999
44-0.043546-0.36950.356419
450.0685920.5820.281185
46-0.121152-1.0280.153694
47-0.0441-0.37420.354678
48-0.135881-1.1530.126364


Parameters (Session):
par1 = 12 ; par2 = Triple ; par3 = multiplicative ; par4 = 12 ;
Parameters (R input):
par1 = 48 ; par2 = 0.4 ; par3 = 0 ; par4 = 0 ; par5 = 12 ; par6 = White Noise ; par7 = 0.95 ; par8 = ;
R code (references can be found in the software module):
par8 <- ''
par7 <- '0.95'
par6 <- 'White Noise'
par5 <- '12'
par4 <- '1'
par3 <- '0'
par2 <- '0.4'
par1 <- '48'
if (par1 == 'Default') {
par1 = 10*log10(length(x))
} else {
par1 <- as.numeric(par1)
}
par2 <- as.numeric(par2)
par3 <- as.numeric(par3)
par4 <- as.numeric(par4)
par5 <- as.numeric(par5)
if (par6 == 'White Noise') par6 <- 'white' else par6 <- 'ma'
par7 <- as.numeric(par7)
if (par8 != '') par8 <- as.numeric(par8)
x <- na.omit(x)
ox <- x
if (par8 == '') {
if (par2 == 0) {
x <- log(x)
} else {
x <- (x ^ par2 - 1) / par2
}
} else {
x <- log(x,base=par8)
}
if (par3 > 0) x <- diff(x,lag=1,difference=par3)
if (par4 > 0) x <- diff(x,lag=par5,difference=par4)
bitmap(file='picts.png')
op <- par(mfrow=c(2,1))
plot(ox,type='l',main='Original Time Series',xlab='time',ylab='value')
if (par8=='') {
mytitle <- paste('Working Time Series (lambda=',par2,', d=',par3,', D=',par4,')',sep='')
mysub <- paste('(lambda=',par2,', d=',par3,', D=',par4,', CI=', par7, ', CI type=',par6,')',sep='')
} else {
mytitle <- paste('Working Time Series (base=',par8,', d=',par3,', D=',par4,')',sep='')
mysub <- paste('(base=',par8,', d=',par3,', D=',par4,', CI=', par7, ', CI type=',par6,')',sep='')
}
plot(x,type='l', main=mytitle,xlab='time',ylab='value')
par(op)
dev.off()
bitmap(file='pic1.png')
racf <- acf(x, par1, main='Autocorrelation', xlab='time lag', ylab='ACF', ci.type=par6, ci=par7, sub=mysub)
dev.off()
bitmap(file='pic2.png')
rpacf <- pacf(x,par1,main='Partial Autocorrelation',xlab='lags',ylab='PACF',sub=mysub)
dev.off()
(myacf <- c(racf$acf))
(mypacf <- c(rpacf$acf))
lengthx <- length(x)
sqrtn <- sqrt(lengthx)
load(file='createtable')
a<-table.start()
a<-table.row.start(a)
a<-table.element(a,'Autocorrelation Function',4,TRUE)
a<-table.row.end(a)
a<-table.row.start(a)
a<-table.element(a,'Time lag k',header=TRUE)
a<-table.element(a,'ACF(k)',header=TRUE)
a<-table.element(a,'T-STAT',header=TRUE)
a<-table.element(a,'P-value',header=TRUE)
a<-table.row.end(a)
for (i in 2:(par1+1)) {
a<-table.row.start(a)
a<-table.element(a,i-1,header=TRUE)
a<-table.element(a,round(myacf[i],6))
mytstat <- myacf[i]*sqrtn
a<-table.element(a,round(mytstat,4))
a<-table.element(a,round(1-pt(abs(mytstat),lengthx),6))
a<-table.row.end(a)
}
a<-table.end(a)
table.save(a,file='mytable.tab')
a<-table.start()
a<-table.row.start(a)
a<-table.element(a,'Partial Autocorrelation Function',4,TRUE)
a<-table.row.end(a)
a<-table.row.start(a)
a<-table.element(a,'Time lag k',header=TRUE)
a<-table.element(a,'PACF(k)',header=TRUE)
a<-table.element(a,'T-STAT',header=TRUE)
a<-table.element(a,'P-value',header=TRUE)
a<-table.row.end(a)
for (i in 1:par1) {
a<-table.row.start(a)
a<-table.element(a,i,header=TRUE)
a<-table.element(a,round(mypacf[i],6))
mytstat <- mypacf[i]*sqrtn
a<-table.element(a,round(mytstat,4))
a<-table.element(a,round(1-pt(abs(mytstat),lengthx),6))
a<-table.row.end(a)
}
a<-table.end(a)
table.save(a,file='mytable1.tab')