Free Statistics

of Irreproducible Research!

Author's title

Author*The author of this computation has been verified*
R Software Modulerwasp_multipleregression.wasp
Title produced by softwareMultiple Regression
Date of computationMon, 23 Jan 2017 10:48:15 +0100
Cite this page as followsStatistical Computations at FreeStatistics.org, Office for Research Development and Education, URL https://freestatistics.org/blog/index.php?v=date/2017/Jan/23/t148516538190hdd2l72sx4du9.htm/, Retrieved Wed, 15 May 2024 12:39:55 +0200
Statistical Computations at FreeStatistics.org, Office for Research Development and Education, URL https://freestatistics.org/blog/index.php?pk=, Retrieved Wed, 15 May 2024 12:39:55 +0200
QR Codes:

Original text written by user:
IsPrivate?No (this computation is public)
User-defined keywords
Estimated Impact0
Dataseries X:
14 22 4 2 4 3 5 4
19 24 5 3 3 4 5 4
17 21 4 4 5 4 5 4
17 21 3 4 3 3 4 4
15 24 4 4 5 4 5 4
20 20 3 4 4 4 5 5
15 22 3 4 4 3 3 4
19 20 3 4 5 4 4 4
15 19 4 5 4 4 5 5
15 23 4 5 5 4 5 5
19 21 4 4 2 4 5 4
NA 19 4 4 5 3 5 4
20 19 4 4 4 3 4 5
18 21 3 3 5 4 4 5
15 21 4 4 5 4 2 5
14 22 3 4 5 4 4 5
20 22 3 4 5 4 4 5
16 21 5 5 4 3 4 4
16 21 4 4 4 4 5 4
16 21 3 4 5 3 4 5
10 20 4 4 4 4 5 5
19 22 4 4 5 4 4 5
19 22 4 4 5 4 4 4
16 24 4 4 5 4 4 5
15 21 3 4 4 4 4 4
18 19 3 4 4 3 5 5
17 19 4 4 4 4 4 4
19 23 2 4 5 4 5 5
17 21 5 4 4 4 4 4
NA 21 4 3 5 4 4 4
19 19 4 5 5 4 5 5
20 21 5 4 5 4 4 5
5 19 4 3 5 4 NA 5
19 21 2 3 5 4 5 4
16 21 4 5 2 4 4 4
15 23 3 4 5 4 4 4
16 19 4 3 5 3 4 5
18 19 4 3 3 4 4 4
16 19 4 4 5 4 4 4
15 18 5 4 4 4 4 4
17 22 4 5 5 4 5 5
NA 18 3 3 4 4 4 4
20 22 5 5 5 3 5 5
19 18 5 4 5 3 4 4
7 22 4 4 4 3 4 5
13 22 4 4 4 4 4 4
16 19 3 5 5 3 3 4
16 22 4 4 4 4 5 4
18 19 4 5 5 4 4 4
18 19 5 5 2 4 5 4
16 19 5 5 5 4 4 4
17 19 4 3 5 4 5 5
19 21 4 3 4 3 4 5
16 21 4 4 5 4 4 4
19 20 3 4 4 3 3 4
13 19 3 4 4 4 4 3
16 19 4 4 4 3 5 4
13 22 4 4 4 4 5 4
12 26 5 5 3 4 5 5
17 19 2 4 4 4 5 5
17 21 4 4 4 4 5 5
17 21 3 4 4 4 2 4
16 20 4 4 5 4 5 5
16 23 4 2 4 4 4 4
14 22 4 4 4 3 5 3
16 22 4 4 4 3 5 4
13 22 5 4 5 3 3 5
16 21 3 4 4 3 5 5
14 21 3 4 4 3 4 5
20 22 4 5 5 5 5 4
13 18 4 4 4 4 4 4
18 24 4 4 4 5 5 4
14 22 3 4 3 4 4 4
19 21 4 4 4 4 5 4
18 21 3 4 5 3 5 5
14 21 3 3 5 4 4 5
18 23 4 3 5 4 4 4
19 21 4 4 5 4 4 5
15 23 3 3 3 4 4 4
14 21 4 4 4 4 5 4
17 19 4 4 3 4 5 5
19 21 4 4 4 4 5 5
13 21 5 4 4 4 4 4
19 21 5 4 3 5 4 5
18 23 4 4 5 4 5 5
20 23 3 4 5 4 4 5
15 20 4 2 3 3 4 4
15 19 4 4 5 4 4 3
20 23 4 4 5 4 4 5
15 22 4 4 4 4 5 4
19 19 4 5 4 4 5 3
18 23 3 4 4 3 5 5
18 22 4 4 5 4 4 5
15 22 5 4 3 4 4 5
20 21 5 4 5 5 4 5
17 21 4 5 4 4 5 5
12 21 3 4 5 4 4 5
18 21 5 3 4 4 5 5
19 22 4 4 5 4 4 5
20 25 5 4 4 4 4 5
17 23 5 4 4 5 5 5
16 22 4 4 3 3 4 3
18 20 4 4 5 4 4 4
18 21 4 4 5 4 4 4
14 25 3 4 5 4 5 3
15 21 4 4 4 4 4 4
12 19 4 4 4 3 4 5
17 23 3 3 4 3 5 5
14 22 4 4 4 3 4 4
18 21 3 4 5 4 4 4
17 24 4 4 5 4 3 4
17 21 5 4 5 1 5 5
20 19 5 4 5 4 5 5
16 18 4 4 4 4 4 3
14 19 4 4 5 3 4 4
15 20 3 4 4 3 4 5
18 19 4 4 4 4 4 4
20 22 4 4 4 4 5 4
17 21 4 5 3 4 4 4
17 22 3 4 4 4 4 4
17 24 4 4 4 3 4 4
17 28 4 4 4 4 4 5
15 19 3 4 3 3 4 4
17 18 4 4 4 3 4 3
18 23 3 2 4 2 4 4
17 19 4 4 4 3 5 4
20 23 5 4 4 3 5 4
15 19 2 4 4 3 3 5
16 22 3 3 4 4 4 4
15 21 4 4 4 3 4 4
18 19 5 5 4 4 5 4
15 21 4 5 5 4 4 4
18 23 5 5 5 5 5 4
20 22 4 5 5 4 5 5
19 19 4 4 4 3 4 5
14 19 3 4 5 4 5 4
16 21 4 4 5 4 4 4
15 22 4 4 2 4 4 4
17 21 4 4 3 4 5 5
18 20 4 4 4 4 5 5
20 23 5 4 5 3 5 4
17 22 4 3 5 4 4 4
18 23 4 4 5 4 4 4
15 22 3 3 2 3 4 4
16 21 4 5 5 4 4 3
11 20 4 4 4 3 4 4
15 18 4 4 4 4 4 5
18 18 3 4 5 3 5 5
17 20 4 4 5 4 4 5
16 19 5 4 5 4 5 4
12 21 4 4 5 4 3 4
19 24 2 3 5 4 4 4
18 19 4 4 4 4 4 5
15 20 4 3 4 3 5 5
17 19 4 4 4 4 4 3
19 23 4 5 5 5 4 4
18 22 5 4 3 4 4 4
19 21 5 4 4 3 4 4
16 24 3 3 1 4 5 5
16 21 4 4 4 4 4 5
16 21 4 4 4 4 5 4
14 22 2 3 4 5 5 4


Summary of computational transaction
Raw Input view raw input (R code)
Raw Outputview raw output of R engine
Computing time11 seconds
R ServerBig Analytics Cloud Computing Center

\begin{tabular}{lllllllll}
\hline
Summary of computational transaction \tabularnewline
Raw Input view raw input (R code)  \tabularnewline
Raw Outputview raw output of R engine  \tabularnewline
Computing time11 seconds \tabularnewline
R ServerBig Analytics Cloud Computing Center \tabularnewline
\hline
\end{tabular}
%Source: https://freestatistics.org/blog/index.php?pk=&T=0

[TABLE]
[ROW]
Summary of computational transaction[/C][/ROW] [ROW]Raw Input[/C] view raw input (R code) [/C][/ROW] [ROW]Raw Output[/C]view raw output of R engine [/C][/ROW] [ROW]Computing time[/C]11 seconds[/C][/ROW] [ROW]R Server[/C]Big Analytics Cloud Computing Center[/C][/ROW] [/TABLE] Source: https://freestatistics.org/blog/index.php?pk=&T=0

Globally Unique Identifier (entire table): ba.freestatistics.org/blog/index.php?pk=&T=0

As an alternative you can also use a QR Code:  

The GUIDs for individual cells are displayed in the table below:

Summary of computational transaction
Raw Input view raw input (R code)
Raw Outputview raw output of R engine
Computing time11 seconds
R ServerBig Analytics Cloud Computing Center


Multiple Linear Regression - Estimated Regression Equation
ITHSUM[t] = + 7.66755 + 0.0269725Bevr_Leeftijd[t] + 0.306787SKEOU1[t] -0.0238402SKEOU2[t] + 0.435938SKEOU3[t] + 0.423284SKEOU4[t] + 0.495697SKEOU5[t] + 0.39003SKEOU6[t] + e[t]

\begin{tabular}{lllllllll}
\hline
Multiple Linear Regression - Estimated Regression Equation \tabularnewline
ITHSUM[t] =  +  7.66755 +  0.0269725Bevr_Leeftijd[t] +  0.306787SKEOU1[t] -0.0238402SKEOU2[t] +  0.435938SKEOU3[t] +  0.423284SKEOU4[t] +  0.495697SKEOU5[t] +  0.39003SKEOU6[t]  + e[t] \tabularnewline
 \tabularnewline
\hline
\end{tabular}
%Source: https://freestatistics.org/blog/index.php?pk=&T=1

[TABLE]
[ROW][C]Multiple Linear Regression - Estimated Regression Equation[/C][/ROW]
[ROW][C]ITHSUM[t] =  +  7.66755 +  0.0269725Bevr_Leeftijd[t] +  0.306787SKEOU1[t] -0.0238402SKEOU2[t] +  0.435938SKEOU3[t] +  0.423284SKEOU4[t] +  0.495697SKEOU5[t] +  0.39003SKEOU6[t]  + e[t][/C][/ROW]
[ROW][C][/C][/ROW]
[/TABLE]
Source: https://freestatistics.org/blog/index.php?pk=&T=1

Globally Unique Identifier (entire table): ba.freestatistics.org/blog/index.php?pk=&T=1

As an alternative you can also use a QR Code:  

The GUIDs for individual cells are displayed in the table below:

Multiple Linear Regression - Estimated Regression Equation
ITHSUM[t] = + 7.66755 + 0.0269725Bevr_Leeftijd[t] + 0.306787SKEOU1[t] -0.0238402SKEOU2[t] + 0.435938SKEOU3[t] + 0.423284SKEOU4[t] + 0.495697SKEOU5[t] + 0.39003SKEOU6[t] + e[t]


Multiple Linear Regression - Ordinary Least Squares
VariableParameterS.D.T-STATH0: parameter = 02-tail p-value1-tail p-value
(Intercept)+7.668 3.171+2.4180e+00 0.01679 0.008397
Bevr_Leeftijd+0.02697 0.1051+2.5660e-01 0.7979 0.3989
SKEOU1+0.3068 0.2553+1.2020e+00 0.2314 0.1157
SKEOU2-0.02384 0.3208-7.4320e-02 0.9409 0.4704
SKEOU3+0.4359 0.2301+1.8950e+00 0.06005 0.03003
SKEOU4+0.4233 0.319+1.3270e+00 0.1866 0.09329
SKEOU5+0.4957 0.2954+1.6780e+00 0.09538 0.04769
SKEOU6+0.39 0.3057+1.2760e+00 0.2039 0.102

\begin{tabular}{lllllllll}
\hline
Multiple Linear Regression - Ordinary Least Squares \tabularnewline
Variable & Parameter & S.D. & T-STATH0: parameter = 0 & 2-tail p-value & 1-tail p-value \tabularnewline
(Intercept) & +7.668 &  3.171 & +2.4180e+00 &  0.01679 &  0.008397 \tabularnewline
Bevr_Leeftijd & +0.02697 &  0.1051 & +2.5660e-01 &  0.7979 &  0.3989 \tabularnewline
SKEOU1 & +0.3068 &  0.2553 & +1.2020e+00 &  0.2314 &  0.1157 \tabularnewline
SKEOU2 & -0.02384 &  0.3208 & -7.4320e-02 &  0.9409 &  0.4704 \tabularnewline
SKEOU3 & +0.4359 &  0.2301 & +1.8950e+00 &  0.06005 &  0.03003 \tabularnewline
SKEOU4 & +0.4233 &  0.319 & +1.3270e+00 &  0.1866 &  0.09329 \tabularnewline
SKEOU5 & +0.4957 &  0.2954 & +1.6780e+00 &  0.09538 &  0.04769 \tabularnewline
SKEOU6 & +0.39 &  0.3057 & +1.2760e+00 &  0.2039 &  0.102 \tabularnewline
\hline
\end{tabular}
%Source: https://freestatistics.org/blog/index.php?pk=&T=2

[TABLE]
[ROW][C]Multiple Linear Regression - Ordinary Least Squares[/C][/ROW]
[ROW][C]Variable[/C][C]Parameter[/C][C]S.D.[/C][C]T-STATH0: parameter = 0[/C][C]2-tail p-value[/C][C]1-tail p-value[/C][/ROW]
[ROW][C](Intercept)[/C][C]+7.668[/C][C] 3.171[/C][C]+2.4180e+00[/C][C] 0.01679[/C][C] 0.008397[/C][/ROW]
[ROW][C]Bevr_Leeftijd[/C][C]+0.02697[/C][C] 0.1051[/C][C]+2.5660e-01[/C][C] 0.7979[/C][C] 0.3989[/C][/ROW]
[ROW][C]SKEOU1[/C][C]+0.3068[/C][C] 0.2553[/C][C]+1.2020e+00[/C][C] 0.2314[/C][C] 0.1157[/C][/ROW]
[ROW][C]SKEOU2[/C][C]-0.02384[/C][C] 0.3208[/C][C]-7.4320e-02[/C][C] 0.9409[/C][C] 0.4704[/C][/ROW]
[ROW][C]SKEOU3[/C][C]+0.4359[/C][C] 0.2301[/C][C]+1.8950e+00[/C][C] 0.06005[/C][C] 0.03003[/C][/ROW]
[ROW][C]SKEOU4[/C][C]+0.4233[/C][C] 0.319[/C][C]+1.3270e+00[/C][C] 0.1866[/C][C] 0.09329[/C][/ROW]
[ROW][C]SKEOU5[/C][C]+0.4957[/C][C] 0.2954[/C][C]+1.6780e+00[/C][C] 0.09538[/C][C] 0.04769[/C][/ROW]
[ROW][C]SKEOU6[/C][C]+0.39[/C][C] 0.3057[/C][C]+1.2760e+00[/C][C] 0.2039[/C][C] 0.102[/C][/ROW]
[/TABLE]
Source: https://freestatistics.org/blog/index.php?pk=&T=2

Globally Unique Identifier (entire table): ba.freestatistics.org/blog/index.php?pk=&T=2

As an alternative you can also use a QR Code:  

The GUIDs for individual cells are displayed in the table below:

Multiple Linear Regression - Ordinary Least Squares
VariableParameterS.D.T-STATH0: parameter = 02-tail p-value1-tail p-value
(Intercept)+7.668 3.171+2.4180e+00 0.01679 0.008397
Bevr_Leeftijd+0.02697 0.1051+2.5660e-01 0.7979 0.3989
SKEOU1+0.3068 0.2553+1.2020e+00 0.2314 0.1157
SKEOU2-0.02384 0.3208-7.4320e-02 0.9409 0.4704
SKEOU3+0.4359 0.2301+1.8950e+00 0.06005 0.03003
SKEOU4+0.4233 0.319+1.3270e+00 0.1866 0.09329
SKEOU5+0.4957 0.2954+1.6780e+00 0.09538 0.04769
SKEOU6+0.39 0.3057+1.2760e+00 0.2039 0.102


Multiple Linear Regression - Regression Statistics
Multiple R 0.2904
R-squared 0.08435
Adjusted R-squared 0.04162
F-TEST (value) 1.974
F-TEST (DF numerator)7
F-TEST (DF denominator)150
p-value 0.06218
Multiple Linear Regression - Residual Statistics
Residual Standard Deviation 2.243
Sum Squared Residuals 754.4

\begin{tabular}{lllllllll}
\hline
Multiple Linear Regression - Regression Statistics \tabularnewline
Multiple R &  0.2904 \tabularnewline
R-squared &  0.08435 \tabularnewline
Adjusted R-squared &  0.04162 \tabularnewline
F-TEST (value) &  1.974 \tabularnewline
F-TEST (DF numerator) & 7 \tabularnewline
F-TEST (DF denominator) & 150 \tabularnewline
p-value &  0.06218 \tabularnewline
Multiple Linear Regression - Residual Statistics \tabularnewline
Residual Standard Deviation &  2.243 \tabularnewline
Sum Squared Residuals &  754.4 \tabularnewline
\hline
\end{tabular}
%Source: https://freestatistics.org/blog/index.php?pk=&T=3

[TABLE]
[ROW][C]Multiple Linear Regression - Regression Statistics[/C][/ROW]
[ROW][C]Multiple R[/C][C] 0.2904[/C][/ROW]
[ROW][C]R-squared[/C][C] 0.08435[/C][/ROW]
[ROW][C]Adjusted R-squared[/C][C] 0.04162[/C][/ROW]
[ROW][C]F-TEST (value)[/C][C] 1.974[/C][/ROW]
[ROW][C]F-TEST (DF numerator)[/C][C]7[/C][/ROW]
[ROW][C]F-TEST (DF denominator)[/C][C]150[/C][/ROW]
[ROW][C]p-value[/C][C] 0.06218[/C][/ROW]
[ROW][C]Multiple Linear Regression - Residual Statistics[/C][/ROW]
[ROW][C]Residual Standard Deviation[/C][C] 2.243[/C][/ROW]
[ROW][C]Sum Squared Residuals[/C][C] 754.4[/C][/ROW]
[/TABLE]
Source: https://freestatistics.org/blog/index.php?pk=&T=3

Globally Unique Identifier (entire table): ba.freestatistics.org/blog/index.php?pk=&T=3

As an alternative you can also use a QR Code:  

The GUIDs for individual cells are displayed in the table below:

Multiple Linear Regression - Regression Statistics
Multiple R 0.2904
R-squared 0.08435
Adjusted R-squared 0.04162
F-TEST (value) 1.974
F-TEST (DF numerator)7
F-TEST (DF denominator)150
p-value 0.06218
Multiple Linear Regression - Residual Statistics
Residual Standard Deviation 2.243
Sum Squared Residuals 754.4


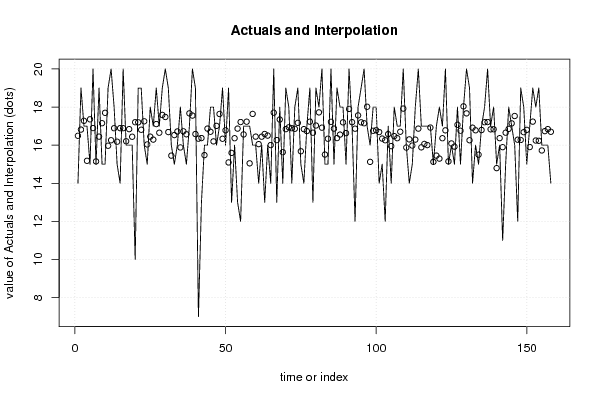
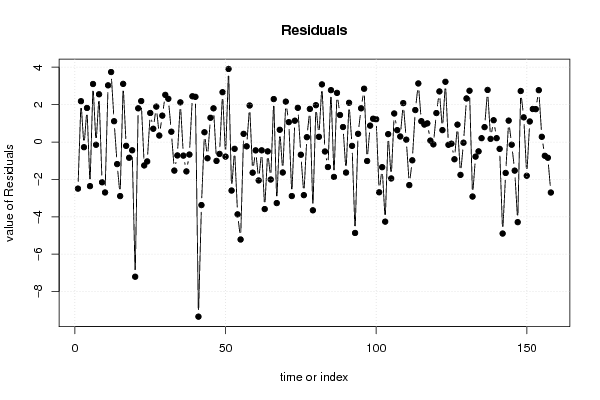
Multiple Linear Regression - Actuals, Interpolation, and Residuals
Time or IndexActualsInterpolationForecastResidualsPrediction Error
1 14 16.49-2.493
2 19 16.82 2.183
3 17 17.28-0.2772
4 17 15.18 1.82
5 15 17.36-2.358
6 20 16.9 3.102
7 15 15.15-0.1468
8 19 16.45 2.552
9 15 17.15-2.154
10 15 17.7-2.697
11 19 15.97 3.031
12 20 16.26 3.742
13 18 16.89 1.111
14 15 16.18-1.18
15 14 16.89-2.892
16 20 16.89 3.108
17 16 16.21-0.2052
18 16 16.84-0.8413
19 16 16.44-0.4415
20 10 17.2-7.204
21 19 17.2 1.802
22 19 16.81 2.192
23 16 17.25-1.252
24 15 16.04-1.039
25 18 16.45 1.553
26 17 16.29 0.7084
27 19 17.11 1.892
28 17 16.65 0.3477
29 19 17.59 1.411
30 20 17.48 2.522
31 19 16.69 2.313
32 16 15.45 0.5502
33 15 16.53-1.529
34 16 16.72-0.7181
35 18 15.88 2.12
36 16 16.73-0.7276
37 15 16.57-1.571
38 17 17.67-0.6704
39 20 17.55 2.446
40 19 16.58 2.416
41 7 16.34-9.339
42 13 16.37-3.373
43 16 15.48 0.5221
44 16 16.87-0.8682
45 18 16.7 1.296
46 18 16.2 1.802
47 16 17.01-1.01
48 17 17.64-0.6371
49 19 16.34 2.664
50 16 16.78-0.7815
51 19 15.09 3.907
52 13 15.59-2.595
53 16 16.36-0.364
54 13 16.87-3.868
55 12 17.21-5.213
56 17 16.56 0.4362
57 17 17.23-0.2313
58 17 15.05 1.953
59 16 17.64-1.64
60 16 16.45-0.4472
61 14 16.05-2.055
62 16 16.44-0.4449
63 13 16.59-3.586
64 16 16.5-0.5012
65 14 16.01-2.006
66 20 17.7 2.296
67 13 16.26-3.265
68 18 17.35 0.6545
69 14 15.63-1.63
70 19 16.84 2.159
71 18 16.94 1.063
72 14 16.89-2.889
73 18 16.86 1.141
74 19 17.17 1.828
75 15 15.68-0.6806
76 14 16.84-2.841
77 17 16.74 0.2586
78 19 17.23 1.769
79 13 16.65-3.652
80 19 17.03 1.97
81 18 17.72 0.2788
82 20 16.92 3.081
83 15 15.51-0.507
84 15 16.34-1.338
85 20 17.23 2.775
86 15 16.87-1.868
87 19 16.37 2.627
88 18 16.56 1.445
89 18 17.2 0.8015
90 15 16.63-1.633
91 20 17.9 2.098
92 17 17.21-0.2074
93 12 16.86-4.865
94 18 17.56 0.4381
95 19 17.2 1.802
96 20 17.15 2.85
97 17 18.02-1.015
98 16 15.12 0.8767
99 18 16.75 1.245
100 18 16.78 1.218
101 14 16.69-2.688
102 15 16.35-1.346
103 12 16.26-4.258
104 17 16.58 0.421
105 14 15.95-1.949
106 18 16.47 1.525
107 17 16.37 0.6333
108 17 16.7 0.2958
109 20 17.92 2.08
110 16 15.87 0.1254
111 14 16.3-2.304
112 15 15.98-0.9785
113 18 16.29 1.708
114 20 16.87 3.132
115 17 15.89 1.114
116 17 16.07 0.9343
117 17 16 0.9968
118 17 16.92 0.0756
119 15 15.13-0.1256
120 17 15.45 1.549
121 18 15.29 2.706
122 17 16.36 0.636
123 20 16.78 3.221
124 15 15.15-0.1491
125 16 16.09-0.08958
126 15 15.92-0.9223
127 18 17.07 0.9297
128 15 16.76-1.758
129 18 18.04-0.03737
130 20 17.67 2.33
131 19 16.26 2.742
132 14 16.92-2.916
133 16 16.78-0.7815
134 15 15.5-0.5007
135 17 16.8 0.2047
136 18 17.2 0.7957
137 20 17.21 2.785
138 17 16.83 0.1677
139 18 16.84 1.165
140 15 14.79 0.2056
141 16 16.37-0.3676
142 11 15.9-4.895
143 15 16.65-1.655
144 18 16.86 1.144
145 17 17.14-0.1446
146 16 17.53-1.53
147 12 16.29-4.286
148 19 16.27 2.727
149 18 16.68 1.318
150 15 16.8-1.805
151 17 15.9 1.098
152 19 17.23 1.765
153 18 16.24 1.757
154 19 16.23 2.771
155 16 15.72 0.2786
156 16 16.74-0.7356
157 16 16.84-0.8413
158 14 16.7-2.702

\begin{tabular}{lllllllll}
\hline
Multiple Linear Regression - Actuals, Interpolation, and Residuals \tabularnewline
Time or Index & Actuals & InterpolationForecast & ResidualsPrediction Error \tabularnewline
1 &  14 &  16.49 & -2.493 \tabularnewline
2 &  19 &  16.82 &  2.183 \tabularnewline
3 &  17 &  17.28 & -0.2772 \tabularnewline
4 &  17 &  15.18 &  1.82 \tabularnewline
5 &  15 &  17.36 & -2.358 \tabularnewline
6 &  20 &  16.9 &  3.102 \tabularnewline
7 &  15 &  15.15 & -0.1468 \tabularnewline
8 &  19 &  16.45 &  2.552 \tabularnewline
9 &  15 &  17.15 & -2.154 \tabularnewline
10 &  15 &  17.7 & -2.697 \tabularnewline
11 &  19 &  15.97 &  3.031 \tabularnewline
12 &  20 &  16.26 &  3.742 \tabularnewline
13 &  18 &  16.89 &  1.111 \tabularnewline
14 &  15 &  16.18 & -1.18 \tabularnewline
15 &  14 &  16.89 & -2.892 \tabularnewline
16 &  20 &  16.89 &  3.108 \tabularnewline
17 &  16 &  16.21 & -0.2052 \tabularnewline
18 &  16 &  16.84 & -0.8413 \tabularnewline
19 &  16 &  16.44 & -0.4415 \tabularnewline
20 &  10 &  17.2 & -7.204 \tabularnewline
21 &  19 &  17.2 &  1.802 \tabularnewline
22 &  19 &  16.81 &  2.192 \tabularnewline
23 &  16 &  17.25 & -1.252 \tabularnewline
24 &  15 &  16.04 & -1.039 \tabularnewline
25 &  18 &  16.45 &  1.553 \tabularnewline
26 &  17 &  16.29 &  0.7084 \tabularnewline
27 &  19 &  17.11 &  1.892 \tabularnewline
28 &  17 &  16.65 &  0.3477 \tabularnewline
29 &  19 &  17.59 &  1.411 \tabularnewline
30 &  20 &  17.48 &  2.522 \tabularnewline
31 &  19 &  16.69 &  2.313 \tabularnewline
32 &  16 &  15.45 &  0.5502 \tabularnewline
33 &  15 &  16.53 & -1.529 \tabularnewline
34 &  16 &  16.72 & -0.7181 \tabularnewline
35 &  18 &  15.88 &  2.12 \tabularnewline
36 &  16 &  16.73 & -0.7276 \tabularnewline
37 &  15 &  16.57 & -1.571 \tabularnewline
38 &  17 &  17.67 & -0.6704 \tabularnewline
39 &  20 &  17.55 &  2.446 \tabularnewline
40 &  19 &  16.58 &  2.416 \tabularnewline
41 &  7 &  16.34 & -9.339 \tabularnewline
42 &  13 &  16.37 & -3.373 \tabularnewline
43 &  16 &  15.48 &  0.5221 \tabularnewline
44 &  16 &  16.87 & -0.8682 \tabularnewline
45 &  18 &  16.7 &  1.296 \tabularnewline
46 &  18 &  16.2 &  1.802 \tabularnewline
47 &  16 &  17.01 & -1.01 \tabularnewline
48 &  17 &  17.64 & -0.6371 \tabularnewline
49 &  19 &  16.34 &  2.664 \tabularnewline
50 &  16 &  16.78 & -0.7815 \tabularnewline
51 &  19 &  15.09 &  3.907 \tabularnewline
52 &  13 &  15.59 & -2.595 \tabularnewline
53 &  16 &  16.36 & -0.364 \tabularnewline
54 &  13 &  16.87 & -3.868 \tabularnewline
55 &  12 &  17.21 & -5.213 \tabularnewline
56 &  17 &  16.56 &  0.4362 \tabularnewline
57 &  17 &  17.23 & -0.2313 \tabularnewline
58 &  17 &  15.05 &  1.953 \tabularnewline
59 &  16 &  17.64 & -1.64 \tabularnewline
60 &  16 &  16.45 & -0.4472 \tabularnewline
61 &  14 &  16.05 & -2.055 \tabularnewline
62 &  16 &  16.44 & -0.4449 \tabularnewline
63 &  13 &  16.59 & -3.586 \tabularnewline
64 &  16 &  16.5 & -0.5012 \tabularnewline
65 &  14 &  16.01 & -2.006 \tabularnewline
66 &  20 &  17.7 &  2.296 \tabularnewline
67 &  13 &  16.26 & -3.265 \tabularnewline
68 &  18 &  17.35 &  0.6545 \tabularnewline
69 &  14 &  15.63 & -1.63 \tabularnewline
70 &  19 &  16.84 &  2.159 \tabularnewline
71 &  18 &  16.94 &  1.063 \tabularnewline
72 &  14 &  16.89 & -2.889 \tabularnewline
73 &  18 &  16.86 &  1.141 \tabularnewline
74 &  19 &  17.17 &  1.828 \tabularnewline
75 &  15 &  15.68 & -0.6806 \tabularnewline
76 &  14 &  16.84 & -2.841 \tabularnewline
77 &  17 &  16.74 &  0.2586 \tabularnewline
78 &  19 &  17.23 &  1.769 \tabularnewline
79 &  13 &  16.65 & -3.652 \tabularnewline
80 &  19 &  17.03 &  1.97 \tabularnewline
81 &  18 &  17.72 &  0.2788 \tabularnewline
82 &  20 &  16.92 &  3.081 \tabularnewline
83 &  15 &  15.51 & -0.507 \tabularnewline
84 &  15 &  16.34 & -1.338 \tabularnewline
85 &  20 &  17.23 &  2.775 \tabularnewline
86 &  15 &  16.87 & -1.868 \tabularnewline
87 &  19 &  16.37 &  2.627 \tabularnewline
88 &  18 &  16.56 &  1.445 \tabularnewline
89 &  18 &  17.2 &  0.8015 \tabularnewline
90 &  15 &  16.63 & -1.633 \tabularnewline
91 &  20 &  17.9 &  2.098 \tabularnewline
92 &  17 &  17.21 & -0.2074 \tabularnewline
93 &  12 &  16.86 & -4.865 \tabularnewline
94 &  18 &  17.56 &  0.4381 \tabularnewline
95 &  19 &  17.2 &  1.802 \tabularnewline
96 &  20 &  17.15 &  2.85 \tabularnewline
97 &  17 &  18.02 & -1.015 \tabularnewline
98 &  16 &  15.12 &  0.8767 \tabularnewline
99 &  18 &  16.75 &  1.245 \tabularnewline
100 &  18 &  16.78 &  1.218 \tabularnewline
101 &  14 &  16.69 & -2.688 \tabularnewline
102 &  15 &  16.35 & -1.346 \tabularnewline
103 &  12 &  16.26 & -4.258 \tabularnewline
104 &  17 &  16.58 &  0.421 \tabularnewline
105 &  14 &  15.95 & -1.949 \tabularnewline
106 &  18 &  16.47 &  1.525 \tabularnewline
107 &  17 &  16.37 &  0.6333 \tabularnewline
108 &  17 &  16.7 &  0.2958 \tabularnewline
109 &  20 &  17.92 &  2.08 \tabularnewline
110 &  16 &  15.87 &  0.1254 \tabularnewline
111 &  14 &  16.3 & -2.304 \tabularnewline
112 &  15 &  15.98 & -0.9785 \tabularnewline
113 &  18 &  16.29 &  1.708 \tabularnewline
114 &  20 &  16.87 &  3.132 \tabularnewline
115 &  17 &  15.89 &  1.114 \tabularnewline
116 &  17 &  16.07 &  0.9343 \tabularnewline
117 &  17 &  16 &  0.9968 \tabularnewline
118 &  17 &  16.92 &  0.0756 \tabularnewline
119 &  15 &  15.13 & -0.1256 \tabularnewline
120 &  17 &  15.45 &  1.549 \tabularnewline
121 &  18 &  15.29 &  2.706 \tabularnewline
122 &  17 &  16.36 &  0.636 \tabularnewline
123 &  20 &  16.78 &  3.221 \tabularnewline
124 &  15 &  15.15 & -0.1491 \tabularnewline
125 &  16 &  16.09 & -0.08958 \tabularnewline
126 &  15 &  15.92 & -0.9223 \tabularnewline
127 &  18 &  17.07 &  0.9297 \tabularnewline
128 &  15 &  16.76 & -1.758 \tabularnewline
129 &  18 &  18.04 & -0.03737 \tabularnewline
130 &  20 &  17.67 &  2.33 \tabularnewline
131 &  19 &  16.26 &  2.742 \tabularnewline
132 &  14 &  16.92 & -2.916 \tabularnewline
133 &  16 &  16.78 & -0.7815 \tabularnewline
134 &  15 &  15.5 & -0.5007 \tabularnewline
135 &  17 &  16.8 &  0.2047 \tabularnewline
136 &  18 &  17.2 &  0.7957 \tabularnewline
137 &  20 &  17.21 &  2.785 \tabularnewline
138 &  17 &  16.83 &  0.1677 \tabularnewline
139 &  18 &  16.84 &  1.165 \tabularnewline
140 &  15 &  14.79 &  0.2056 \tabularnewline
141 &  16 &  16.37 & -0.3676 \tabularnewline
142 &  11 &  15.9 & -4.895 \tabularnewline
143 &  15 &  16.65 & -1.655 \tabularnewline
144 &  18 &  16.86 &  1.144 \tabularnewline
145 &  17 &  17.14 & -0.1446 \tabularnewline
146 &  16 &  17.53 & -1.53 \tabularnewline
147 &  12 &  16.29 & -4.286 \tabularnewline
148 &  19 &  16.27 &  2.727 \tabularnewline
149 &  18 &  16.68 &  1.318 \tabularnewline
150 &  15 &  16.8 & -1.805 \tabularnewline
151 &  17 &  15.9 &  1.098 \tabularnewline
152 &  19 &  17.23 &  1.765 \tabularnewline
153 &  18 &  16.24 &  1.757 \tabularnewline
154 &  19 &  16.23 &  2.771 \tabularnewline
155 &  16 &  15.72 &  0.2786 \tabularnewline
156 &  16 &  16.74 & -0.7356 \tabularnewline
157 &  16 &  16.84 & -0.8413 \tabularnewline
158 &  14 &  16.7 & -2.702 \tabularnewline
\hline
\end{tabular}
%Source: https://freestatistics.org/blog/index.php?pk=&T=4

[TABLE]
[ROW][C]Multiple Linear Regression - Actuals, Interpolation, and Residuals[/C][/ROW]
[ROW][C]Time or Index[/C][C]Actuals[/C][C]InterpolationForecast[/C][C]ResidualsPrediction Error[/C][/ROW]
[ROW][C]1[/C][C] 14[/C][C] 16.49[/C][C]-2.493[/C][/ROW]
[ROW][C]2[/C][C] 19[/C][C] 16.82[/C][C] 2.183[/C][/ROW]
[ROW][C]3[/C][C] 17[/C][C] 17.28[/C][C]-0.2772[/C][/ROW]
[ROW][C]4[/C][C] 17[/C][C] 15.18[/C][C] 1.82[/C][/ROW]
[ROW][C]5[/C][C] 15[/C][C] 17.36[/C][C]-2.358[/C][/ROW]
[ROW][C]6[/C][C] 20[/C][C] 16.9[/C][C] 3.102[/C][/ROW]
[ROW][C]7[/C][C] 15[/C][C] 15.15[/C][C]-0.1468[/C][/ROW]
[ROW][C]8[/C][C] 19[/C][C] 16.45[/C][C] 2.552[/C][/ROW]
[ROW][C]9[/C][C] 15[/C][C] 17.15[/C][C]-2.154[/C][/ROW]
[ROW][C]10[/C][C] 15[/C][C] 17.7[/C][C]-2.697[/C][/ROW]
[ROW][C]11[/C][C] 19[/C][C] 15.97[/C][C] 3.031[/C][/ROW]
[ROW][C]12[/C][C] 20[/C][C] 16.26[/C][C] 3.742[/C][/ROW]
[ROW][C]13[/C][C] 18[/C][C] 16.89[/C][C] 1.111[/C][/ROW]
[ROW][C]14[/C][C] 15[/C][C] 16.18[/C][C]-1.18[/C][/ROW]
[ROW][C]15[/C][C] 14[/C][C] 16.89[/C][C]-2.892[/C][/ROW]
[ROW][C]16[/C][C] 20[/C][C] 16.89[/C][C] 3.108[/C][/ROW]
[ROW][C]17[/C][C] 16[/C][C] 16.21[/C][C]-0.2052[/C][/ROW]
[ROW][C]18[/C][C] 16[/C][C] 16.84[/C][C]-0.8413[/C][/ROW]
[ROW][C]19[/C][C] 16[/C][C] 16.44[/C][C]-0.4415[/C][/ROW]
[ROW][C]20[/C][C] 10[/C][C] 17.2[/C][C]-7.204[/C][/ROW]
[ROW][C]21[/C][C] 19[/C][C] 17.2[/C][C] 1.802[/C][/ROW]
[ROW][C]22[/C][C] 19[/C][C] 16.81[/C][C] 2.192[/C][/ROW]
[ROW][C]23[/C][C] 16[/C][C] 17.25[/C][C]-1.252[/C][/ROW]
[ROW][C]24[/C][C] 15[/C][C] 16.04[/C][C]-1.039[/C][/ROW]
[ROW][C]25[/C][C] 18[/C][C] 16.45[/C][C] 1.553[/C][/ROW]
[ROW][C]26[/C][C] 17[/C][C] 16.29[/C][C] 0.7084[/C][/ROW]
[ROW][C]27[/C][C] 19[/C][C] 17.11[/C][C] 1.892[/C][/ROW]
[ROW][C]28[/C][C] 17[/C][C] 16.65[/C][C] 0.3477[/C][/ROW]
[ROW][C]29[/C][C] 19[/C][C] 17.59[/C][C] 1.411[/C][/ROW]
[ROW][C]30[/C][C] 20[/C][C] 17.48[/C][C] 2.522[/C][/ROW]
[ROW][C]31[/C][C] 19[/C][C] 16.69[/C][C] 2.313[/C][/ROW]
[ROW][C]32[/C][C] 16[/C][C] 15.45[/C][C] 0.5502[/C][/ROW]
[ROW][C]33[/C][C] 15[/C][C] 16.53[/C][C]-1.529[/C][/ROW]
[ROW][C]34[/C][C] 16[/C][C] 16.72[/C][C]-0.7181[/C][/ROW]
[ROW][C]35[/C][C] 18[/C][C] 15.88[/C][C] 2.12[/C][/ROW]
[ROW][C]36[/C][C] 16[/C][C] 16.73[/C][C]-0.7276[/C][/ROW]
[ROW][C]37[/C][C] 15[/C][C] 16.57[/C][C]-1.571[/C][/ROW]
[ROW][C]38[/C][C] 17[/C][C] 17.67[/C][C]-0.6704[/C][/ROW]
[ROW][C]39[/C][C] 20[/C][C] 17.55[/C][C] 2.446[/C][/ROW]
[ROW][C]40[/C][C] 19[/C][C] 16.58[/C][C] 2.416[/C][/ROW]
[ROW][C]41[/C][C] 7[/C][C] 16.34[/C][C]-9.339[/C][/ROW]
[ROW][C]42[/C][C] 13[/C][C] 16.37[/C][C]-3.373[/C][/ROW]
[ROW][C]43[/C][C] 16[/C][C] 15.48[/C][C] 0.5221[/C][/ROW]
[ROW][C]44[/C][C] 16[/C][C] 16.87[/C][C]-0.8682[/C][/ROW]
[ROW][C]45[/C][C] 18[/C][C] 16.7[/C][C] 1.296[/C][/ROW]
[ROW][C]46[/C][C] 18[/C][C] 16.2[/C][C] 1.802[/C][/ROW]
[ROW][C]47[/C][C] 16[/C][C] 17.01[/C][C]-1.01[/C][/ROW]
[ROW][C]48[/C][C] 17[/C][C] 17.64[/C][C]-0.6371[/C][/ROW]
[ROW][C]49[/C][C] 19[/C][C] 16.34[/C][C] 2.664[/C][/ROW]
[ROW][C]50[/C][C] 16[/C][C] 16.78[/C][C]-0.7815[/C][/ROW]
[ROW][C]51[/C][C] 19[/C][C] 15.09[/C][C] 3.907[/C][/ROW]
[ROW][C]52[/C][C] 13[/C][C] 15.59[/C][C]-2.595[/C][/ROW]
[ROW][C]53[/C][C] 16[/C][C] 16.36[/C][C]-0.364[/C][/ROW]
[ROW][C]54[/C][C] 13[/C][C] 16.87[/C][C]-3.868[/C][/ROW]
[ROW][C]55[/C][C] 12[/C][C] 17.21[/C][C]-5.213[/C][/ROW]
[ROW][C]56[/C][C] 17[/C][C] 16.56[/C][C] 0.4362[/C][/ROW]
[ROW][C]57[/C][C] 17[/C][C] 17.23[/C][C]-0.2313[/C][/ROW]
[ROW][C]58[/C][C] 17[/C][C] 15.05[/C][C] 1.953[/C][/ROW]
[ROW][C]59[/C][C] 16[/C][C] 17.64[/C][C]-1.64[/C][/ROW]
[ROW][C]60[/C][C] 16[/C][C] 16.45[/C][C]-0.4472[/C][/ROW]
[ROW][C]61[/C][C] 14[/C][C] 16.05[/C][C]-2.055[/C][/ROW]
[ROW][C]62[/C][C] 16[/C][C] 16.44[/C][C]-0.4449[/C][/ROW]
[ROW][C]63[/C][C] 13[/C][C] 16.59[/C][C]-3.586[/C][/ROW]
[ROW][C]64[/C][C] 16[/C][C] 16.5[/C][C]-0.5012[/C][/ROW]
[ROW][C]65[/C][C] 14[/C][C] 16.01[/C][C]-2.006[/C][/ROW]
[ROW][C]66[/C][C] 20[/C][C] 17.7[/C][C] 2.296[/C][/ROW]
[ROW][C]67[/C][C] 13[/C][C] 16.26[/C][C]-3.265[/C][/ROW]
[ROW][C]68[/C][C] 18[/C][C] 17.35[/C][C] 0.6545[/C][/ROW]
[ROW][C]69[/C][C] 14[/C][C] 15.63[/C][C]-1.63[/C][/ROW]
[ROW][C]70[/C][C] 19[/C][C] 16.84[/C][C] 2.159[/C][/ROW]
[ROW][C]71[/C][C] 18[/C][C] 16.94[/C][C] 1.063[/C][/ROW]
[ROW][C]72[/C][C] 14[/C][C] 16.89[/C][C]-2.889[/C][/ROW]
[ROW][C]73[/C][C] 18[/C][C] 16.86[/C][C] 1.141[/C][/ROW]
[ROW][C]74[/C][C] 19[/C][C] 17.17[/C][C] 1.828[/C][/ROW]
[ROW][C]75[/C][C] 15[/C][C] 15.68[/C][C]-0.6806[/C][/ROW]
[ROW][C]76[/C][C] 14[/C][C] 16.84[/C][C]-2.841[/C][/ROW]
[ROW][C]77[/C][C] 17[/C][C] 16.74[/C][C] 0.2586[/C][/ROW]
[ROW][C]78[/C][C] 19[/C][C] 17.23[/C][C] 1.769[/C][/ROW]
[ROW][C]79[/C][C] 13[/C][C] 16.65[/C][C]-3.652[/C][/ROW]
[ROW][C]80[/C][C] 19[/C][C] 17.03[/C][C] 1.97[/C][/ROW]
[ROW][C]81[/C][C] 18[/C][C] 17.72[/C][C] 0.2788[/C][/ROW]
[ROW][C]82[/C][C] 20[/C][C] 16.92[/C][C] 3.081[/C][/ROW]
[ROW][C]83[/C][C] 15[/C][C] 15.51[/C][C]-0.507[/C][/ROW]
[ROW][C]84[/C][C] 15[/C][C] 16.34[/C][C]-1.338[/C][/ROW]
[ROW][C]85[/C][C] 20[/C][C] 17.23[/C][C] 2.775[/C][/ROW]
[ROW][C]86[/C][C] 15[/C][C] 16.87[/C][C]-1.868[/C][/ROW]
[ROW][C]87[/C][C] 19[/C][C] 16.37[/C][C] 2.627[/C][/ROW]
[ROW][C]88[/C][C] 18[/C][C] 16.56[/C][C] 1.445[/C][/ROW]
[ROW][C]89[/C][C] 18[/C][C] 17.2[/C][C] 0.8015[/C][/ROW]
[ROW][C]90[/C][C] 15[/C][C] 16.63[/C][C]-1.633[/C][/ROW]
[ROW][C]91[/C][C] 20[/C][C] 17.9[/C][C] 2.098[/C][/ROW]
[ROW][C]92[/C][C] 17[/C][C] 17.21[/C][C]-0.2074[/C][/ROW]
[ROW][C]93[/C][C] 12[/C][C] 16.86[/C][C]-4.865[/C][/ROW]
[ROW][C]94[/C][C] 18[/C][C] 17.56[/C][C] 0.4381[/C][/ROW]
[ROW][C]95[/C][C] 19[/C][C] 17.2[/C][C] 1.802[/C][/ROW]
[ROW][C]96[/C][C] 20[/C][C] 17.15[/C][C] 2.85[/C][/ROW]
[ROW][C]97[/C][C] 17[/C][C] 18.02[/C][C]-1.015[/C][/ROW]
[ROW][C]98[/C][C] 16[/C][C] 15.12[/C][C] 0.8767[/C][/ROW]
[ROW][C]99[/C][C] 18[/C][C] 16.75[/C][C] 1.245[/C][/ROW]
[ROW][C]100[/C][C] 18[/C][C] 16.78[/C][C] 1.218[/C][/ROW]
[ROW][C]101[/C][C] 14[/C][C] 16.69[/C][C]-2.688[/C][/ROW]
[ROW][C]102[/C][C] 15[/C][C] 16.35[/C][C]-1.346[/C][/ROW]
[ROW][C]103[/C][C] 12[/C][C] 16.26[/C][C]-4.258[/C][/ROW]
[ROW][C]104[/C][C] 17[/C][C] 16.58[/C][C] 0.421[/C][/ROW]
[ROW][C]105[/C][C] 14[/C][C] 15.95[/C][C]-1.949[/C][/ROW]
[ROW][C]106[/C][C] 18[/C][C] 16.47[/C][C] 1.525[/C][/ROW]
[ROW][C]107[/C][C] 17[/C][C] 16.37[/C][C] 0.6333[/C][/ROW]
[ROW][C]108[/C][C] 17[/C][C] 16.7[/C][C] 0.2958[/C][/ROW]
[ROW][C]109[/C][C] 20[/C][C] 17.92[/C][C] 2.08[/C][/ROW]
[ROW][C]110[/C][C] 16[/C][C] 15.87[/C][C] 0.1254[/C][/ROW]
[ROW][C]111[/C][C] 14[/C][C] 16.3[/C][C]-2.304[/C][/ROW]
[ROW][C]112[/C][C] 15[/C][C] 15.98[/C][C]-0.9785[/C][/ROW]
[ROW][C]113[/C][C] 18[/C][C] 16.29[/C][C] 1.708[/C][/ROW]
[ROW][C]114[/C][C] 20[/C][C] 16.87[/C][C] 3.132[/C][/ROW]
[ROW][C]115[/C][C] 17[/C][C] 15.89[/C][C] 1.114[/C][/ROW]
[ROW][C]116[/C][C] 17[/C][C] 16.07[/C][C] 0.9343[/C][/ROW]
[ROW][C]117[/C][C] 17[/C][C] 16[/C][C] 0.9968[/C][/ROW]
[ROW][C]118[/C][C] 17[/C][C] 16.92[/C][C] 0.0756[/C][/ROW]
[ROW][C]119[/C][C] 15[/C][C] 15.13[/C][C]-0.1256[/C][/ROW]
[ROW][C]120[/C][C] 17[/C][C] 15.45[/C][C] 1.549[/C][/ROW]
[ROW][C]121[/C][C] 18[/C][C] 15.29[/C][C] 2.706[/C][/ROW]
[ROW][C]122[/C][C] 17[/C][C] 16.36[/C][C] 0.636[/C][/ROW]
[ROW][C]123[/C][C] 20[/C][C] 16.78[/C][C] 3.221[/C][/ROW]
[ROW][C]124[/C][C] 15[/C][C] 15.15[/C][C]-0.1491[/C][/ROW]
[ROW][C]125[/C][C] 16[/C][C] 16.09[/C][C]-0.08958[/C][/ROW]
[ROW][C]126[/C][C] 15[/C][C] 15.92[/C][C]-0.9223[/C][/ROW]
[ROW][C]127[/C][C] 18[/C][C] 17.07[/C][C] 0.9297[/C][/ROW]
[ROW][C]128[/C][C] 15[/C][C] 16.76[/C][C]-1.758[/C][/ROW]
[ROW][C]129[/C][C] 18[/C][C] 18.04[/C][C]-0.03737[/C][/ROW]
[ROW][C]130[/C][C] 20[/C][C] 17.67[/C][C] 2.33[/C][/ROW]
[ROW][C]131[/C][C] 19[/C][C] 16.26[/C][C] 2.742[/C][/ROW]
[ROW][C]132[/C][C] 14[/C][C] 16.92[/C][C]-2.916[/C][/ROW]
[ROW][C]133[/C][C] 16[/C][C] 16.78[/C][C]-0.7815[/C][/ROW]
[ROW][C]134[/C][C] 15[/C][C] 15.5[/C][C]-0.5007[/C][/ROW]
[ROW][C]135[/C][C] 17[/C][C] 16.8[/C][C] 0.2047[/C][/ROW]
[ROW][C]136[/C][C] 18[/C][C] 17.2[/C][C] 0.7957[/C][/ROW]
[ROW][C]137[/C][C] 20[/C][C] 17.21[/C][C] 2.785[/C][/ROW]
[ROW][C]138[/C][C] 17[/C][C] 16.83[/C][C] 0.1677[/C][/ROW]
[ROW][C]139[/C][C] 18[/C][C] 16.84[/C][C] 1.165[/C][/ROW]
[ROW][C]140[/C][C] 15[/C][C] 14.79[/C][C] 0.2056[/C][/ROW]
[ROW][C]141[/C][C] 16[/C][C] 16.37[/C][C]-0.3676[/C][/ROW]
[ROW][C]142[/C][C] 11[/C][C] 15.9[/C][C]-4.895[/C][/ROW]
[ROW][C]143[/C][C] 15[/C][C] 16.65[/C][C]-1.655[/C][/ROW]
[ROW][C]144[/C][C] 18[/C][C] 16.86[/C][C] 1.144[/C][/ROW]
[ROW][C]145[/C][C] 17[/C][C] 17.14[/C][C]-0.1446[/C][/ROW]
[ROW][C]146[/C][C] 16[/C][C] 17.53[/C][C]-1.53[/C][/ROW]
[ROW][C]147[/C][C] 12[/C][C] 16.29[/C][C]-4.286[/C][/ROW]
[ROW][C]148[/C][C] 19[/C][C] 16.27[/C][C] 2.727[/C][/ROW]
[ROW][C]149[/C][C] 18[/C][C] 16.68[/C][C] 1.318[/C][/ROW]
[ROW][C]150[/C][C] 15[/C][C] 16.8[/C][C]-1.805[/C][/ROW]
[ROW][C]151[/C][C] 17[/C][C] 15.9[/C][C] 1.098[/C][/ROW]
[ROW][C]152[/C][C] 19[/C][C] 17.23[/C][C] 1.765[/C][/ROW]
[ROW][C]153[/C][C] 18[/C][C] 16.24[/C][C] 1.757[/C][/ROW]
[ROW][C]154[/C][C] 19[/C][C] 16.23[/C][C] 2.771[/C][/ROW]
[ROW][C]155[/C][C] 16[/C][C] 15.72[/C][C] 0.2786[/C][/ROW]
[ROW][C]156[/C][C] 16[/C][C] 16.74[/C][C]-0.7356[/C][/ROW]
[ROW][C]157[/C][C] 16[/C][C] 16.84[/C][C]-0.8413[/C][/ROW]
[ROW][C]158[/C][C] 14[/C][C] 16.7[/C][C]-2.702[/C][/ROW]
[/TABLE]
Source: https://freestatistics.org/blog/index.php?pk=&T=4

Globally Unique Identifier (entire table): ba.freestatistics.org/blog/index.php?pk=&T=4

As an alternative you can also use a QR Code:  

The GUIDs for individual cells are displayed in the table below:

Multiple Linear Regression - Actuals, Interpolation, and Residuals
Time or IndexActualsInterpolationForecastResidualsPrediction Error
1 14 16.49-2.493
2 19 16.82 2.183
3 17 17.28-0.2772
4 17 15.18 1.82
5 15 17.36-2.358
6 20 16.9 3.102
7 15 15.15-0.1468
8 19 16.45 2.552
9 15 17.15-2.154
10 15 17.7-2.697
11 19 15.97 3.031
12 20 16.26 3.742
13 18 16.89 1.111
14 15 16.18-1.18
15 14 16.89-2.892
16 20 16.89 3.108
17 16 16.21-0.2052
18 16 16.84-0.8413
19 16 16.44-0.4415
20 10 17.2-7.204
21 19 17.2 1.802
22 19 16.81 2.192
23 16 17.25-1.252
24 15 16.04-1.039
25 18 16.45 1.553
26 17 16.29 0.7084
27 19 17.11 1.892
28 17 16.65 0.3477
29 19 17.59 1.411
30 20 17.48 2.522
31 19 16.69 2.313
32 16 15.45 0.5502
33 15 16.53-1.529
34 16 16.72-0.7181
35 18 15.88 2.12
36 16 16.73-0.7276
37 15 16.57-1.571
38 17 17.67-0.6704
39 20 17.55 2.446
40 19 16.58 2.416
41 7 16.34-9.339
42 13 16.37-3.373
43 16 15.48 0.5221
44 16 16.87-0.8682
45 18 16.7 1.296
46 18 16.2 1.802
47 16 17.01-1.01
48 17 17.64-0.6371
49 19 16.34 2.664
50 16 16.78-0.7815
51 19 15.09 3.907
52 13 15.59-2.595
53 16 16.36-0.364
54 13 16.87-3.868
55 12 17.21-5.213
56 17 16.56 0.4362
57 17 17.23-0.2313
58 17 15.05 1.953
59 16 17.64-1.64
60 16 16.45-0.4472
61 14 16.05-2.055
62 16 16.44-0.4449
63 13 16.59-3.586
64 16 16.5-0.5012
65 14 16.01-2.006
66 20 17.7 2.296
67 13 16.26-3.265
68 18 17.35 0.6545
69 14 15.63-1.63
70 19 16.84 2.159
71 18 16.94 1.063
72 14 16.89-2.889
73 18 16.86 1.141
74 19 17.17 1.828
75 15 15.68-0.6806
76 14 16.84-2.841
77 17 16.74 0.2586
78 19 17.23 1.769
79 13 16.65-3.652
80 19 17.03 1.97
81 18 17.72 0.2788
82 20 16.92 3.081
83 15 15.51-0.507
84 15 16.34-1.338
85 20 17.23 2.775
86 15 16.87-1.868
87 19 16.37 2.627
88 18 16.56 1.445
89 18 17.2 0.8015
90 15 16.63-1.633
91 20 17.9 2.098
92 17 17.21-0.2074
93 12 16.86-4.865
94 18 17.56 0.4381
95 19 17.2 1.802
96 20 17.15 2.85
97 17 18.02-1.015
98 16 15.12 0.8767
99 18 16.75 1.245
100 18 16.78 1.218
101 14 16.69-2.688
102 15 16.35-1.346
103 12 16.26-4.258
104 17 16.58 0.421
105 14 15.95-1.949
106 18 16.47 1.525
107 17 16.37 0.6333
108 17 16.7 0.2958
109 20 17.92 2.08
110 16 15.87 0.1254
111 14 16.3-2.304
112 15 15.98-0.9785
113 18 16.29 1.708
114 20 16.87 3.132
115 17 15.89 1.114
116 17 16.07 0.9343
117 17 16 0.9968
118 17 16.92 0.0756
119 15 15.13-0.1256
120 17 15.45 1.549
121 18 15.29 2.706
122 17 16.36 0.636
123 20 16.78 3.221
124 15 15.15-0.1491
125 16 16.09-0.08958
126 15 15.92-0.9223
127 18 17.07 0.9297
128 15 16.76-1.758
129 18 18.04-0.03737
130 20 17.67 2.33
131 19 16.26 2.742
132 14 16.92-2.916
133 16 16.78-0.7815
134 15 15.5-0.5007
135 17 16.8 0.2047
136 18 17.2 0.7957
137 20 17.21 2.785
138 17 16.83 0.1677
139 18 16.84 1.165
140 15 14.79 0.2056
141 16 16.37-0.3676
142 11 15.9-4.895
143 15 16.65-1.655
144 18 16.86 1.144
145 17 17.14-0.1446
146 16 17.53-1.53
147 12 16.29-4.286
148 19 16.27 2.727
149 18 16.68 1.318
150 15 16.8-1.805
151 17 15.9 1.098
152 19 17.23 1.765
153 18 16.24 1.757
154 19 16.23 2.771
155 16 15.72 0.2786
156 16 16.74-0.7356
157 16 16.84-0.8413
158 14 16.7-2.702


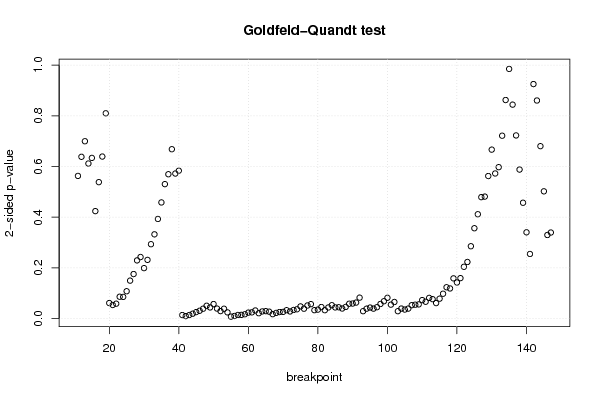
Goldfeld-Quandt test for Heteroskedasticity
p-valuesAlternative Hypothesis
breakpoint indexgreater2-sidedless
11 0.2814 0.5628 0.7186
12 0.6808 0.6383 0.3192
13 0.6501 0.6997 0.3499
14 0.6941 0.6117 0.3059
15 0.6831 0.6338 0.3169
16 0.788 0.4239 0.212
17 0.7309 0.5382 0.2691
18 0.6804 0.6393 0.3196
19 0.595 0.8101 0.405
20 0.9694 0.0612 0.0306
21 0.9733 0.05348 0.02674
22 0.9707 0.0586 0.0293
23 0.957 0.08605 0.04302
24 0.9573 0.0854 0.0427
25 0.9461 0.1078 0.05391
26 0.9252 0.1496 0.07481
27 0.9122 0.1756 0.0878
28 0.8852 0.2295 0.1148
29 0.8786 0.2428 0.1214
30 0.9005 0.199 0.09951
31 0.8842 0.2316 0.1158
32 0.8533 0.2934 0.1467
33 0.8338 0.3324 0.1662
34 0.8035 0.3929 0.1965
35 0.7709 0.4582 0.2291
36 0.7348 0.5305 0.2652
37 0.7153 0.5695 0.2847
38 0.6659 0.6682 0.3341
39 0.7138 0.5723 0.2862
40 0.7083 0.5834 0.2917
41 0.9931 0.01381 0.006906
42 0.9952 0.009678 0.004839
43 0.993 0.01396 0.00698
44 0.9905 0.0191 0.009549
45 0.9872 0.02555 0.01277
46 0.9846 0.03072 0.01536
47 0.9806 0.03873 0.01936
48 0.9747 0.0505 0.02525
49 0.9781 0.04383 0.02191
50 0.9714 0.0572 0.0286
51 0.9803 0.03935 0.01967
52 0.9853 0.02934 0.01467
53 0.9806 0.03871 0.01935
54 0.9878 0.02437 0.01218
55 0.9963 0.007485 0.003743
56 0.995 0.01006 0.00503
57 0.9929 0.01414 0.007071
58 0.9928 0.01442 0.00721
59 0.9915 0.01696 0.008479
60 0.9883 0.02338 0.01169
61 0.9878 0.02449 0.01225
62 0.9841 0.03182 0.01591
63 0.9895 0.02102 0.01051
64 0.986 0.02807 0.01404
65 0.9854 0.02919 0.0146
66 0.9864 0.0271 0.01355
67 0.9914 0.01725 0.008627
68 0.9889 0.02225 0.01112
69 0.9871 0.02578 0.01289
70 0.9869 0.02625 0.01312
71 0.9835 0.03299 0.0165
72 0.986 0.02799 0.01399
73 0.9831 0.03386 0.01693
74 0.9817 0.0366 0.0183
75 0.976 0.04794 0.02397
76 0.9806 0.03888 0.01944
77 0.9743 0.0515 0.02575
78 0.9716 0.0569 0.02845
79 0.9835 0.03297 0.01648
80 0.9824 0.03527 0.01764
81 0.9773 0.04542 0.02271
82 0.9835 0.03298 0.01649
83 0.9782 0.0437 0.02185
84 0.9737 0.0526 0.0263
85 0.9781 0.04389 0.02195
86 0.9777 0.04454 0.02227
87 0.9802 0.03957 0.01978
88 0.9771 0.04584 0.02292
89 0.9708 0.05842 0.02921
90 0.9704 0.05927 0.02964
91 0.9685 0.06305 0.03152
92 0.9588 0.08247 0.04123
93 0.9855 0.0291 0.01455
94 0.9806 0.03887 0.01944
95 0.9783 0.04332 0.02166
96 0.9805 0.03907 0.01954
97 0.9776 0.04486 0.02243
98 0.9712 0.05752 0.02876
99 0.9658 0.0684 0.0342
100 0.959 0.082 0.041
101 0.9726 0.05484 0.02742
102 0.9673 0.06534 0.03267
103 0.9855 0.02904 0.01452
104 0.9803 0.03936 0.01968
105 0.9822 0.03552 0.01776
106 0.9803 0.03931 0.01965
107 0.9736 0.05281 0.0264
108 0.9727 0.05456 0.02728
109 0.972 0.05593 0.02797
110 0.9636 0.07283 0.03642
111 0.9669 0.06629 0.03314
112 0.9592 0.08154 0.04077
113 0.9618 0.07644 0.03822
114 0.9694 0.06114 0.03057
115 0.9608 0.07835 0.03918
116 0.951 0.0979 0.04895
117 0.9382 0.1235 0.06176
118 0.9406 0.1187 0.05936
119 0.9207 0.1586 0.07932
120 0.9288 0.1423 0.07117
121 0.9202 0.1595 0.07977
122 0.8979 0.2042 0.1021
123 0.8884 0.2232 0.1116
124 0.8573 0.2854 0.1427
125 0.8218 0.3564 0.1782
126 0.7942 0.4117 0.2058
127 0.7605 0.4791 0.2395
128 0.7593 0.4813 0.2407
129 0.7188 0.5624 0.2812
130 0.6667 0.6666 0.3333
131 0.7137 0.5725 0.2863
132 0.7013 0.5974 0.2987
133 0.6392 0.7216 0.3608
134 0.5688 0.8624 0.4312
135 0.4925 0.985 0.5075
136 0.4221 0.8442 0.5779
137 0.3613 0.7226 0.6387
138 0.294 0.588 0.706
139 0.2285 0.4569 0.7715
140 0.1702 0.3404 0.8298
141 0.1274 0.2548 0.8726
142 0.5373 0.9253 0.4627
143 0.4302 0.8605 0.5698
144 0.3401 0.6803 0.6599
145 0.2511 0.5021 0.7489
146 0.1649 0.3297 0.8351
147 0.8303 0.3394 0.1697

\begin{tabular}{lllllllll}
\hline
Goldfeld-Quandt test for Heteroskedasticity \tabularnewline
p-values & Alternative Hypothesis \tabularnewline
breakpoint index & greater & 2-sided & less \tabularnewline
11 &  0.2814 &  0.5628 &  0.7186 \tabularnewline
12 &  0.6808 &  0.6383 &  0.3192 \tabularnewline
13 &  0.6501 &  0.6997 &  0.3499 \tabularnewline
14 &  0.6941 &  0.6117 &  0.3059 \tabularnewline
15 &  0.6831 &  0.6338 &  0.3169 \tabularnewline
16 &  0.788 &  0.4239 &  0.212 \tabularnewline
17 &  0.7309 &  0.5382 &  0.2691 \tabularnewline
18 &  0.6804 &  0.6393 &  0.3196 \tabularnewline
19 &  0.595 &  0.8101 &  0.405 \tabularnewline
20 &  0.9694 &  0.0612 &  0.0306 \tabularnewline
21 &  0.9733 &  0.05348 &  0.02674 \tabularnewline
22 &  0.9707 &  0.0586 &  0.0293 \tabularnewline
23 &  0.957 &  0.08605 &  0.04302 \tabularnewline
24 &  0.9573 &  0.0854 &  0.0427 \tabularnewline
25 &  0.9461 &  0.1078 &  0.05391 \tabularnewline
26 &  0.9252 &  0.1496 &  0.07481 \tabularnewline
27 &  0.9122 &  0.1756 &  0.0878 \tabularnewline
28 &  0.8852 &  0.2295 &  0.1148 \tabularnewline
29 &  0.8786 &  0.2428 &  0.1214 \tabularnewline
30 &  0.9005 &  0.199 &  0.09951 \tabularnewline
31 &  0.8842 &  0.2316 &  0.1158 \tabularnewline
32 &  0.8533 &  0.2934 &  0.1467 \tabularnewline
33 &  0.8338 &  0.3324 &  0.1662 \tabularnewline
34 &  0.8035 &  0.3929 &  0.1965 \tabularnewline
35 &  0.7709 &  0.4582 &  0.2291 \tabularnewline
36 &  0.7348 &  0.5305 &  0.2652 \tabularnewline
37 &  0.7153 &  0.5695 &  0.2847 \tabularnewline
38 &  0.6659 &  0.6682 &  0.3341 \tabularnewline
39 &  0.7138 &  0.5723 &  0.2862 \tabularnewline
40 &  0.7083 &  0.5834 &  0.2917 \tabularnewline
41 &  0.9931 &  0.01381 &  0.006906 \tabularnewline
42 &  0.9952 &  0.009678 &  0.004839 \tabularnewline
43 &  0.993 &  0.01396 &  0.00698 \tabularnewline
44 &  0.9905 &  0.0191 &  0.009549 \tabularnewline
45 &  0.9872 &  0.02555 &  0.01277 \tabularnewline
46 &  0.9846 &  0.03072 &  0.01536 \tabularnewline
47 &  0.9806 &  0.03873 &  0.01936 \tabularnewline
48 &  0.9747 &  0.0505 &  0.02525 \tabularnewline
49 &  0.9781 &  0.04383 &  0.02191 \tabularnewline
50 &  0.9714 &  0.0572 &  0.0286 \tabularnewline
51 &  0.9803 &  0.03935 &  0.01967 \tabularnewline
52 &  0.9853 &  0.02934 &  0.01467 \tabularnewline
53 &  0.9806 &  0.03871 &  0.01935 \tabularnewline
54 &  0.9878 &  0.02437 &  0.01218 \tabularnewline
55 &  0.9963 &  0.007485 &  0.003743 \tabularnewline
56 &  0.995 &  0.01006 &  0.00503 \tabularnewline
57 &  0.9929 &  0.01414 &  0.007071 \tabularnewline
58 &  0.9928 &  0.01442 &  0.00721 \tabularnewline
59 &  0.9915 &  0.01696 &  0.008479 \tabularnewline
60 &  0.9883 &  0.02338 &  0.01169 \tabularnewline
61 &  0.9878 &  0.02449 &  0.01225 \tabularnewline
62 &  0.9841 &  0.03182 &  0.01591 \tabularnewline
63 &  0.9895 &  0.02102 &  0.01051 \tabularnewline
64 &  0.986 &  0.02807 &  0.01404 \tabularnewline
65 &  0.9854 &  0.02919 &  0.0146 \tabularnewline
66 &  0.9864 &  0.0271 &  0.01355 \tabularnewline
67 &  0.9914 &  0.01725 &  0.008627 \tabularnewline
68 &  0.9889 &  0.02225 &  0.01112 \tabularnewline
69 &  0.9871 &  0.02578 &  0.01289 \tabularnewline
70 &  0.9869 &  0.02625 &  0.01312 \tabularnewline
71 &  0.9835 &  0.03299 &  0.0165 \tabularnewline
72 &  0.986 &  0.02799 &  0.01399 \tabularnewline
73 &  0.9831 &  0.03386 &  0.01693 \tabularnewline
74 &  0.9817 &  0.0366 &  0.0183 \tabularnewline
75 &  0.976 &  0.04794 &  0.02397 \tabularnewline
76 &  0.9806 &  0.03888 &  0.01944 \tabularnewline
77 &  0.9743 &  0.0515 &  0.02575 \tabularnewline
78 &  0.9716 &  0.0569 &  0.02845 \tabularnewline
79 &  0.9835 &  0.03297 &  0.01648 \tabularnewline
80 &  0.9824 &  0.03527 &  0.01764 \tabularnewline
81 &  0.9773 &  0.04542 &  0.02271 \tabularnewline
82 &  0.9835 &  0.03298 &  0.01649 \tabularnewline
83 &  0.9782 &  0.0437 &  0.02185 \tabularnewline
84 &  0.9737 &  0.0526 &  0.0263 \tabularnewline
85 &  0.9781 &  0.04389 &  0.02195 \tabularnewline
86 &  0.9777 &  0.04454 &  0.02227 \tabularnewline
87 &  0.9802 &  0.03957 &  0.01978 \tabularnewline
88 &  0.9771 &  0.04584 &  0.02292 \tabularnewline
89 &  0.9708 &  0.05842 &  0.02921 \tabularnewline
90 &  0.9704 &  0.05927 &  0.02964 \tabularnewline
91 &  0.9685 &  0.06305 &  0.03152 \tabularnewline
92 &  0.9588 &  0.08247 &  0.04123 \tabularnewline
93 &  0.9855 &  0.0291 &  0.01455 \tabularnewline
94 &  0.9806 &  0.03887 &  0.01944 \tabularnewline
95 &  0.9783 &  0.04332 &  0.02166 \tabularnewline
96 &  0.9805 &  0.03907 &  0.01954 \tabularnewline
97 &  0.9776 &  0.04486 &  0.02243 \tabularnewline
98 &  0.9712 &  0.05752 &  0.02876 \tabularnewline
99 &  0.9658 &  0.0684 &  0.0342 \tabularnewline
100 &  0.959 &  0.082 &  0.041 \tabularnewline
101 &  0.9726 &  0.05484 &  0.02742 \tabularnewline
102 &  0.9673 &  0.06534 &  0.03267 \tabularnewline
103 &  0.9855 &  0.02904 &  0.01452 \tabularnewline
104 &  0.9803 &  0.03936 &  0.01968 \tabularnewline
105 &  0.9822 &  0.03552 &  0.01776 \tabularnewline
106 &  0.9803 &  0.03931 &  0.01965 \tabularnewline
107 &  0.9736 &  0.05281 &  0.0264 \tabularnewline
108 &  0.9727 &  0.05456 &  0.02728 \tabularnewline
109 &  0.972 &  0.05593 &  0.02797 \tabularnewline
110 &  0.9636 &  0.07283 &  0.03642 \tabularnewline
111 &  0.9669 &  0.06629 &  0.03314 \tabularnewline
112 &  0.9592 &  0.08154 &  0.04077 \tabularnewline
113 &  0.9618 &  0.07644 &  0.03822 \tabularnewline
114 &  0.9694 &  0.06114 &  0.03057 \tabularnewline
115 &  0.9608 &  0.07835 &  0.03918 \tabularnewline
116 &  0.951 &  0.0979 &  0.04895 \tabularnewline
117 &  0.9382 &  0.1235 &  0.06176 \tabularnewline
118 &  0.9406 &  0.1187 &  0.05936 \tabularnewline
119 &  0.9207 &  0.1586 &  0.07932 \tabularnewline
120 &  0.9288 &  0.1423 &  0.07117 \tabularnewline
121 &  0.9202 &  0.1595 &  0.07977 \tabularnewline
122 &  0.8979 &  0.2042 &  0.1021 \tabularnewline
123 &  0.8884 &  0.2232 &  0.1116 \tabularnewline
124 &  0.8573 &  0.2854 &  0.1427 \tabularnewline
125 &  0.8218 &  0.3564 &  0.1782 \tabularnewline
126 &  0.7942 &  0.4117 &  0.2058 \tabularnewline
127 &  0.7605 &  0.4791 &  0.2395 \tabularnewline
128 &  0.7593 &  0.4813 &  0.2407 \tabularnewline
129 &  0.7188 &  0.5624 &  0.2812 \tabularnewline
130 &  0.6667 &  0.6666 &  0.3333 \tabularnewline
131 &  0.7137 &  0.5725 &  0.2863 \tabularnewline
132 &  0.7013 &  0.5974 &  0.2987 \tabularnewline
133 &  0.6392 &  0.7216 &  0.3608 \tabularnewline
134 &  0.5688 &  0.8624 &  0.4312 \tabularnewline
135 &  0.4925 &  0.985 &  0.5075 \tabularnewline
136 &  0.4221 &  0.8442 &  0.5779 \tabularnewline
137 &  0.3613 &  0.7226 &  0.6387 \tabularnewline
138 &  0.294 &  0.588 &  0.706 \tabularnewline
139 &  0.2285 &  0.4569 &  0.7715 \tabularnewline
140 &  0.1702 &  0.3404 &  0.8298 \tabularnewline
141 &  0.1274 &  0.2548 &  0.8726 \tabularnewline
142 &  0.5373 &  0.9253 &  0.4627 \tabularnewline
143 &  0.4302 &  0.8605 &  0.5698 \tabularnewline
144 &  0.3401 &  0.6803 &  0.6599 \tabularnewline
145 &  0.2511 &  0.5021 &  0.7489 \tabularnewline
146 &  0.1649 &  0.3297 &  0.8351 \tabularnewline
147 &  0.8303 &  0.3394 &  0.1697 \tabularnewline
\hline
\end{tabular}
%Source: https://freestatistics.org/blog/index.php?pk=&T=5

[TABLE]
[ROW][C]Goldfeld-Quandt test for Heteroskedasticity[/C][/ROW]
[ROW][C]p-values[/C][C]Alternative Hypothesis[/C][/ROW]
[ROW][C]breakpoint index[/C][C]greater[/C][C]2-sided[/C][C]less[/C][/ROW]
[ROW][C]11[/C][C] 0.2814[/C][C] 0.5628[/C][C] 0.7186[/C][/ROW]
[ROW][C]12[/C][C] 0.6808[/C][C] 0.6383[/C][C] 0.3192[/C][/ROW]
[ROW][C]13[/C][C] 0.6501[/C][C] 0.6997[/C][C] 0.3499[/C][/ROW]
[ROW][C]14[/C][C] 0.6941[/C][C] 0.6117[/C][C] 0.3059[/C][/ROW]
[ROW][C]15[/C][C] 0.6831[/C][C] 0.6338[/C][C] 0.3169[/C][/ROW]
[ROW][C]16[/C][C] 0.788[/C][C] 0.4239[/C][C] 0.212[/C][/ROW]
[ROW][C]17[/C][C] 0.7309[/C][C] 0.5382[/C][C] 0.2691[/C][/ROW]
[ROW][C]18[/C][C] 0.6804[/C][C] 0.6393[/C][C] 0.3196[/C][/ROW]
[ROW][C]19[/C][C] 0.595[/C][C] 0.8101[/C][C] 0.405[/C][/ROW]
[ROW][C]20[/C][C] 0.9694[/C][C] 0.0612[/C][C] 0.0306[/C][/ROW]
[ROW][C]21[/C][C] 0.9733[/C][C] 0.05348[/C][C] 0.02674[/C][/ROW]
[ROW][C]22[/C][C] 0.9707[/C][C] 0.0586[/C][C] 0.0293[/C][/ROW]
[ROW][C]23[/C][C] 0.957[/C][C] 0.08605[/C][C] 0.04302[/C][/ROW]
[ROW][C]24[/C][C] 0.9573[/C][C] 0.0854[/C][C] 0.0427[/C][/ROW]
[ROW][C]25[/C][C] 0.9461[/C][C] 0.1078[/C][C] 0.05391[/C][/ROW]
[ROW][C]26[/C][C] 0.9252[/C][C] 0.1496[/C][C] 0.07481[/C][/ROW]
[ROW][C]27[/C][C] 0.9122[/C][C] 0.1756[/C][C] 0.0878[/C][/ROW]
[ROW][C]28[/C][C] 0.8852[/C][C] 0.2295[/C][C] 0.1148[/C][/ROW]
[ROW][C]29[/C][C] 0.8786[/C][C] 0.2428[/C][C] 0.1214[/C][/ROW]
[ROW][C]30[/C][C] 0.9005[/C][C] 0.199[/C][C] 0.09951[/C][/ROW]
[ROW][C]31[/C][C] 0.8842[/C][C] 0.2316[/C][C] 0.1158[/C][/ROW]
[ROW][C]32[/C][C] 0.8533[/C][C] 0.2934[/C][C] 0.1467[/C][/ROW]
[ROW][C]33[/C][C] 0.8338[/C][C] 0.3324[/C][C] 0.1662[/C][/ROW]
[ROW][C]34[/C][C] 0.8035[/C][C] 0.3929[/C][C] 0.1965[/C][/ROW]
[ROW][C]35[/C][C] 0.7709[/C][C] 0.4582[/C][C] 0.2291[/C][/ROW]
[ROW][C]36[/C][C] 0.7348[/C][C] 0.5305[/C][C] 0.2652[/C][/ROW]
[ROW][C]37[/C][C] 0.7153[/C][C] 0.5695[/C][C] 0.2847[/C][/ROW]
[ROW][C]38[/C][C] 0.6659[/C][C] 0.6682[/C][C] 0.3341[/C][/ROW]
[ROW][C]39[/C][C] 0.7138[/C][C] 0.5723[/C][C] 0.2862[/C][/ROW]
[ROW][C]40[/C][C] 0.7083[/C][C] 0.5834[/C][C] 0.2917[/C][/ROW]
[ROW][C]41[/C][C] 0.9931[/C][C] 0.01381[/C][C] 0.006906[/C][/ROW]
[ROW][C]42[/C][C] 0.9952[/C][C] 0.009678[/C][C] 0.004839[/C][/ROW]
[ROW][C]43[/C][C] 0.993[/C][C] 0.01396[/C][C] 0.00698[/C][/ROW]
[ROW][C]44[/C][C] 0.9905[/C][C] 0.0191[/C][C] 0.009549[/C][/ROW]
[ROW][C]45[/C][C] 0.9872[/C][C] 0.02555[/C][C] 0.01277[/C][/ROW]
[ROW][C]46[/C][C] 0.9846[/C][C] 0.03072[/C][C] 0.01536[/C][/ROW]
[ROW][C]47[/C][C] 0.9806[/C][C] 0.03873[/C][C] 0.01936[/C][/ROW]
[ROW][C]48[/C][C] 0.9747[/C][C] 0.0505[/C][C] 0.02525[/C][/ROW]
[ROW][C]49[/C][C] 0.9781[/C][C] 0.04383[/C][C] 0.02191[/C][/ROW]
[ROW][C]50[/C][C] 0.9714[/C][C] 0.0572[/C][C] 0.0286[/C][/ROW]
[ROW][C]51[/C][C] 0.9803[/C][C] 0.03935[/C][C] 0.01967[/C][/ROW]
[ROW][C]52[/C][C] 0.9853[/C][C] 0.02934[/C][C] 0.01467[/C][/ROW]
[ROW][C]53[/C][C] 0.9806[/C][C] 0.03871[/C][C] 0.01935[/C][/ROW]
[ROW][C]54[/C][C] 0.9878[/C][C] 0.02437[/C][C] 0.01218[/C][/ROW]
[ROW][C]55[/C][C] 0.9963[/C][C] 0.007485[/C][C] 0.003743[/C][/ROW]
[ROW][C]56[/C][C] 0.995[/C][C] 0.01006[/C][C] 0.00503[/C][/ROW]
[ROW][C]57[/C][C] 0.9929[/C][C] 0.01414[/C][C] 0.007071[/C][/ROW]
[ROW][C]58[/C][C] 0.9928[/C][C] 0.01442[/C][C] 0.00721[/C][/ROW]
[ROW][C]59[/C][C] 0.9915[/C][C] 0.01696[/C][C] 0.008479[/C][/ROW]
[ROW][C]60[/C][C] 0.9883[/C][C] 0.02338[/C][C] 0.01169[/C][/ROW]
[ROW][C]61[/C][C] 0.9878[/C][C] 0.02449[/C][C] 0.01225[/C][/ROW]
[ROW][C]62[/C][C] 0.9841[/C][C] 0.03182[/C][C] 0.01591[/C][/ROW]
[ROW][C]63[/C][C] 0.9895[/C][C] 0.02102[/C][C] 0.01051[/C][/ROW]
[ROW][C]64[/C][C] 0.986[/C][C] 0.02807[/C][C] 0.01404[/C][/ROW]
[ROW][C]65[/C][C] 0.9854[/C][C] 0.02919[/C][C] 0.0146[/C][/ROW]
[ROW][C]66[/C][C] 0.9864[/C][C] 0.0271[/C][C] 0.01355[/C][/ROW]
[ROW][C]67[/C][C] 0.9914[/C][C] 0.01725[/C][C] 0.008627[/C][/ROW]
[ROW][C]68[/C][C] 0.9889[/C][C] 0.02225[/C][C] 0.01112[/C][/ROW]
[ROW][C]69[/C][C] 0.9871[/C][C] 0.02578[/C][C] 0.01289[/C][/ROW]
[ROW][C]70[/C][C] 0.9869[/C][C] 0.02625[/C][C] 0.01312[/C][/ROW]
[ROW][C]71[/C][C] 0.9835[/C][C] 0.03299[/C][C] 0.0165[/C][/ROW]
[ROW][C]72[/C][C] 0.986[/C][C] 0.02799[/C][C] 0.01399[/C][/ROW]
[ROW][C]73[/C][C] 0.9831[/C][C] 0.03386[/C][C] 0.01693[/C][/ROW]
[ROW][C]74[/C][C] 0.9817[/C][C] 0.0366[/C][C] 0.0183[/C][/ROW]
[ROW][C]75[/C][C] 0.976[/C][C] 0.04794[/C][C] 0.02397[/C][/ROW]
[ROW][C]76[/C][C] 0.9806[/C][C] 0.03888[/C][C] 0.01944[/C][/ROW]
[ROW][C]77[/C][C] 0.9743[/C][C] 0.0515[/C][C] 0.02575[/C][/ROW]
[ROW][C]78[/C][C] 0.9716[/C][C] 0.0569[/C][C] 0.02845[/C][/ROW]
[ROW][C]79[/C][C] 0.9835[/C][C] 0.03297[/C][C] 0.01648[/C][/ROW]
[ROW][C]80[/C][C] 0.9824[/C][C] 0.03527[/C][C] 0.01764[/C][/ROW]
[ROW][C]81[/C][C] 0.9773[/C][C] 0.04542[/C][C] 0.02271[/C][/ROW]
[ROW][C]82[/C][C] 0.9835[/C][C] 0.03298[/C][C] 0.01649[/C][/ROW]
[ROW][C]83[/C][C] 0.9782[/C][C] 0.0437[/C][C] 0.02185[/C][/ROW]
[ROW][C]84[/C][C] 0.9737[/C][C] 0.0526[/C][C] 0.0263[/C][/ROW]
[ROW][C]85[/C][C] 0.9781[/C][C] 0.04389[/C][C] 0.02195[/C][/ROW]
[ROW][C]86[/C][C] 0.9777[/C][C] 0.04454[/C][C] 0.02227[/C][/ROW]
[ROW][C]87[/C][C] 0.9802[/C][C] 0.03957[/C][C] 0.01978[/C][/ROW]
[ROW][C]88[/C][C] 0.9771[/C][C] 0.04584[/C][C] 0.02292[/C][/ROW]
[ROW][C]89[/C][C] 0.9708[/C][C] 0.05842[/C][C] 0.02921[/C][/ROW]
[ROW][C]90[/C][C] 0.9704[/C][C] 0.05927[/C][C] 0.02964[/C][/ROW]
[ROW][C]91[/C][C] 0.9685[/C][C] 0.06305[/C][C] 0.03152[/C][/ROW]
[ROW][C]92[/C][C] 0.9588[/C][C] 0.08247[/C][C] 0.04123[/C][/ROW]
[ROW][C]93[/C][C] 0.9855[/C][C] 0.0291[/C][C] 0.01455[/C][/ROW]
[ROW][C]94[/C][C] 0.9806[/C][C] 0.03887[/C][C] 0.01944[/C][/ROW]
[ROW][C]95[/C][C] 0.9783[/C][C] 0.04332[/C][C] 0.02166[/C][/ROW]
[ROW][C]96[/C][C] 0.9805[/C][C] 0.03907[/C][C] 0.01954[/C][/ROW]
[ROW][C]97[/C][C] 0.9776[/C][C] 0.04486[/C][C] 0.02243[/C][/ROW]
[ROW][C]98[/C][C] 0.9712[/C][C] 0.05752[/C][C] 0.02876[/C][/ROW]
[ROW][C]99[/C][C] 0.9658[/C][C] 0.0684[/C][C] 0.0342[/C][/ROW]
[ROW][C]100[/C][C] 0.959[/C][C] 0.082[/C][C] 0.041[/C][/ROW]
[ROW][C]101[/C][C] 0.9726[/C][C] 0.05484[/C][C] 0.02742[/C][/ROW]
[ROW][C]102[/C][C] 0.9673[/C][C] 0.06534[/C][C] 0.03267[/C][/ROW]
[ROW][C]103[/C][C] 0.9855[/C][C] 0.02904[/C][C] 0.01452[/C][/ROW]
[ROW][C]104[/C][C] 0.9803[/C][C] 0.03936[/C][C] 0.01968[/C][/ROW]
[ROW][C]105[/C][C] 0.9822[/C][C] 0.03552[/C][C] 0.01776[/C][/ROW]
[ROW][C]106[/C][C] 0.9803[/C][C] 0.03931[/C][C] 0.01965[/C][/ROW]
[ROW][C]107[/C][C] 0.9736[/C][C] 0.05281[/C][C] 0.0264[/C][/ROW]
[ROW][C]108[/C][C] 0.9727[/C][C] 0.05456[/C][C] 0.02728[/C][/ROW]
[ROW][C]109[/C][C] 0.972[/C][C] 0.05593[/C][C] 0.02797[/C][/ROW]
[ROW][C]110[/C][C] 0.9636[/C][C] 0.07283[/C][C] 0.03642[/C][/ROW]
[ROW][C]111[/C][C] 0.9669[/C][C] 0.06629[/C][C] 0.03314[/C][/ROW]
[ROW][C]112[/C][C] 0.9592[/C][C] 0.08154[/C][C] 0.04077[/C][/ROW]
[ROW][C]113[/C][C] 0.9618[/C][C] 0.07644[/C][C] 0.03822[/C][/ROW]
[ROW][C]114[/C][C] 0.9694[/C][C] 0.06114[/C][C] 0.03057[/C][/ROW]
[ROW][C]115[/C][C] 0.9608[/C][C] 0.07835[/C][C] 0.03918[/C][/ROW]
[ROW][C]116[/C][C] 0.951[/C][C] 0.0979[/C][C] 0.04895[/C][/ROW]
[ROW][C]117[/C][C] 0.9382[/C][C] 0.1235[/C][C] 0.06176[/C][/ROW]
[ROW][C]118[/C][C] 0.9406[/C][C] 0.1187[/C][C] 0.05936[/C][/ROW]
[ROW][C]119[/C][C] 0.9207[/C][C] 0.1586[/C][C] 0.07932[/C][/ROW]
[ROW][C]120[/C][C] 0.9288[/C][C] 0.1423[/C][C] 0.07117[/C][/ROW]
[ROW][C]121[/C][C] 0.9202[/C][C] 0.1595[/C][C] 0.07977[/C][/ROW]
[ROW][C]122[/C][C] 0.8979[/C][C] 0.2042[/C][C] 0.1021[/C][/ROW]
[ROW][C]123[/C][C] 0.8884[/C][C] 0.2232[/C][C] 0.1116[/C][/ROW]
[ROW][C]124[/C][C] 0.8573[/C][C] 0.2854[/C][C] 0.1427[/C][/ROW]
[ROW][C]125[/C][C] 0.8218[/C][C] 0.3564[/C][C] 0.1782[/C][/ROW]
[ROW][C]126[/C][C] 0.7942[/C][C] 0.4117[/C][C] 0.2058[/C][/ROW]
[ROW][C]127[/C][C] 0.7605[/C][C] 0.4791[/C][C] 0.2395[/C][/ROW]
[ROW][C]128[/C][C] 0.7593[/C][C] 0.4813[/C][C] 0.2407[/C][/ROW]
[ROW][C]129[/C][C] 0.7188[/C][C] 0.5624[/C][C] 0.2812[/C][/ROW]
[ROW][C]130[/C][C] 0.6667[/C][C] 0.6666[/C][C] 0.3333[/C][/ROW]
[ROW][C]131[/C][C] 0.7137[/C][C] 0.5725[/C][C] 0.2863[/C][/ROW]
[ROW][C]132[/C][C] 0.7013[/C][C] 0.5974[/C][C] 0.2987[/C][/ROW]
[ROW][C]133[/C][C] 0.6392[/C][C] 0.7216[/C][C] 0.3608[/C][/ROW]
[ROW][C]134[/C][C] 0.5688[/C][C] 0.8624[/C][C] 0.4312[/C][/ROW]
[ROW][C]135[/C][C] 0.4925[/C][C] 0.985[/C][C] 0.5075[/C][/ROW]
[ROW][C]136[/C][C] 0.4221[/C][C] 0.8442[/C][C] 0.5779[/C][/ROW]
[ROW][C]137[/C][C] 0.3613[/C][C] 0.7226[/C][C] 0.6387[/C][/ROW]
[ROW][C]138[/C][C] 0.294[/C][C] 0.588[/C][C] 0.706[/C][/ROW]
[ROW][C]139[/C][C] 0.2285[/C][C] 0.4569[/C][C] 0.7715[/C][/ROW]
[ROW][C]140[/C][C] 0.1702[/C][C] 0.3404[/C][C] 0.8298[/C][/ROW]
[ROW][C]141[/C][C] 0.1274[/C][C] 0.2548[/C][C] 0.8726[/C][/ROW]
[ROW][C]142[/C][C] 0.5373[/C][C] 0.9253[/C][C] 0.4627[/C][/ROW]
[ROW][C]143[/C][C] 0.4302[/C][C] 0.8605[/C][C] 0.5698[/C][/ROW]
[ROW][C]144[/C][C] 0.3401[/C][C] 0.6803[/C][C] 0.6599[/C][/ROW]
[ROW][C]145[/C][C] 0.2511[/C][C] 0.5021[/C][C] 0.7489[/C][/ROW]
[ROW][C]146[/C][C] 0.1649[/C][C] 0.3297[/C][C] 0.8351[/C][/ROW]
[ROW][C]147[/C][C] 0.8303[/C][C] 0.3394[/C][C] 0.1697[/C][/ROW]
[/TABLE]
Source: https://freestatistics.org/blog/index.php?pk=&T=5

Globally Unique Identifier (entire table): ba.freestatistics.org/blog/index.php?pk=&T=5

As an alternative you can also use a QR Code:  

The GUIDs for individual cells are displayed in the table below:

Goldfeld-Quandt test for Heteroskedasticity
p-valuesAlternative Hypothesis
breakpoint indexgreater2-sidedless
11 0.2814 0.5628 0.7186
12 0.6808 0.6383 0.3192
13 0.6501 0.6997 0.3499
14 0.6941 0.6117 0.3059
15 0.6831 0.6338 0.3169
16 0.788 0.4239 0.212
17 0.7309 0.5382 0.2691
18 0.6804 0.6393 0.3196
19 0.595 0.8101 0.405
20 0.9694 0.0612 0.0306
21 0.9733 0.05348 0.02674
22 0.9707 0.0586 0.0293
23 0.957 0.08605 0.04302
24 0.9573 0.0854 0.0427
25 0.9461 0.1078 0.05391
26 0.9252 0.1496 0.07481
27 0.9122 0.1756 0.0878
28 0.8852 0.2295 0.1148
29 0.8786 0.2428 0.1214
30 0.9005 0.199 0.09951
31 0.8842 0.2316 0.1158
32 0.8533 0.2934 0.1467
33 0.8338 0.3324 0.1662
34 0.8035 0.3929 0.1965
35 0.7709 0.4582 0.2291
36 0.7348 0.5305 0.2652
37 0.7153 0.5695 0.2847
38 0.6659 0.6682 0.3341
39 0.7138 0.5723 0.2862
40 0.7083 0.5834 0.2917
41 0.9931 0.01381 0.006906
42 0.9952 0.009678 0.004839
43 0.993 0.01396 0.00698
44 0.9905 0.0191 0.009549
45 0.9872 0.02555 0.01277
46 0.9846 0.03072 0.01536
47 0.9806 0.03873 0.01936
48 0.9747 0.0505 0.02525
49 0.9781 0.04383 0.02191
50 0.9714 0.0572 0.0286
51 0.9803 0.03935 0.01967
52 0.9853 0.02934 0.01467
53 0.9806 0.03871 0.01935
54 0.9878 0.02437 0.01218
55 0.9963 0.007485 0.003743
56 0.995 0.01006 0.00503
57 0.9929 0.01414 0.007071
58 0.9928 0.01442 0.00721
59 0.9915 0.01696 0.008479
60 0.9883 0.02338 0.01169
61 0.9878 0.02449 0.01225
62 0.9841 0.03182 0.01591
63 0.9895 0.02102 0.01051
64 0.986 0.02807 0.01404
65 0.9854 0.02919 0.0146
66 0.9864 0.0271 0.01355
67 0.9914 0.01725 0.008627
68 0.9889 0.02225 0.01112
69 0.9871 0.02578 0.01289
70 0.9869 0.02625 0.01312
71 0.9835 0.03299 0.0165
72 0.986 0.02799 0.01399
73 0.9831 0.03386 0.01693
74 0.9817 0.0366 0.0183
75 0.976 0.04794 0.02397
76 0.9806 0.03888 0.01944
77 0.9743 0.0515 0.02575
78 0.9716 0.0569 0.02845
79 0.9835 0.03297 0.01648
80 0.9824 0.03527 0.01764
81 0.9773 0.04542 0.02271
82 0.9835 0.03298 0.01649
83 0.9782 0.0437 0.02185
84 0.9737 0.0526 0.0263
85 0.9781 0.04389 0.02195
86 0.9777 0.04454 0.02227
87 0.9802 0.03957 0.01978
88 0.9771 0.04584 0.02292
89 0.9708 0.05842 0.02921
90 0.9704 0.05927 0.02964
91 0.9685 0.06305 0.03152
92 0.9588 0.08247 0.04123
93 0.9855 0.0291 0.01455
94 0.9806 0.03887 0.01944
95 0.9783 0.04332 0.02166
96 0.9805 0.03907 0.01954
97 0.9776 0.04486 0.02243
98 0.9712 0.05752 0.02876
99 0.9658 0.0684 0.0342
100 0.959 0.082 0.041
101 0.9726 0.05484 0.02742
102 0.9673 0.06534 0.03267
103 0.9855 0.02904 0.01452
104 0.9803 0.03936 0.01968
105 0.9822 0.03552 0.01776
106 0.9803 0.03931 0.01965
107 0.9736 0.05281 0.0264
108 0.9727 0.05456 0.02728
109 0.972 0.05593 0.02797
110 0.9636 0.07283 0.03642
111 0.9669 0.06629 0.03314
112 0.9592 0.08154 0.04077
113 0.9618 0.07644 0.03822
114 0.9694 0.06114 0.03057
115 0.9608 0.07835 0.03918
116 0.951 0.0979 0.04895
117 0.9382 0.1235 0.06176
118 0.9406 0.1187 0.05936
119 0.9207 0.1586 0.07932
120 0.9288 0.1423 0.07117
121 0.9202 0.1595 0.07977
122 0.8979 0.2042 0.1021
123 0.8884 0.2232 0.1116
124 0.8573 0.2854 0.1427
125 0.8218 0.3564 0.1782
126 0.7942 0.4117 0.2058
127 0.7605 0.4791 0.2395
128 0.7593 0.4813 0.2407
129 0.7188 0.5624 0.2812
130 0.6667 0.6666 0.3333
131 0.7137 0.5725 0.2863
132 0.7013 0.5974 0.2987
133 0.6392 0.7216 0.3608
134 0.5688 0.8624 0.4312
135 0.4925 0.985 0.5075
136 0.4221 0.8442 0.5779
137 0.3613 0.7226 0.6387
138 0.294 0.588 0.706
139 0.2285 0.4569 0.7715
140 0.1702 0.3404 0.8298
141 0.1274 0.2548 0.8726
142 0.5373 0.9253 0.4627
143 0.4302 0.8605 0.5698
144 0.3401 0.6803 0.6599
145 0.2511 0.5021 0.7489
146 0.1649 0.3297 0.8351
147 0.8303 0.3394 0.1697


Meta Analysis of Goldfeld-Quandt test for Heteroskedasticity
Description# significant tests% significant testsOK/NOK
1% type I error level2 0.0146NOK
5% type I error level520.379562NOK
10% type I error level810.591241NOK

\begin{tabular}{lllllllll}
\hline
Meta Analysis of Goldfeld-Quandt test for Heteroskedasticity \tabularnewline
Description & # significant tests & % significant tests & OK/NOK \tabularnewline
1% type I error level & 2 &  0.0146 & NOK \tabularnewline
5% type I error level & 52 & 0.379562 & NOK \tabularnewline
10% type I error level & 81 & 0.591241 & NOK \tabularnewline
\hline
\end{tabular}
%Source: https://freestatistics.org/blog/index.php?pk=&T=6

[TABLE]
[ROW][C]Meta Analysis of Goldfeld-Quandt test for Heteroskedasticity[/C][/ROW]
[ROW][C]Description[/C][C]# significant tests[/C][C]% significant tests[/C][C]OK/NOK[/C][/ROW]
[ROW][C]1% type I error level[/C][C]2[/C][C] 0.0146[/C][C]NOK[/C][/ROW]
[ROW][C]5% type I error level[/C][C]52[/C][C]0.379562[/C][C]NOK[/C][/ROW]
[ROW][C]10% type I error level[/C][C]81[/C][C]0.591241[/C][C]NOK[/C][/ROW]
[/TABLE]
Source: https://freestatistics.org/blog/index.php?pk=&T=6

Globally Unique Identifier (entire table): ba.freestatistics.org/blog/index.php?pk=&T=6

As an alternative you can also use a QR Code:  

The GUIDs for individual cells are displayed in the table below:

Meta Analysis of Goldfeld-Quandt test for Heteroskedasticity
Description# significant tests% significant testsOK/NOK
1% type I error level2 0.0146NOK
5% type I error level520.379562NOK
10% type I error level810.591241NOK


Ramsey RESET F-Test for powers (2 and 3) of fitted values
> reset_test_fitted
	RESET test
data:  mylm
RESET = 1.8727, df1 = 2, df2 = 148, p-value = 0.1573
Ramsey RESET F-Test for powers (2 and 3) of regressors
> reset_test_regressors
	RESET test
data:  mylm
RESET = 0.54204, df1 = 14, df2 = 136, p-value = 0.9041
Ramsey RESET F-Test for powers (2 and 3) of principal components
> reset_test_principal_components
	RESET test
data:  mylm
RESET = 0.30152, df1 = 2, df2 = 148, p-value = 0.7401

\begin{tabular}{lllllllll}
\hline
Ramsey RESET F-Test for powers (2 and 3) of fitted values \tabularnewline
> reset_test_fitted
	RESET test
data:  mylm
RESET = 1.8727, df1 = 2, df2 = 148, p-value = 0.1573
\tabularnewline Ramsey RESET F-Test for powers (2 and 3) of regressors \tabularnewline
> reset_test_regressors
	RESET test
data:  mylm
RESET = 0.54204, df1 = 14, df2 = 136, p-value = 0.9041
\tabularnewline Ramsey RESET F-Test for powers (2 and 3) of principal components \tabularnewline
> reset_test_principal_components
	RESET test
data:  mylm
RESET = 0.30152, df1 = 2, df2 = 148, p-value = 0.7401
\tabularnewline \hline \end{tabular} %Source: https://freestatistics.org/blog/index.php?pk=&T=7

[TABLE]
[ROW][C]Ramsey RESET F-Test for powers (2 and 3) of fitted values[/C][/ROW]
[ROW][C]
> reset_test_fitted
	RESET test
data:  mylm
RESET = 1.8727, df1 = 2, df2 = 148, p-value = 0.1573
[/C][/ROW] [ROW][C]Ramsey RESET F-Test for powers (2 and 3) of regressors[/C][/ROW] [ROW][C]
> reset_test_regressors
	RESET test
data:  mylm
RESET = 0.54204, df1 = 14, df2 = 136, p-value = 0.9041
[/C][/ROW] [ROW][C]Ramsey RESET F-Test for powers (2 and 3) of principal components[/C][/ROW] [ROW][C]
> reset_test_principal_components
	RESET test
data:  mylm
RESET = 0.30152, df1 = 2, df2 = 148, p-value = 0.7401
[/C][/ROW] [/TABLE] Source: https://freestatistics.org/blog/index.php?pk=&T=7

Globally Unique Identifier (entire table): ba.freestatistics.org/blog/index.php?pk=&T=7

As an alternative you can also use a QR Code:  

The GUIDs for individual cells are displayed in the table below:

Ramsey RESET F-Test for powers (2 and 3) of fitted values
> reset_test_fitted
	RESET test
data:  mylm
RESET = 1.8727, df1 = 2, df2 = 148, p-value = 0.1573
Ramsey RESET F-Test for powers (2 and 3) of regressors
> reset_test_regressors
	RESET test
data:  mylm
RESET = 0.54204, df1 = 14, df2 = 136, p-value = 0.9041
Ramsey RESET F-Test for powers (2 and 3) of principal components
> reset_test_principal_components
	RESET test
data:  mylm
RESET = 0.30152, df1 = 2, df2 = 148, p-value = 0.7401


Variance Inflation Factors (Multicollinearity)
> vif
Bevr_Leeftijd        SKEOU1        SKEOU2        SKEOU3        SKEOU4 
     1.062668      1.091582      1.163054      1.056092      1.090233 
       SKEOU5        SKEOU6 
     1.050102      1.043220 

\begin{tabular}{lllllllll}
\hline
Variance Inflation Factors (Multicollinearity) \tabularnewline
> vif
Bevr_Leeftijd        SKEOU1        SKEOU2        SKEOU3        SKEOU4 
     1.062668      1.091582      1.163054      1.056092      1.090233 
       SKEOU5        SKEOU6 
     1.050102      1.043220 
\tabularnewline \hline \end{tabular} %Source: https://freestatistics.org/blog/index.php?pk=&T=8

[TABLE]
[ROW][C]Variance Inflation Factors (Multicollinearity)[/C][/ROW]
[ROW][C]
> vif
Bevr_Leeftijd        SKEOU1        SKEOU2        SKEOU3        SKEOU4 
     1.062668      1.091582      1.163054      1.056092      1.090233 
       SKEOU5        SKEOU6 
     1.050102      1.043220 
[/C][/ROW] [/TABLE] Source: https://freestatistics.org/blog/index.php?pk=&T=8

Globally Unique Identifier (entire table): ba.freestatistics.org/blog/index.php?pk=&T=8

As an alternative you can also use a QR Code:  

The GUIDs for individual cells are displayed in the table below:

Variance Inflation Factors (Multicollinearity)
> vif
Bevr_Leeftijd        SKEOU1        SKEOU2        SKEOU3        SKEOU4 
     1.062668      1.091582      1.163054      1.056092      1.090233 
       SKEOU5        SKEOU6 
     1.050102      1.043220 


Parameters (Session):
par1 = 1111111 ; par2 = 2Do not include Seasonal DummiesDo not include Seasonal DummiesDo not include Seasonal DummiesDo not include Seasonal DummiesDo not include Seasonal DummiesDo not include Seasonal Dummies ; par3 = TRUENo Linear TrendNo Linear TrendNo Linear TrendNo Linear TrendNo Linear TrendNo Linear Trend ; par4 = 0 ;
Parameters (R input):
par1 = 1 ; par2 = Do not include Seasonal Dummies ; par3 = No Linear Trend ; par4 = ; par5 = ;
R code (references can be found in the software module):
library(lattice)
library(lmtest)
library(car)
library(MASS)
n25 <- 25 #minimum number of obs. for Goldfeld-Quandt test
mywarning <- ''
par1 <- as.numeric(par1)
if(is.na(par1)) {
par1 <- 1
mywarning = 'Warning: you did not specify the column number of the endogenous series! The first column was selected by default.'
}
if (par4=='') par4 <- 0
par4 <- as.numeric(par4)
if (par5=='') par5 <- 0
par5 <- as.numeric(par5)
x <- na.omit(t(y))
k <- length(x[1,])
n <- length(x[,1])
x1 <- cbind(x[,par1], x[,1:k!=par1])
mycolnames <- c(colnames(x)[par1], colnames(x)[1:k!=par1])
colnames(x1) <- mycolnames #colnames(x)[par1]
x <- x1
if (par3 == 'First Differences'){
(n <- n -1)
x2 <- array(0, dim=c(n,k), dimnames=list(1:n, paste('(1-B)',colnames(x),sep='')))
for (i in 1:n) {
for (j in 1:k) {
x2[i,j] <- x[i+1,j] - x[i,j]
}
}
x <- x2
}
if (par3 == 'Seasonal Differences (s=12)'){
(n <- n - 12)
x2 <- array(0, dim=c(n,k), dimnames=list(1:n, paste('(1-B12)',colnames(x),sep='')))
for (i in 1:n) {
for (j in 1:k) {
x2[i,j] <- x[i+12,j] - x[i,j]
}
}
x <- x2
}
if (par3 == 'First and Seasonal Differences (s=12)'){
(n <- n -1)
x2 <- array(0, dim=c(n,k), dimnames=list(1:n, paste('(1-B)',colnames(x),sep='')))
for (i in 1:n) {
for (j in 1:k) {
x2[i,j] <- x[i+1,j] - x[i,j]
}
}
x <- x2
(n <- n - 12)
x2 <- array(0, dim=c(n,k), dimnames=list(1:n, paste('(1-B12)',colnames(x),sep='')))
for (i in 1:n) {
for (j in 1:k) {
x2[i,j] <- x[i+12,j] - x[i,j]
}
}
x <- x2
}
if(par4 > 0) {
x2 <- array(0, dim=c(n-par4,par4), dimnames=list(1:(n-par4), paste(colnames(x)[par1],'(t-',1:par4,')',sep='')))
for (i in 1:(n-par4)) {
for (j in 1:par4) {
x2[i,j] <- x[i+par4-j,par1]
}
}
x <- cbind(x[(par4+1):n,], x2)
n <- n - par4
}
if(par5 > 0) {
x2 <- array(0, dim=c(n-par5*12,par5), dimnames=list(1:(n-par5*12), paste(colnames(x)[par1],'(t-',1:par5,'s)',sep='')))
for (i in 1:(n-par5*12)) {
for (j in 1:par5) {
x2[i,j] <- x[i+par5*12-j*12,par1]
}
}
x <- cbind(x[(par5*12+1):n,], x2)
n <- n - par5*12
}
if (par2 == 'Include Monthly Dummies'){
x2 <- array(0, dim=c(n,11), dimnames=list(1:n, paste('M', seq(1:11), sep ='')))
for (i in 1:11){
x2[seq(i,n,12),i] <- 1
}
x <- cbind(x, x2)
}
if (par2 == 'Include Quarterly Dummies'){
x2 <- array(0, dim=c(n,3), dimnames=list(1:n, paste('Q', seq(1:3), sep ='')))
for (i in 1:3){
x2[seq(i,n,4),i] <- 1
}
x <- cbind(x, x2)
}
(k <- length(x[n,]))
if (par3 == 'Linear Trend'){
x <- cbind(x, c(1:n))
colnames(x)[k+1] <- 't'
}
print(x)
(k <- length(x[n,]))
head(x)
df <- as.data.frame(x)
(mylm <- lm(df))
(mysum <- summary(mylm))
if (n > n25) {
kp3 <- k + 3
nmkm3 <- n - k - 3
gqarr <- array(NA, dim=c(nmkm3-kp3+1,3))
numgqtests <- 0
numsignificant1 <- 0
numsignificant5 <- 0
numsignificant10 <- 0
for (mypoint in kp3:nmkm3) {
j <- 0
numgqtests <- numgqtests + 1
for (myalt in c('greater', 'two.sided', 'less')) {
j <- j + 1
gqarr[mypoint-kp3+1,j] <- gqtest(mylm, point=mypoint, alternative=myalt)$p.value
}
if (gqarr[mypoint-kp3+1,2] < 0.01) numsignificant1 <- numsignificant1 + 1
if (gqarr[mypoint-kp3+1,2] < 0.05) numsignificant5 <- numsignificant5 + 1
if (gqarr[mypoint-kp3+1,2] < 0.10) numsignificant10 <- numsignificant10 + 1
}
gqarr
}
bitmap(file='test0.png')
plot(x[,1], type='l', main='Actuals and Interpolation', ylab='value of Actuals and Interpolation (dots)', xlab='time or index')
points(x[,1]-mysum$resid)
grid()
dev.off()
bitmap(file='test1.png')
plot(mysum$resid, type='b', pch=19, main='Residuals', ylab='value of Residuals', xlab='time or index')
grid()
dev.off()
bitmap(file='test2.png')
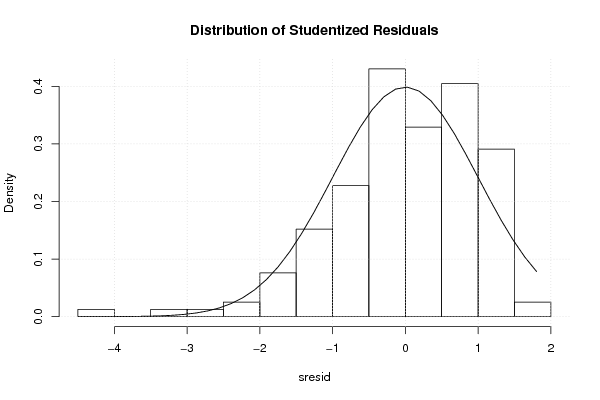
sresid <- studres(mylm)
hist(sresid, freq=FALSE, main='Distribution of Studentized Residuals')
xfit<-seq(min(sresid),max(sresid),length=40)
yfit<-dnorm(xfit)
lines(xfit, yfit)
grid()
dev.off()
bitmap(file='test3.png')
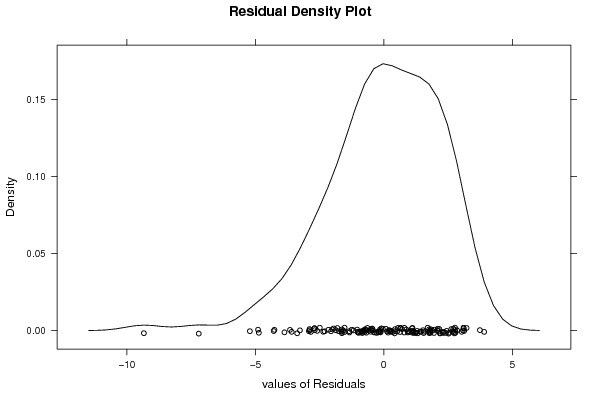
densityplot(~mysum$resid,col='black',main='Residual Density Plot', xlab='values of Residuals')
dev.off()
bitmap(file='test4.png')
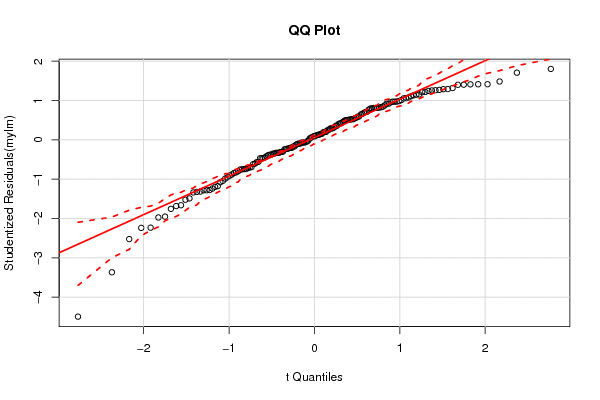
qqPlot(mylm, main='QQ Plot')
grid()
dev.off()
(myerror <- as.ts(mysum$resid))
bitmap(file='test5.png')
dum <- cbind(lag(myerror,k=1),myerror)
dum
dum1 <- dum[2:length(myerror),]
dum1
z <- as.data.frame(dum1)
print(z)
plot(z,main=paste('Residual Lag plot, lowess, and regression line'), ylab='values of Residuals', xlab='lagged values of Residuals')
lines(lowess(z))
abline(lm(z))
grid()
dev.off()
bitmap(file='test6.png')
acf(mysum$resid, lag.max=length(mysum$resid)/2, main='Residual Autocorrelation Function')
grid()
dev.off()
bitmap(file='test7.png')
pacf(mysum$resid, lag.max=length(mysum$resid)/2, main='Residual Partial Autocorrelation Function')
grid()
dev.off()
bitmap(file='test8.png')
opar <- par(mfrow = c(2,2), oma = c(0, 0, 1.1, 0))
plot(mylm, las = 1, sub='Residual Diagnostics')
par(opar)
dev.off()
if (n > n25) {
bitmap(file='test9.png')
plot(kp3:nmkm3,gqarr[,2], main='Goldfeld-Quandt test',ylab='2-sided p-value',xlab='breakpoint')
grid()
dev.off()
}
load(file='createtable')
a<-table.start()
a<-table.row.start(a)
a<-table.element(a, 'Multiple Linear Regression - Estimated Regression Equation', 1, TRUE)
a<-table.row.end(a)
myeq <- colnames(x)[1]
myeq <- paste(myeq, '[t] = ', sep='')
for (i in 1:k){
if (mysum$coefficients[i,1] > 0) myeq <- paste(myeq, '+', '')
myeq <- paste(myeq, signif(mysum$coefficients[i,1],6), sep=' ')
if (rownames(mysum$coefficients)[i] != '(Intercept)') {
myeq <- paste(myeq, rownames(mysum$coefficients)[i], sep='')
if (rownames(mysum$coefficients)[i] != 't') myeq <- paste(myeq, '[t]', sep='')
}
}
myeq <- paste(myeq, ' + e[t]')
a<-table.row.start(a)
a<-table.element(a, myeq)
a<-table.row.end(a)
a<-table.row.start(a)
a<-table.element(a, mywarning)
a<-table.row.end(a)
a<-table.end(a)
table.save(a,file='mytable1.tab')
a<-table.start()
a<-table.row.start(a)
a<-table.element(a,'Multiple Linear Regression - Ordinary Least Squares', 6, TRUE)
a<-table.row.end(a)
a<-table.row.start(a)
a<-table.element(a,'Variable',header=TRUE)
a<-table.element(a,'Parameter',header=TRUE)
a<-table.element(a,'S.D.',header=TRUE)
a<-table.element(a,'T-STAT
H0: parameter = 0',header=TRUE)
a<-table.element(a,'2-tail p-value',header=TRUE)
a<-table.element(a,'1-tail p-value',header=TRUE)
a<-table.row.end(a)
for (i in 1:k){
a<-table.row.start(a)
a<-table.element(a,rownames(mysum$coefficients)[i],header=TRUE)
a<-table.element(a,formatC(signif(mysum$coefficients[i,1],5),format='g',flag='+'))
a<-table.element(a,formatC(signif(mysum$coefficients[i,2],5),format='g',flag=' '))
a<-table.element(a,formatC(signif(mysum$coefficients[i,3],4),format='e',flag='+'))
a<-table.element(a,formatC(signif(mysum$coefficients[i,4],4),format='g',flag=' '))
a<-table.element(a,formatC(signif(mysum$coefficients[i,4]/2,4),format='g',flag=' '))
a<-table.row.end(a)
}
a<-table.end(a)
table.save(a,file='mytable2.tab')
a<-table.start()
a<-table.row.start(a)
a<-table.element(a, 'Multiple Linear Regression - Regression Statistics', 2, TRUE)
a<-table.row.end(a)
a<-table.row.start(a)
a<-table.element(a, 'Multiple R',1,TRUE)
a<-table.element(a,formatC(signif(sqrt(mysum$r.squared),6),format='g',flag=' '))
a<-table.row.end(a)
a<-table.row.start(a)
a<-table.element(a, 'R-squared',1,TRUE)
a<-table.element(a,formatC(signif(mysum$r.squared,6),format='g',flag=' '))
a<-table.row.end(a)
a<-table.row.start(a)
a<-table.element(a, 'Adjusted R-squared',1,TRUE)
a<-table.element(a,formatC(signif(mysum$adj.r.squared,6),format='g',flag=' '))
a<-table.row.end(a)
a<-table.row.start(a)
a<-table.element(a, 'F-TEST (value)',1,TRUE)
a<-table.element(a,formatC(signif(mysum$fstatistic[1],6),format='g',flag=' '))
a<-table.row.end(a)
a<-table.row.start(a)
a<-table.element(a, 'F-TEST (DF numerator)',1,TRUE)
a<-table.element(a, signif(mysum$fstatistic[2],6))
a<-table.row.end(a)
a<-table.row.start(a)
a<-table.element(a, 'F-TEST (DF denominator)',1,TRUE)
a<-table.element(a, signif(mysum$fstatistic[3],6))
a<-table.row.end(a)
a<-table.row.start(a)
a<-table.element(a, 'p-value',1,TRUE)
a<-table.element(a,formatC(signif(1-pf(mysum$fstatistic[1],mysum$fstatistic[2],mysum$fstatistic[3]),6),format='g',flag=' '))
a<-table.row.end(a)
a<-table.row.start(a)
a<-table.element(a, 'Multiple Linear Regression - Residual Statistics', 2, TRUE)
a<-table.row.end(a)
a<-table.row.start(a)
a<-table.element(a, 'Residual Standard Deviation',1,TRUE)
a<-table.element(a,formatC(signif(mysum$sigma,6),format='g',flag=' '))
a<-table.row.end(a)
a<-table.row.start(a)
a<-table.element(a, 'Sum Squared Residuals',1,TRUE)
a<-table.element(a,formatC(signif(sum(myerror*myerror),6),format='g',flag=' '))
a<-table.row.end(a)
a<-table.end(a)
table.save(a,file='mytable3.tab')
myr <- as.numeric(mysum$resid)
myr
if(n < 200) {
a<-table.start()
a<-table.row.start(a)
a<-table.element(a, 'Multiple Linear Regression - Actuals, Interpolation, and Residuals', 4, TRUE)
a<-table.row.end(a)
a<-table.row.start(a)
a<-table.element(a, 'Time or Index', 1, TRUE)
a<-table.element(a, 'Actuals', 1, TRUE)
a<-table.element(a, 'Interpolation
Forecast', 1, TRUE)
a<-table.element(a, 'Residuals
Prediction Error', 1, TRUE)
a<-table.row.end(a)
for (i in 1:n) {
a<-table.row.start(a)
a<-table.element(a,i, 1, TRUE)
a<-table.element(a,formatC(signif(x[i],6),format='g',flag=' '))
a<-table.element(a,formatC(signif(x[i]-mysum$resid[i],6),format='g',flag=' '))
a<-table.element(a,formatC(signif(mysum$resid[i],6),format='g',flag=' '))
a<-table.row.end(a)
}
a<-table.end(a)
table.save(a,file='mytable4.tab')
if (n > n25) {
a<-table.start()
a<-table.row.start(a)
a<-table.element(a,'Goldfeld-Quandt test for Heteroskedasticity',4,TRUE)
a<-table.row.end(a)
a<-table.row.start(a)
a<-table.element(a,'p-values',header=TRUE)
a<-table.element(a,'Alternative Hypothesis',3,header=TRUE)
a<-table.row.end(a)
a<-table.row.start(a)
a<-table.element(a,'breakpoint index',header=TRUE)
a<-table.element(a,'greater',header=TRUE)
a<-table.element(a,'2-sided',header=TRUE)
a<-table.element(a,'less',header=TRUE)
a<-table.row.end(a)
for (mypoint in kp3:nmkm3) {
a<-table.row.start(a)
a<-table.element(a,mypoint,header=TRUE)
a<-table.element(a,formatC(signif(gqarr[mypoint-kp3+1,1],6),format='g',flag=' '))
a<-table.element(a,formatC(signif(gqarr[mypoint-kp3+1,2],6),format='g',flag=' '))
a<-table.element(a,formatC(signif(gqarr[mypoint-kp3+1,3],6),format='g',flag=' '))
a<-table.row.end(a)
}
a<-table.end(a)
table.save(a,file='mytable5.tab')
a<-table.start()
a<-table.row.start(a)
a<-table.element(a,'Meta Analysis of Goldfeld-Quandt test for Heteroskedasticity',4,TRUE)
a<-table.row.end(a)
a<-table.row.start(a)
a<-table.element(a,'Description',header=TRUE)
a<-table.element(a,'# significant tests',header=TRUE)
a<-table.element(a,'% significant tests',header=TRUE)
a<-table.element(a,'OK/NOK',header=TRUE)
a<-table.row.end(a)
a<-table.row.start(a)
a<-table.element(a,'1% type I error level',header=TRUE)
a<-table.element(a,signif(numsignificant1,6))
a<-table.element(a,formatC(signif(numsignificant1/numgqtests,6),format='g',flag=' '))
if (numsignificant1/numgqtests < 0.01) dum <- 'OK' else dum <- 'NOK'
a<-table.element(a,dum)
a<-table.row.end(a)
a<-table.row.start(a)
a<-table.element(a,'5% type I error level',header=TRUE)
a<-table.element(a,signif(numsignificant5,6))
a<-table.element(a,signif(numsignificant5/numgqtests,6))
if (numsignificant5/numgqtests < 0.05) dum <- 'OK' else dum <- 'NOK'
a<-table.element(a,dum)
a<-table.row.end(a)
a<-table.row.start(a)
a<-table.element(a,'10% type I error level',header=TRUE)
a<-table.element(a,signif(numsignificant10,6))
a<-table.element(a,signif(numsignificant10/numgqtests,6))
if (numsignificant10/numgqtests < 0.1) dum <- 'OK' else dum <- 'NOK'
a<-table.element(a,dum)
a<-table.row.end(a)
a<-table.end(a)
table.save(a,file='mytable6.tab')
}
}
a<-table.start()
a<-table.row.start(a)
a<-table.element(a,'Ramsey RESET F-Test for powers (2 and 3) of fitted values',1,TRUE)
a<-table.row.end(a)
a<-table.row.start(a)
reset_test_fitted <- resettest(mylm,power=2:3,type='fitted')
a<-table.element(a,paste('
',RC.texteval('reset_test_fitted'),'
',sep=''))
a<-table.row.end(a)
a<-table.row.start(a)
a<-table.element(a,'Ramsey RESET F-Test for powers (2 and 3) of regressors',1,TRUE)
a<-table.row.end(a)
a<-table.row.start(a)
reset_test_regressors <- resettest(mylm,power=2:3,type='regressor')
a<-table.element(a,paste('
',RC.texteval('reset_test_regressors'),'
',sep=''))
a<-table.row.end(a)
a<-table.row.start(a)
a<-table.element(a,'Ramsey RESET F-Test for powers (2 and 3) of principal components',1,TRUE)
a<-table.row.end(a)
a<-table.row.start(a)
reset_test_principal_components <- resettest(mylm,power=2:3,type='princomp')
a<-table.element(a,paste('
',RC.texteval('reset_test_principal_components'),'
',sep=''))
a<-table.row.end(a)
a<-table.end(a)
table.save(a,file='mytable8.tab')
a<-table.start()
a<-table.row.start(a)
a<-table.element(a,'Variance Inflation Factors (Multicollinearity)',1,TRUE)
a<-table.row.end(a)
a<-table.row.start(a)
vif <- vif(mylm)
a<-table.element(a,paste('
',RC.texteval('vif'),'
',sep=''))
a<-table.row.end(a)
a<-table.end(a)
table.save(a,file='mytable9.tab')