Free Statistics

of Irreproducible Research!

Author's title

Author*The author of this computation has been verified*
R Software Modulerwasp_arimaforecasting.wasp
Title produced by softwareARIMA Forecasting
Date of computationSat, 21 Jan 2017 18:50:46 +0100
Cite this page as followsStatistical Computations at FreeStatistics.org, Office for Research Development and Education, URL https://freestatistics.org/blog/index.php?v=date/2017/Jan/21/t1485021093d2rw60bqsebo8qf.htm/, Retrieved Mon, 13 May 2024 20:42:18 +0000
Statistical Computations at FreeStatistics.org, Office for Research Development and Education, URL https://freestatistics.org/blog/index.php?pk=303288, Retrieved Mon, 13 May 2024 20:42:18 +0000
QR Codes:

Original text written by user:
IsPrivate?No (this computation is public)
User-defined keywords
Estimated Impact47
Family? (F = Feedback message, R = changed R code, M = changed R Module, P = changed Parameters, D = changed Data)
-       [ARIMA Forecasting] [] [2017-01-21 17:50:46] [673dd365cbcfe0c4e35658a2fe545652] [Current]
Feedback Forum

Post a new message
Dataseries X:
4678.2
3300.8
3823
4085.4
3742.4
4505
4259.4
4236
4529.8
4982
5151
5077.6
4944.2
4986
5949.8
4649.4
4564.4
4634
4993.6
4686.2
4511
4554.6
5447.2
5150.8
5184
4671
4640.6
4773
5019.8
5627.4
5273
5626.4
5574.4
5414.4
4517.8
5889.6
6024.4
5354.6
5883.6
5233.4
5268.2
4790.6
5607
4922.6
5610.8
5442.8
5517
5902.6
5576.8
5675
6109.6
5839.6
6175.8
5784.6
6059.6
5424.6
5184.2
5742.6
5835.8
6002.6
6490.2
6231.4
6016.6
6399.2
5666.8
6612.6
6290.4
6496.6
6271
6948.8
6216.4
8094.8
7462.2
6713.6
7390
7272.6
6258
6377.2
6981
6569
6289
6208
7210
7919.6
5471.8
6113.4
7464.2
6250.2
6601.8
6489.2
6545.6
6559.4
6385.8
7090.4
5306.6
6509
6020.2
5984.8
5505.8
5347.2
5656.2
5571.8
7332.8
6561.4
5677
6298.6
6511.4
5587.4
5867.6
5857.6
6315
6585
6151.2
6216.6
5517.2
5689


Summary of computational transaction
Raw Input view raw input (R code)
Raw Outputview raw output of R engine
Computing time3 seconds
R ServerBig Analytics Cloud Computing Center

\begin{tabular}{lllllllll}
\hline
Summary of computational transaction \tabularnewline
Raw Input view raw input (R code)  \tabularnewline
Raw Outputview raw output of R engine  \tabularnewline
Computing time3 seconds \tabularnewline
R ServerBig Analytics Cloud Computing Center \tabularnewline
\hline
\end{tabular}
%Source: https://freestatistics.org/blog/index.php?pk=303288&T=0

[TABLE]
[ROW]
Summary of computational transaction[/C][/ROW] [ROW]Raw Input[/C] view raw input (R code) [/C][/ROW] [ROW]Raw Output[/C]view raw output of R engine [/C][/ROW] [ROW]Computing time[/C]3 seconds[/C][/ROW] [ROW]R Server[/C]Big Analytics Cloud Computing Center[/C][/ROW] [/TABLE] Source: https://freestatistics.org/blog/index.php?pk=303288&T=0

Globally Unique Identifier (entire table): ba.freestatistics.org/blog/index.php?pk=303288&T=0

As an alternative you can also use a QR Code:  

The GUIDs for individual cells are displayed in the table below:

Summary of computational transaction
Raw Input view raw input (R code)
Raw Outputview raw output of R engine
Computing time3 seconds
R ServerBig Analytics Cloud Computing Center


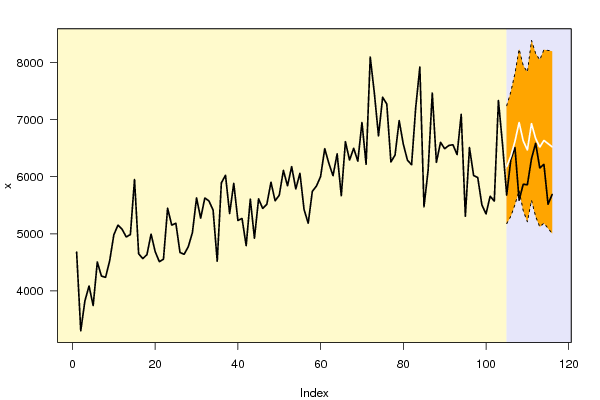
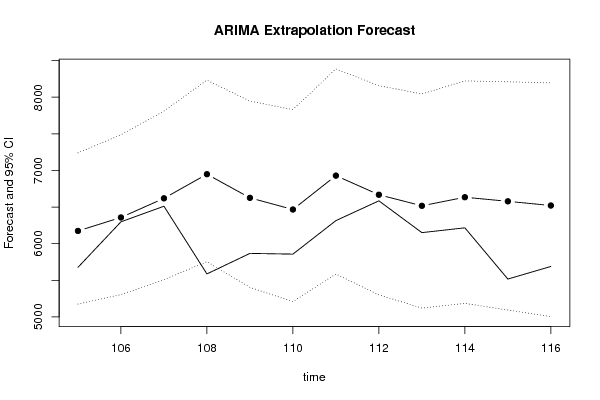
Univariate ARIMA Extrapolation Forecast
timeY[t]F[t]95% LB95% UBp-value(H0: Y[t] = F[t])P(F[t]>Y[t-1])P(F[t]>Y[t-s])P(F[t]>Y[104])
926559.4-------
936385.8-------
947090.4-------
955306.6-------
966509-------
976020.2-------
985984.8-------
995505.8-------
1005347.2-------
1015656.2-------
1025571.8-------
1037332.8-------
1046561.4-------
10556776174.03735176.02077241.21140.18070.23840.34870.2384
1066298.66358.17885305.36987485.8540.45880.88180.10160.362
1076511.46619.24845509.197809.3320.42950.70130.98470.538
1085587.46948.77155754.06548231.950.01880.7480.74910.723
1095867.66626.03715403.49377946.30810.13010.93850.81580.5382
1105857.66466.66395209.02577830.76960.19080.80530.75560.4459
11163156929.26755586.15078385.67460.20420.92540.97230.6897
11265856668.21465301.6828157.25910.45640.6790.9590.5559
1136151.26517.36085121.10428045.06410.31930.46540.86540.4775
1146216.66634.32245185.45498222.51340.30310.72450.90510.5359
1155517.26578.41015094.41018210.33170.10120.66810.18250.5081
11656896521.31945003.90078195.29480.16490.88010.48130.4813

\begin{tabular}{lllllllll}
\hline
Univariate ARIMA Extrapolation Forecast \tabularnewline
time & Y[t] & F[t] & 95% LB & 95% UB & p-value(H0: Y[t] = F[t]) & P(F[t]>Y[t-1]) & P(F[t]>Y[t-s]) & P(F[t]>Y[104]) \tabularnewline
92 & 6559.4 & - & - & - & - & - & - & - \tabularnewline
93 & 6385.8 & - & - & - & - & - & - & - \tabularnewline
94 & 7090.4 & - & - & - & - & - & - & - \tabularnewline
95 & 5306.6 & - & - & - & - & - & - & - \tabularnewline
96 & 6509 & - & - & - & - & - & - & - \tabularnewline
97 & 6020.2 & - & - & - & - & - & - & - \tabularnewline
98 & 5984.8 & - & - & - & - & - & - & - \tabularnewline
99 & 5505.8 & - & - & - & - & - & - & - \tabularnewline
100 & 5347.2 & - & - & - & - & - & - & - \tabularnewline
101 & 5656.2 & - & - & - & - & - & - & - \tabularnewline
102 & 5571.8 & - & - & - & - & - & - & - \tabularnewline
103 & 7332.8 & - & - & - & - & - & - & - \tabularnewline
104 & 6561.4 & - & - & - & - & - & - & - \tabularnewline
105 & 5677 & 6174.0373 & 5176.0207 & 7241.2114 & 0.1807 & 0.2384 & 0.3487 & 0.2384 \tabularnewline
106 & 6298.6 & 6358.1788 & 5305.3698 & 7485.854 & 0.4588 & 0.8818 & 0.1016 & 0.362 \tabularnewline
107 & 6511.4 & 6619.2484 & 5509.19 & 7809.332 & 0.4295 & 0.7013 & 0.9847 & 0.538 \tabularnewline
108 & 5587.4 & 6948.7715 & 5754.0654 & 8231.95 & 0.0188 & 0.748 & 0.7491 & 0.723 \tabularnewline
109 & 5867.6 & 6626.0371 & 5403.4937 & 7946.3081 & 0.1301 & 0.9385 & 0.8158 & 0.5382 \tabularnewline
110 & 5857.6 & 6466.6639 & 5209.0257 & 7830.7696 & 0.1908 & 0.8053 & 0.7556 & 0.4459 \tabularnewline
111 & 6315 & 6929.2675 & 5586.1507 & 8385.6746 & 0.2042 & 0.9254 & 0.9723 & 0.6897 \tabularnewline
112 & 6585 & 6668.2146 & 5301.682 & 8157.2591 & 0.4564 & 0.679 & 0.959 & 0.5559 \tabularnewline
113 & 6151.2 & 6517.3608 & 5121.1042 & 8045.0641 & 0.3193 & 0.4654 & 0.8654 & 0.4775 \tabularnewline
114 & 6216.6 & 6634.3224 & 5185.4549 & 8222.5134 & 0.3031 & 0.7245 & 0.9051 & 0.5359 \tabularnewline
115 & 5517.2 & 6578.4101 & 5094.4101 & 8210.3317 & 0.1012 & 0.6681 & 0.1825 & 0.5081 \tabularnewline
116 & 5689 & 6521.3194 & 5003.9007 & 8195.2948 & 0.1649 & 0.8801 & 0.4813 & 0.4813 \tabularnewline
\hline
\end{tabular}
%Source: https://freestatistics.org/blog/index.php?pk=303288&T=1

[TABLE]
[ROW][C]Univariate ARIMA Extrapolation Forecast[/C][/ROW]
[ROW][C]time[/C][C]Y[t][/C][C]F[t][/C][C]95% LB[/C][C]95% UB[/C][C]p-value(H0: Y[t] = F[t])[/C][C]P(F[t]>Y[t-1])[/C][C]P(F[t]>Y[t-s])[/C][C]P(F[t]>Y[104])[/C][/ROW]
[ROW][C]92[/C][C]6559.4[/C][C]-[/C][C]-[/C][C]-[/C][C]-[/C][C]-[/C][C]-[/C][C]-[/C][/ROW]
[ROW][C]93[/C][C]6385.8[/C][C]-[/C][C]-[/C][C]-[/C][C]-[/C][C]-[/C][C]-[/C][C]-[/C][/ROW]
[ROW][C]94[/C][C]7090.4[/C][C]-[/C][C]-[/C][C]-[/C][C]-[/C][C]-[/C][C]-[/C][C]-[/C][/ROW]
[ROW][C]95[/C][C]5306.6[/C][C]-[/C][C]-[/C][C]-[/C][C]-[/C][C]-[/C][C]-[/C][C]-[/C][/ROW]
[ROW][C]96[/C][C]6509[/C][C]-[/C][C]-[/C][C]-[/C][C]-[/C][C]-[/C][C]-[/C][C]-[/C][/ROW]
[ROW][C]97[/C][C]6020.2[/C][C]-[/C][C]-[/C][C]-[/C][C]-[/C][C]-[/C][C]-[/C][C]-[/C][/ROW]
[ROW][C]98[/C][C]5984.8[/C][C]-[/C][C]-[/C][C]-[/C][C]-[/C][C]-[/C][C]-[/C][C]-[/C][/ROW]
[ROW][C]99[/C][C]5505.8[/C][C]-[/C][C]-[/C][C]-[/C][C]-[/C][C]-[/C][C]-[/C][C]-[/C][/ROW]
[ROW][C]100[/C][C]5347.2[/C][C]-[/C][C]-[/C][C]-[/C][C]-[/C][C]-[/C][C]-[/C][C]-[/C][/ROW]
[ROW][C]101[/C][C]5656.2[/C][C]-[/C][C]-[/C][C]-[/C][C]-[/C][C]-[/C][C]-[/C][C]-[/C][/ROW]
[ROW][C]102[/C][C]5571.8[/C][C]-[/C][C]-[/C][C]-[/C][C]-[/C][C]-[/C][C]-[/C][C]-[/C][/ROW]
[ROW][C]103[/C][C]7332.8[/C][C]-[/C][C]-[/C][C]-[/C][C]-[/C][C]-[/C][C]-[/C][C]-[/C][/ROW]
[ROW][C]104[/C][C]6561.4[/C][C]-[/C][C]-[/C][C]-[/C][C]-[/C][C]-[/C][C]-[/C][C]-[/C][/ROW]
[ROW][C]105[/C][C]5677[/C][C]6174.0373[/C][C]5176.0207[/C][C]7241.2114[/C][C]0.1807[/C][C]0.2384[/C][C]0.3487[/C][C]0.2384[/C][/ROW]
[ROW][C]106[/C][C]6298.6[/C][C]6358.1788[/C][C]5305.3698[/C][C]7485.854[/C][C]0.4588[/C][C]0.8818[/C][C]0.1016[/C][C]0.362[/C][/ROW]
[ROW][C]107[/C][C]6511.4[/C][C]6619.2484[/C][C]5509.19[/C][C]7809.332[/C][C]0.4295[/C][C]0.7013[/C][C]0.9847[/C][C]0.538[/C][/ROW]
[ROW][C]108[/C][C]5587.4[/C][C]6948.7715[/C][C]5754.0654[/C][C]8231.95[/C][C]0.0188[/C][C]0.748[/C][C]0.7491[/C][C]0.723[/C][/ROW]
[ROW][C]109[/C][C]5867.6[/C][C]6626.0371[/C][C]5403.4937[/C][C]7946.3081[/C][C]0.1301[/C][C]0.9385[/C][C]0.8158[/C][C]0.5382[/C][/ROW]
[ROW][C]110[/C][C]5857.6[/C][C]6466.6639[/C][C]5209.0257[/C][C]7830.7696[/C][C]0.1908[/C][C]0.8053[/C][C]0.7556[/C][C]0.4459[/C][/ROW]
[ROW][C]111[/C][C]6315[/C][C]6929.2675[/C][C]5586.1507[/C][C]8385.6746[/C][C]0.2042[/C][C]0.9254[/C][C]0.9723[/C][C]0.6897[/C][/ROW]
[ROW][C]112[/C][C]6585[/C][C]6668.2146[/C][C]5301.682[/C][C]8157.2591[/C][C]0.4564[/C][C]0.679[/C][C]0.959[/C][C]0.5559[/C][/ROW]
[ROW][C]113[/C][C]6151.2[/C][C]6517.3608[/C][C]5121.1042[/C][C]8045.0641[/C][C]0.3193[/C][C]0.4654[/C][C]0.8654[/C][C]0.4775[/C][/ROW]
[ROW][C]114[/C][C]6216.6[/C][C]6634.3224[/C][C]5185.4549[/C][C]8222.5134[/C][C]0.3031[/C][C]0.7245[/C][C]0.9051[/C][C]0.5359[/C][/ROW]
[ROW][C]115[/C][C]5517.2[/C][C]6578.4101[/C][C]5094.4101[/C][C]8210.3317[/C][C]0.1012[/C][C]0.6681[/C][C]0.1825[/C][C]0.5081[/C][/ROW]
[ROW][C]116[/C][C]5689[/C][C]6521.3194[/C][C]5003.9007[/C][C]8195.2948[/C][C]0.1649[/C][C]0.8801[/C][C]0.4813[/C][C]0.4813[/C][/ROW]
[/TABLE]
Source: https://freestatistics.org/blog/index.php?pk=303288&T=1

Globally Unique Identifier (entire table): ba.freestatistics.org/blog/index.php?pk=303288&T=1

As an alternative you can also use a QR Code:  

The GUIDs for individual cells are displayed in the table below:

Univariate ARIMA Extrapolation Forecast
timeY[t]F[t]95% LB95% UBp-value(H0: Y[t] = F[t])P(F[t]>Y[t-1])P(F[t]>Y[t-s])P(F[t]>Y[104])
926559.4-------
936385.8-------
947090.4-------
955306.6-------
966509-------
976020.2-------
985984.8-------
995505.8-------
1005347.2-------
1015656.2-------
1025571.8-------
1037332.8-------
1046561.4-------
10556776174.03735176.02077241.21140.18070.23840.34870.2384
1066298.66358.17885305.36987485.8540.45880.88180.10160.362
1076511.46619.24845509.197809.3320.42950.70130.98470.538
1085587.46948.77155754.06548231.950.01880.7480.74910.723
1095867.66626.03715403.49377946.30810.13010.93850.81580.5382
1105857.66466.66395209.02577830.76960.19080.80530.75560.4459
11163156929.26755586.15078385.67460.20420.92540.97230.6897
11265856668.21465301.6828157.25910.45640.6790.9590.5559
1136151.26517.36085121.10428045.06410.31930.46540.86540.4775
1146216.66634.32245185.45498222.51340.30310.72450.90510.5359
1155517.26578.41015094.41018210.33170.10120.66810.18250.5081
11656896521.31945003.90078195.29480.16490.88010.48130.4813


Univariate ARIMA Extrapolation Forecast Performance
time% S.E.PEMAPEsMAPESq.EMSERMSEScaledEMASE
1050.0882-0.08760.08760.0839247046.124100-1.31861.3186
1060.0905-0.00950.04850.04663549.6372125297.8806353.9744-0.15810.7383
1070.0917-0.01660.03790.036611631.274487409.0119295.6502-0.28610.5876
1080.0942-0.24370.08930.08171853332.292528889.8319727.2481-3.61161.3436
1090.1017-0.12930.09730.0897575226.7914538157.2238733.592-2.01211.4773
1100.1076-0.1040.09840.0912370958.843510290.827714.3464-1.61581.5004
1110.1072-0.09730.09820.0914377324.5508491295.6447700.9248-1.62961.5188
1120.1139-0.01260.08750.08166924.6709430749.273656.3149-0.22081.3566
1130.1196-0.05950.08440.0789134073.7234397785.323630.7022-0.97141.3138
1140.1221-0.06720.08270.0775174491.9807375455.9888612.7446-1.10821.2932
1150.1266-0.19230.09270.08641126166.7923443702.4255666.1099-2.81531.4316
1160.131-0.14630.09710.0906692755.555464456.8529681.5107-2.20811.4963

\begin{tabular}{lllllllll}
\hline
Univariate ARIMA Extrapolation Forecast Performance \tabularnewline
time & % S.E. & PE & MAPE & sMAPE & Sq.E & MSE & RMSE & ScaledE & MASE \tabularnewline
105 & 0.0882 & -0.0876 & 0.0876 & 0.0839 & 247046.1241 & 0 & 0 & -1.3186 & 1.3186 \tabularnewline
106 & 0.0905 & -0.0095 & 0.0485 & 0.0466 & 3549.6372 & 125297.8806 & 353.9744 & -0.1581 & 0.7383 \tabularnewline
107 & 0.0917 & -0.0166 & 0.0379 & 0.0366 & 11631.2744 & 87409.0119 & 295.6502 & -0.2861 & 0.5876 \tabularnewline
108 & 0.0942 & -0.2437 & 0.0893 & 0.0817 & 1853332.292 & 528889.8319 & 727.2481 & -3.6116 & 1.3436 \tabularnewline
109 & 0.1017 & -0.1293 & 0.0973 & 0.0897 & 575226.7914 & 538157.2238 & 733.592 & -2.0121 & 1.4773 \tabularnewline
110 & 0.1076 & -0.104 & 0.0984 & 0.0912 & 370958.843 & 510290.827 & 714.3464 & -1.6158 & 1.5004 \tabularnewline
111 & 0.1072 & -0.0973 & 0.0982 & 0.0914 & 377324.5508 & 491295.6447 & 700.9248 & -1.6296 & 1.5188 \tabularnewline
112 & 0.1139 & -0.0126 & 0.0875 & 0.0816 & 6924.6709 & 430749.273 & 656.3149 & -0.2208 & 1.3566 \tabularnewline
113 & 0.1196 & -0.0595 & 0.0844 & 0.0789 & 134073.7234 & 397785.323 & 630.7022 & -0.9714 & 1.3138 \tabularnewline
114 & 0.1221 & -0.0672 & 0.0827 & 0.0775 & 174491.9807 & 375455.9888 & 612.7446 & -1.1082 & 1.2932 \tabularnewline
115 & 0.1266 & -0.1923 & 0.0927 & 0.0864 & 1126166.7923 & 443702.4255 & 666.1099 & -2.8153 & 1.4316 \tabularnewline
116 & 0.131 & -0.1463 & 0.0971 & 0.0906 & 692755.555 & 464456.8529 & 681.5107 & -2.2081 & 1.4963 \tabularnewline
\hline
\end{tabular}
%Source: https://freestatistics.org/blog/index.php?pk=303288&T=2

[TABLE]
[ROW][C]Univariate ARIMA Extrapolation Forecast Performance[/C][/ROW]
[ROW][C]time[/C][C]% S.E.[/C][C]PE[/C][C]MAPE[/C][C]sMAPE[/C][C]Sq.E[/C][C]MSE[/C][C]RMSE[/C][C]ScaledE[/C][C]MASE[/C][/ROW]
[ROW][C]105[/C][C]0.0882[/C][C]-0.0876[/C][C]0.0876[/C][C]0.0839[/C][C]247046.1241[/C][C]0[/C][C]0[/C][C]-1.3186[/C][C]1.3186[/C][/ROW]
[ROW][C]106[/C][C]0.0905[/C][C]-0.0095[/C][C]0.0485[/C][C]0.0466[/C][C]3549.6372[/C][C]125297.8806[/C][C]353.9744[/C][C]-0.1581[/C][C]0.7383[/C][/ROW]
[ROW][C]107[/C][C]0.0917[/C][C]-0.0166[/C][C]0.0379[/C][C]0.0366[/C][C]11631.2744[/C][C]87409.0119[/C][C]295.6502[/C][C]-0.2861[/C][C]0.5876[/C][/ROW]
[ROW][C]108[/C][C]0.0942[/C][C]-0.2437[/C][C]0.0893[/C][C]0.0817[/C][C]1853332.292[/C][C]528889.8319[/C][C]727.2481[/C][C]-3.6116[/C][C]1.3436[/C][/ROW]
[ROW][C]109[/C][C]0.1017[/C][C]-0.1293[/C][C]0.0973[/C][C]0.0897[/C][C]575226.7914[/C][C]538157.2238[/C][C]733.592[/C][C]-2.0121[/C][C]1.4773[/C][/ROW]
[ROW][C]110[/C][C]0.1076[/C][C]-0.104[/C][C]0.0984[/C][C]0.0912[/C][C]370958.843[/C][C]510290.827[/C][C]714.3464[/C][C]-1.6158[/C][C]1.5004[/C][/ROW]
[ROW][C]111[/C][C]0.1072[/C][C]-0.0973[/C][C]0.0982[/C][C]0.0914[/C][C]377324.5508[/C][C]491295.6447[/C][C]700.9248[/C][C]-1.6296[/C][C]1.5188[/C][/ROW]
[ROW][C]112[/C][C]0.1139[/C][C]-0.0126[/C][C]0.0875[/C][C]0.0816[/C][C]6924.6709[/C][C]430749.273[/C][C]656.3149[/C][C]-0.2208[/C][C]1.3566[/C][/ROW]
[ROW][C]113[/C][C]0.1196[/C][C]-0.0595[/C][C]0.0844[/C][C]0.0789[/C][C]134073.7234[/C][C]397785.323[/C][C]630.7022[/C][C]-0.9714[/C][C]1.3138[/C][/ROW]
[ROW][C]114[/C][C]0.1221[/C][C]-0.0672[/C][C]0.0827[/C][C]0.0775[/C][C]174491.9807[/C][C]375455.9888[/C][C]612.7446[/C][C]-1.1082[/C][C]1.2932[/C][/ROW]
[ROW][C]115[/C][C]0.1266[/C][C]-0.1923[/C][C]0.0927[/C][C]0.0864[/C][C]1126166.7923[/C][C]443702.4255[/C][C]666.1099[/C][C]-2.8153[/C][C]1.4316[/C][/ROW]
[ROW][C]116[/C][C]0.131[/C][C]-0.1463[/C][C]0.0971[/C][C]0.0906[/C][C]692755.555[/C][C]464456.8529[/C][C]681.5107[/C][C]-2.2081[/C][C]1.4963[/C][/ROW]
[/TABLE]
Source: https://freestatistics.org/blog/index.php?pk=303288&T=2

Globally Unique Identifier (entire table): ba.freestatistics.org/blog/index.php?pk=303288&T=2

As an alternative you can also use a QR Code:  

The GUIDs for individual cells are displayed in the table below:

Univariate ARIMA Extrapolation Forecast Performance
time% S.E.PEMAPEsMAPESq.EMSERMSEScaledEMASE
1050.0882-0.08760.08760.0839247046.124100-1.31861.3186
1060.0905-0.00950.04850.04663549.6372125297.8806353.9744-0.15810.7383
1070.0917-0.01660.03790.036611631.274487409.0119295.6502-0.28610.5876
1080.0942-0.24370.08930.08171853332.292528889.8319727.2481-3.61161.3436
1090.1017-0.12930.09730.0897575226.7914538157.2238733.592-2.01211.4773
1100.1076-0.1040.09840.0912370958.843510290.827714.3464-1.61581.5004
1110.1072-0.09730.09820.0914377324.5508491295.6447700.9248-1.62961.5188
1120.1139-0.01260.08750.08166924.6709430749.273656.3149-0.22081.3566
1130.1196-0.05950.08440.0789134073.7234397785.323630.7022-0.97141.3138
1140.1221-0.06720.08270.0775174491.9807375455.9888612.7446-1.10821.2932
1150.1266-0.19230.09270.08641126166.7923443702.4255666.1099-2.81531.4316
1160.131-0.14630.09710.0906692755.555464456.8529681.5107-2.20811.4963


Parameters (Session):
Parameters (R input):
par1 = 12 ; par2 = 0.6 ; par3 = 1 ; par4 = 0 ; par5 = 12 ; par6 = 2 ; par7 = 2 ; par8 = 2 ; par9 = 1 ; par10 = FALSE ;
R code (references can be found in the software module):
par1 <- as.numeric(par1) #cut off periods
par2 <- as.numeric(par2) #lambda
par3 <- as.numeric(par3) #degree of non-seasonal differencing
par4 <- as.numeric(par4) #degree of seasonal differencing
par5 <- as.numeric(par5) #seasonal period
par6 <- as.numeric(par6) #p
par7 <- as.numeric(par7) #q
par8 <- as.numeric(par8) #P
par9 <- as.numeric(par9) #Q
if (par10 == 'TRUE') par10 <- TRUE
if (par10 == 'FALSE') par10 <- FALSE
if (par2 == 0) x <- log(x)
if (par2 != 0) x <- x^par2
lx <- length(x)
first <- lx - 2*par1
nx <- lx - par1
nx1 <- nx + 1
fx <- lx - nx
if (fx < 1) {
fx <- par5*2
nx1 <- lx + fx - 1
first <- lx - 2*fx
}
first <- 1
if (fx < 3) fx <- round(lx/10,0)
(arima.out <- arima(x[1:nx], order=c(par6,par3,par7), seasonal=list(order=c(par8,par4,par9), period=par5), include.mean=par10, method='ML'))
(forecast <- predict(arima.out,fx))
(lb <- forecast$pred - 1.96 * forecast$se)
(ub <- forecast$pred + 1.96 * forecast$se)
if (par2 == 0) {
x <- exp(x)
forecast$pred <- exp(forecast$pred)
lb <- exp(lb)
ub <- exp(ub)
}
if (par2 != 0) {
x <- x^(1/par2)
forecast$pred <- forecast$pred^(1/par2)
lb <- lb^(1/par2)
ub <- ub^(1/par2)
}
if (par2 < 0) {
olb <- lb
lb <- ub
ub <- olb
}
(actandfor <- c(x[1:nx], forecast$pred))
(perc.se <- (ub-forecast$pred)/1.96/forecast$pred)
bitmap(file='test1.png')
opar <- par(mar=c(4,4,2,2),las=1)
ylim <- c( min(x[first:nx],lb), max(x[first:nx],ub))
plot(x,ylim=ylim,type='n',xlim=c(first,lx))
usr <- par('usr')
rect(usr[1],usr[3],nx+1,usr[4],border=NA,col='lemonchiffon')
rect(nx1,usr[3],usr[2],usr[4],border=NA,col='lavender')
abline(h= (-3:3)*2 , col ='gray', lty =3)
polygon( c(nx1:lx,lx:nx1), c(lb,rev(ub)), col = 'orange', lty=2,border=NA)
lines(nx1:lx, lb , lty=2)
lines(nx1:lx, ub , lty=2)
lines(x, lwd=2)
lines(nx1:lx, forecast$pred , lwd=2 , col ='white')
box()
par(opar)
dev.off()
prob.dec <- array(NA, dim=fx)
prob.sdec <- array(NA, dim=fx)
prob.ldec <- array(NA, dim=fx)
prob.pval <- array(NA, dim=fx)
perf.pe <- array(0, dim=fx)
perf.spe <- array(0, dim=fx)
perf.scalederr <- array(0, dim=fx)
perf.mase <- array(0, dim=fx)
perf.mase1 <- array(0, dim=fx)
perf.mape <- array(0, dim=fx)
perf.smape <- array(0, dim=fx)
perf.mape1 <- array(0, dim=fx)
perf.smape1 <- array(0,dim=fx)
perf.se <- array(0, dim=fx)
perf.mse <- array(0, dim=fx)
perf.mse1 <- array(0, dim=fx)
perf.rmse <- array(0, dim=fx)
perf.scaleddenom <- 0
for (i in 2:fx) {
perf.scaleddenom = perf.scaleddenom + abs(x[nx+i] - x[nx+i-1])
}
perf.scaleddenom = perf.scaleddenom / (fx-1)
for (i in 1:fx) {
locSD <- (ub[i] - forecast$pred[i]) / 1.96
perf.scalederr[i] = (x[nx+i] - forecast$pred[i]) / perf.scaleddenom
perf.pe[i] = (x[nx+i] - forecast$pred[i]) / x[nx+i]
perf.spe[i] = 2*(x[nx+i] - forecast$pred[i]) / (x[nx+i] + forecast$pred[i])
perf.se[i] = (x[nx+i] - forecast$pred[i])^2
prob.dec[i] = pnorm((x[nx+i-1] - forecast$pred[i]) / locSD)
prob.sdec[i] = pnorm((x[nx+i-par5] - forecast$pred[i]) / locSD)
prob.ldec[i] = pnorm((x[nx] - forecast$pred[i]) / locSD)
prob.pval[i] = pnorm(abs(x[nx+i] - forecast$pred[i]) / locSD)
}
perf.mape[1] = abs(perf.pe[1])
perf.smape[1] = abs(perf.spe[1])
perf.mape1[1] = perf.mape[1]
perf.smape1[1] = perf.smape[1]
perf.mse[1] = perf.se[1]
perf.mase[1] = abs(perf.scalederr[1])
perf.mase1[1] = perf.mase[1]
for (i in 2:fx) {
perf.mape[i] = perf.mape[i-1] + abs(perf.pe[i])
perf.mape1[i] = perf.mape[i] / i
perf.smape[i] = perf.smape[i-1] + abs(perf.spe[i])
perf.smape1[i] = perf.smape[i] / i
perf.mse[i] = perf.mse[i-1] + perf.se[i]
perf.mse1[i] = perf.mse[i] / i
perf.mase[i] = perf.mase[i-1] + abs(perf.scalederr[i])
perf.mase1[i] = perf.mase[i] / i
}
perf.rmse = sqrt(perf.mse1)
bitmap(file='test2.png')
plot(forecast$pred, pch=19, type='b',main='ARIMA Extrapolation Forecast', ylab='Forecast and 95% CI', xlab='time',ylim=c(min(lb),max(ub)))
dum <- forecast$pred
dum[1:par1] <- x[(nx+1):lx]
lines(dum, lty=1)
lines(ub,lty=3)
lines(lb,lty=3)
dev.off()
load(file='createtable')
a<-table.start()
a<-table.row.start(a)
a<-table.element(a,'Univariate ARIMA Extrapolation Forecast',9,TRUE)
a<-table.row.end(a)
a<-table.row.start(a)
a<-table.element(a,'time',1,header=TRUE)
a<-table.element(a,'Y[t]',1,header=TRUE)
a<-table.element(a,'F[t]',1,header=TRUE)
a<-table.element(a,'95% LB',1,header=TRUE)
a<-table.element(a,'95% UB',1,header=TRUE)
a<-table.element(a,'p-value
(H0: Y[t] = F[t])',1,header=TRUE)
a<-table.element(a,'P(F[t]>Y[t-1])',1,header=TRUE)
a<-table.element(a,'P(F[t]>Y[t-s])',1,header=TRUE)
mylab <- paste('P(F[t]>Y[',nx,sep='')
mylab <- paste(mylab,'])',sep='')
a<-table.element(a,mylab,1,header=TRUE)
a<-table.row.end(a)
for (i in (nx-par5):nx) {
a<-table.row.start(a)
a<-table.element(a,i,header=TRUE)
a<-table.element(a,x[i])
a<-table.element(a,'-')
a<-table.row.end(a)
}
for (i in 1:fx) {
a<-table.row.start(a)
a<-table.element(a,nx+i,header=TRUE)
a<-table.element(a,round(x[nx+i],4))
a<-table.element(a,round(forecast$pred[i],4))
a<-table.element(a,round(lb[i],4))
a<-table.element(a,round(ub[i],4))
a<-table.element(a,round((1-prob.pval[i]),4))
a<-table.element(a,round((1-prob.dec[i]),4))
a<-table.element(a,round((1-prob.sdec[i]),4))
a<-table.element(a,round((1-prob.ldec[i]),4))
a<-table.row.end(a)
}
a<-table.end(a)
table.save(a,file='mytable.tab')
a<-table.start()
a<-table.row.start(a)
a<-table.element(a,'Univariate ARIMA Extrapolation Forecast Performance',10,TRUE)
a<-table.row.end(a)
a<-table.row.start(a)
a<-table.element(a,'time',1,header=TRUE)
a<-table.element(a,'% S.E.',1,header=TRUE)
a<-table.element(a,'PE',1,header=TRUE)
a<-table.element(a,'MAPE',1,header=TRUE)
a<-table.element(a,'sMAPE',1,header=TRUE)
a<-table.element(a,'Sq.E',1,header=TRUE)
a<-table.element(a,'MSE',1,header=TRUE)
a<-table.element(a,'RMSE',1,header=TRUE)
a<-table.element(a,'ScaledE',1,header=TRUE)
a<-table.element(a,'MASE',1,header=TRUE)
a<-table.row.end(a)
for (i in 1:fx) {
a<-table.row.start(a)
a<-table.element(a,nx+i,header=TRUE)
a<-table.element(a,round(perc.se[i],4))
a<-table.element(a,round(perf.pe[i],4))
a<-table.element(a,round(perf.mape1[i],4))
a<-table.element(a,round(perf.smape1[i],4))
a<-table.element(a,round(perf.se[i],4))
a<-table.element(a,round(perf.mse1[i],4))
a<-table.element(a,round(perf.rmse[i],4))
a<-table.element(a,round(perf.scalederr[i],4))
a<-table.element(a,round(perf.mase1[i],4))
a<-table.row.end(a)
}
a<-table.end(a)
table.save(a,file='mytable1.tab')