Free Statistics

of Irreproducible Research!

Author's title

Author*The author of this computation has been verified*
R Software Modulerwasp_arimabackwardselection.wasp
Title produced by softwareARIMA Backward Selection
Date of computationSat, 21 Jan 2017 18:48:27 +0100
Cite this page as followsStatistical Computations at FreeStatistics.org, Office for Research Development and Education, URL https://freestatistics.org/blog/index.php?v=date/2017/Jan/21/t1485020958nkhafqofegsod2c.htm/, Retrieved Tue, 14 May 2024 02:15:22 +0000
Statistical Computations at FreeStatistics.org, Office for Research Development and Education, URL https://freestatistics.org/blog/index.php?pk=303287, Retrieved Tue, 14 May 2024 02:15:22 +0000
QR Codes:

Original text written by user:
IsPrivate?No (this computation is public)
User-defined keywords
Estimated Impact57
Family? (F = Feedback message, R = changed R code, M = changed R Module, P = changed Parameters, D = changed Data)
-       [ARIMA Backward Selection] [] [2017-01-21 17:48:27] [673dd365cbcfe0c4e35658a2fe545652] [Current]
Feedback Forum

Post a new message
Dataseries X:
4678.2
3300.8
3823
4085.4
3742.4
4505
4259.4
4236
4529.8
4982
5151
5077.6
4944.2
4986
5949.8
4649.4
4564.4
4634
4993.6
4686.2
4511
4554.6
5447.2
5150.8
5184
4671
4640.6
4773
5019.8
5627.4
5273
5626.4
5574.4
5414.4
4517.8
5889.6
6024.4
5354.6
5883.6
5233.4
5268.2
4790.6
5607
4922.6
5610.8
5442.8
5517
5902.6
5576.8
5675
6109.6
5839.6
6175.8
5784.6
6059.6
5424.6
5184.2
5742.6
5835.8
6002.6
6490.2
6231.4
6016.6
6399.2
5666.8
6612.6
6290.4
6496.6
6271
6948.8
6216.4
8094.8
7462.2
6713.6
7390
7272.6
6258
6377.2
6981
6569
6289
6208
7210
7919.6
5471.8
6113.4
7464.2
6250.2
6601.8
6489.2
6545.6
6559.4
6385.8
7090.4
5306.6
6509
6020.2
5984.8
5505.8
5347.2
5656.2
5571.8
7332.8
6561.4
5677
6298.6
6511.4
5587.4
5867.6
5857.6
6315
6585
6151.2
6216.6
5517.2
5689


Summary of computational transaction
Raw Input view raw input (R code)
Raw Outputview raw output of R engine
Computing time5 seconds
R ServerBig Analytics Cloud Computing Center

\begin{tabular}{lllllllll}
\hline
Summary of computational transaction \tabularnewline
Raw Input view raw input (R code)  \tabularnewline
Raw Outputview raw output of R engine  \tabularnewline
Computing time5 seconds \tabularnewline
R ServerBig Analytics Cloud Computing Center \tabularnewline
\hline
\end{tabular}
%Source: https://freestatistics.org/blog/index.php?pk=303287&T=0

[TABLE]
[ROW]
Summary of computational transaction[/C][/ROW] [ROW]Raw Input[/C] view raw input (R code) [/C][/ROW] [ROW]Raw Output[/C]view raw output of R engine [/C][/ROW] [ROW]Computing time[/C]5 seconds[/C][/ROW] [ROW]R Server[/C]Big Analytics Cloud Computing Center[/C][/ROW] [/TABLE] Source: https://freestatistics.org/blog/index.php?pk=303287&T=0

Globally Unique Identifier (entire table): ba.freestatistics.org/blog/index.php?pk=303287&T=0

As an alternative you can also use a QR Code:  

The GUIDs for individual cells are displayed in the table below:

Summary of computational transaction
Raw Input view raw input (R code)
Raw Outputview raw output of R engine
Computing time5 seconds
R ServerBig Analytics Cloud Computing Center


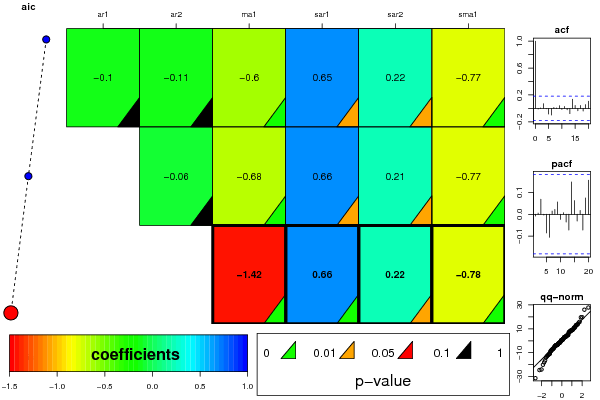
ARIMA Parameter Estimation and Backward Selection
Iterationar1ar2ma1sar1sar2sma1
Estimates ( 1 )-0.1004-0.1107-0.60420.65280.218-0.7677
(p-val)(0.6567 )(0.5007 )(0.0054 )(0.0141 )(0.0442 )(0.0072 )
Estimates ( 2 )0-0.0578-0.6830.66140.2149-0.7708
(p-val)(NA )(0.6037 )(0 )(0.0111 )(0.0478 )(0.0061 )
Estimates ( 3 )00-1.42170.66370.2217-0.7807
(p-val)(NA )(NA )(0 )(0.0096 )(0.0393 )(0.0053 )
Estimates ( 4 )NANANANANANA
(p-val)(NA )(NA )(NA )(NA )(NA )(NA )
Estimates ( 5 )NANANANANANA
(p-val)(NA )(NA )(NA )(NA )(NA )(NA )
Estimates ( 6 )NANANANANANA
(p-val)(NA )(NA )(NA )(NA )(NA )(NA )
Estimates ( 7 )NANANANANANA
(p-val)(NA )(NA )(NA )(NA )(NA )(NA )
Estimates ( 8 )NANANANANANA
(p-val)(NA )(NA )(NA )(NA )(NA )(NA )
Estimates ( 9 )NANANANANANA
(p-val)(NA )(NA )(NA )(NA )(NA )(NA )
Estimates ( 10 )NANANANANANA
(p-val)(NA )(NA )(NA )(NA )(NA )(NA )
Estimates ( 11 )NANANANANANA
(p-val)(NA )(NA )(NA )(NA )(NA )(NA )

\begin{tabular}{lllllllll}
\hline
ARIMA Parameter Estimation and Backward Selection \tabularnewline
Iteration & ar1 & ar2 & ma1 & sar1 & sar2 & sma1 \tabularnewline
Estimates ( 1 ) & -0.1004 & -0.1107 & -0.6042 & 0.6528 & 0.218 & -0.7677 \tabularnewline
(p-val) & (0.6567 ) & (0.5007 ) & (0.0054 ) & (0.0141 ) & (0.0442 ) & (0.0072 ) \tabularnewline
Estimates ( 2 ) & 0 & -0.0578 & -0.683 & 0.6614 & 0.2149 & -0.7708 \tabularnewline
(p-val) & (NA ) & (0.6037 ) & (0 ) & (0.0111 ) & (0.0478 ) & (0.0061 ) \tabularnewline
Estimates ( 3 ) & 0 & 0 & -1.4217 & 0.6637 & 0.2217 & -0.7807 \tabularnewline
(p-val) & (NA ) & (NA ) & (0 ) & (0.0096 ) & (0.0393 ) & (0.0053 ) \tabularnewline
Estimates ( 4 ) & NA & NA & NA & NA & NA & NA \tabularnewline
(p-val) & (NA ) & (NA ) & (NA ) & (NA ) & (NA ) & (NA ) \tabularnewline
Estimates ( 5 ) & NA & NA & NA & NA & NA & NA \tabularnewline
(p-val) & (NA ) & (NA ) & (NA ) & (NA ) & (NA ) & (NA ) \tabularnewline
Estimates ( 6 ) & NA & NA & NA & NA & NA & NA \tabularnewline
(p-val) & (NA ) & (NA ) & (NA ) & (NA ) & (NA ) & (NA ) \tabularnewline
Estimates ( 7 ) & NA & NA & NA & NA & NA & NA \tabularnewline
(p-val) & (NA ) & (NA ) & (NA ) & (NA ) & (NA ) & (NA ) \tabularnewline
Estimates ( 8 ) & NA & NA & NA & NA & NA & NA \tabularnewline
(p-val) & (NA ) & (NA ) & (NA ) & (NA ) & (NA ) & (NA ) \tabularnewline
Estimates ( 9 ) & NA & NA & NA & NA & NA & NA \tabularnewline
(p-val) & (NA ) & (NA ) & (NA ) & (NA ) & (NA ) & (NA ) \tabularnewline
Estimates ( 10 ) & NA & NA & NA & NA & NA & NA \tabularnewline
(p-val) & (NA ) & (NA ) & (NA ) & (NA ) & (NA ) & (NA ) \tabularnewline
Estimates ( 11 ) & NA & NA & NA & NA & NA & NA \tabularnewline
(p-val) & (NA ) & (NA ) & (NA ) & (NA ) & (NA ) & (NA ) \tabularnewline
\hline
\end{tabular}
%Source: https://freestatistics.org/blog/index.php?pk=303287&T=1

[TABLE]
[ROW][C]ARIMA Parameter Estimation and Backward Selection[/C][/ROW]
[ROW][C]Iteration[/C][C]ar1[/C][C]ar2[/C][C]ma1[/C][C]sar1[/C][C]sar2[/C][C]sma1[/C][/ROW]
[ROW][C]Estimates ( 1 )[/C][C]-0.1004[/C][C]-0.1107[/C][C]-0.6042[/C][C]0.6528[/C][C]0.218[/C][C]-0.7677[/C][/ROW]
[ROW][C](p-val)[/C][C](0.6567 )[/C][C](0.5007 )[/C][C](0.0054 )[/C][C](0.0141 )[/C][C](0.0442 )[/C][C](0.0072 )[/C][/ROW]
[ROW][C]Estimates ( 2 )[/C][C]0[/C][C]-0.0578[/C][C]-0.683[/C][C]0.6614[/C][C]0.2149[/C][C]-0.7708[/C][/ROW]
[ROW][C](p-val)[/C][C](NA )[/C][C](0.6037 )[/C][C](0 )[/C][C](0.0111 )[/C][C](0.0478 )[/C][C](0.0061 )[/C][/ROW]
[ROW][C]Estimates ( 3 )[/C][C]0[/C][C]0[/C][C]-1.4217[/C][C]0.6637[/C][C]0.2217[/C][C]-0.7807[/C][/ROW]
[ROW][C](p-val)[/C][C](NA )[/C][C](NA )[/C][C](0 )[/C][C](0.0096 )[/C][C](0.0393 )[/C][C](0.0053 )[/C][/ROW]
[ROW][C]Estimates ( 4 )[/C][C]NA[/C][C]NA[/C][C]NA[/C][C]NA[/C][C]NA[/C][C]NA[/C][/ROW]
[ROW][C](p-val)[/C][C](NA )[/C][C](NA )[/C][C](NA )[/C][C](NA )[/C][C](NA )[/C][C](NA )[/C][/ROW]
[ROW][C]Estimates ( 5 )[/C][C]NA[/C][C]NA[/C][C]NA[/C][C]NA[/C][C]NA[/C][C]NA[/C][/ROW]
[ROW][C](p-val)[/C][C](NA )[/C][C](NA )[/C][C](NA )[/C][C](NA )[/C][C](NA )[/C][C](NA )[/C][/ROW]
[ROW][C]Estimates ( 6 )[/C][C]NA[/C][C]NA[/C][C]NA[/C][C]NA[/C][C]NA[/C][C]NA[/C][/ROW]
[ROW][C](p-val)[/C][C](NA )[/C][C](NA )[/C][C](NA )[/C][C](NA )[/C][C](NA )[/C][C](NA )[/C][/ROW]
[ROW][C]Estimates ( 7 )[/C][C]NA[/C][C]NA[/C][C]NA[/C][C]NA[/C][C]NA[/C][C]NA[/C][/ROW]
[ROW][C](p-val)[/C][C](NA )[/C][C](NA )[/C][C](NA )[/C][C](NA )[/C][C](NA )[/C][C](NA )[/C][/ROW]
[ROW][C]Estimates ( 8 )[/C][C]NA[/C][C]NA[/C][C]NA[/C][C]NA[/C][C]NA[/C][C]NA[/C][/ROW]
[ROW][C](p-val)[/C][C](NA )[/C][C](NA )[/C][C](NA )[/C][C](NA )[/C][C](NA )[/C][C](NA )[/C][/ROW]
[ROW][C]Estimates ( 9 )[/C][C]NA[/C][C]NA[/C][C]NA[/C][C]NA[/C][C]NA[/C][C]NA[/C][/ROW]
[ROW][C](p-val)[/C][C](NA )[/C][C](NA )[/C][C](NA )[/C][C](NA )[/C][C](NA )[/C][C](NA )[/C][/ROW]
[ROW][C]Estimates ( 10 )[/C][C]NA[/C][C]NA[/C][C]NA[/C][C]NA[/C][C]NA[/C][C]NA[/C][/ROW]
[ROW][C](p-val)[/C][C](NA )[/C][C](NA )[/C][C](NA )[/C][C](NA )[/C][C](NA )[/C][C](NA )[/C][/ROW]
[ROW][C]Estimates ( 11 )[/C][C]NA[/C][C]NA[/C][C]NA[/C][C]NA[/C][C]NA[/C][C]NA[/C][/ROW]
[ROW][C](p-val)[/C][C](NA )[/C][C](NA )[/C][C](NA )[/C][C](NA )[/C][C](NA )[/C][C](NA )[/C][/ROW]
[/TABLE]
Source: https://freestatistics.org/blog/index.php?pk=303287&T=1

Globally Unique Identifier (entire table): ba.freestatistics.org/blog/index.php?pk=303287&T=1

As an alternative you can also use a QR Code:  

The GUIDs for individual cells are displayed in the table below:

ARIMA Parameter Estimation and Backward Selection
Iterationar1ar2ma1sar1sar2sma1
Estimates ( 1 )-0.1004-0.1107-0.60420.65280.218-0.7677
(p-val)(0.6567 )(0.5007 )(0.0054 )(0.0141 )(0.0442 )(0.0072 )
Estimates ( 2 )0-0.0578-0.6830.66140.2149-0.7708
(p-val)(NA )(0.6037 )(0 )(0.0111 )(0.0478 )(0.0061 )
Estimates ( 3 )00-1.42170.66370.2217-0.7807
(p-val)(NA )(NA )(0 )(0.0096 )(0.0393 )(0.0053 )
Estimates ( 4 )NANANANANANA
(p-val)(NA )(NA )(NA )(NA )(NA )(NA )
Estimates ( 5 )NANANANANANA
(p-val)(NA )(NA )(NA )(NA )(NA )(NA )
Estimates ( 6 )NANANANANANA
(p-val)(NA )(NA )(NA )(NA )(NA )(NA )
Estimates ( 7 )NANANANANANA
(p-val)(NA )(NA )(NA )(NA )(NA )(NA )
Estimates ( 8 )NANANANANANA
(p-val)(NA )(NA )(NA )(NA )(NA )(NA )
Estimates ( 9 )NANANANANANA
(p-val)(NA )(NA )(NA )(NA )(NA )(NA )
Estimates ( 10 )NANANANANANA
(p-val)(NA )(NA )(NA )(NA )(NA )(NA )
Estimates ( 11 )NANANANANANA
(p-val)(NA )(NA )(NA )(NA )(NA )(NA )


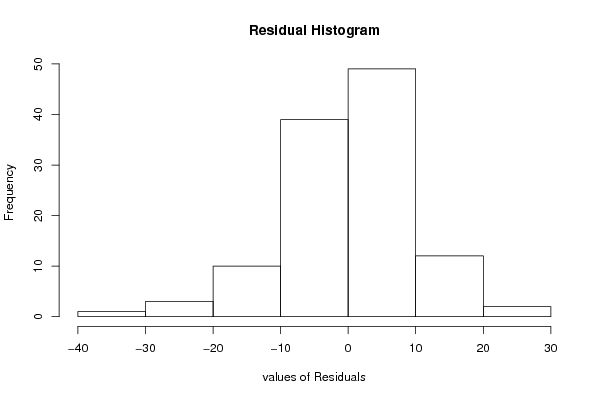
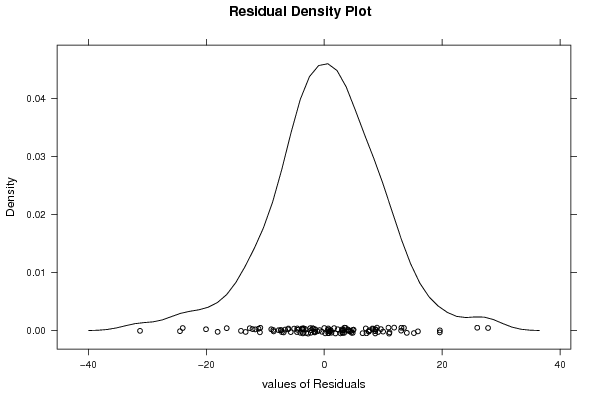
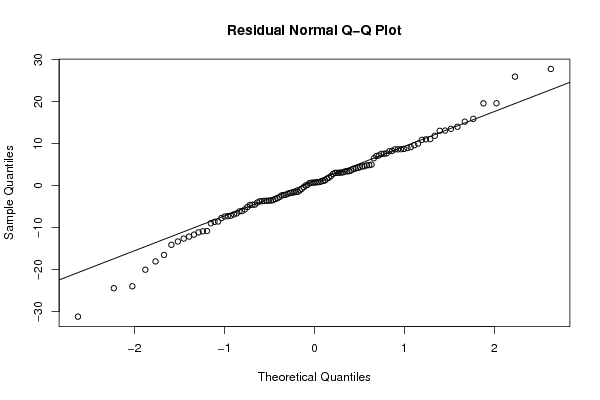
Estimated ARIMA Residuals
Value
0.159238079041958
-23.9952886346913
-1.14886928611222
3.03730093482998
-4.54458669280301
13.0423475701989
3.4263795091332
2.7650352524018
7.55809609590962
14.0022998479405
13.0901255661665
8.18250032191687
4.06113675509864
1.23330456366138
19.6018654119438
-10.8372073864454
-8.57251839491538
-4.62146908699422
3.37575723399635
-3.59550376034052
-5.1098169016225
-2.25586381123653
15.8841904331453
4.97097909447205
3.1411207020598
-3.55571163790905
-3.75908180569757
-2.7387983449338
3.98327999537922
11.8560303063493
3.01112304774995
8.94034019753047
3.62481231215254
-1.53086752636967
-18.0746161890267
13.5147917429781
9.98169526418138
-1.71375595777147
4.38609944281082
-6.14486041954323
-1.62716566182924
-12.1618780125005
6.50436526850678
-7.73482740501696
8.63396657530401
0.580269015390385
-2.19499025749442
8.65591624660251
-0.793001885985587
4.82520246309037
8.63178780143452
2.2728163473747
8.2649402405671
-6.0824181083038
3.37779556483997
-11.7018786097316
-10.9090308385315
1.67571264602045
3.03929859972271
3.11234625936261
9.60649052734833
7.04368819285847
-1.80997777286116
8.72204395068472
-7.28556857820509
10.8937621476936
-0.392284825925598
4.86167591654598
-3.48353262944624
11.0659723747182
-5.68250612051535
25.945189309305
7.55626866785607
-3.04533570347392
4.54272556740838
4.61269086886696
-16.5400515205221
-7.18287311121687
1.89460113164681
-2.35207010108058
-7.38752859244955
-6.8783452583115
11.0025739980102
19.5796808607066
-31.2335071429418
-6.63396174190628
15.2080731406654
-8.64780682180361
0.974009733352157
-4.56892250533305
-1.49583071679738
0.00515241259860271
-3.62702131828785
7.16938998538097
-24.4608364775904
0.691943032851717
-14.1185229243526
-3.73220329756531
-13.331595715154
-12.6325878514423
0.662772141776123
-3.6486011745512
27.7742018039998
7.66834626425379
-8.977345875882
4.18550777158654
1.09634806006025
-20.0492208113228
-3.19440559390633
-1.95896750304276
0.79585207868365
9.13137674913843
0.826550325155824
0.753298734093316
-11.1458244284479
-4.0540929283267

\begin{tabular}{lllllllll}
\hline
Estimated ARIMA Residuals \tabularnewline
Value \tabularnewline
0.159238079041958 \tabularnewline
-23.9952886346913 \tabularnewline
-1.14886928611222 \tabularnewline
3.03730093482998 \tabularnewline
-4.54458669280301 \tabularnewline
13.0423475701989 \tabularnewline
3.4263795091332 \tabularnewline
2.7650352524018 \tabularnewline
7.55809609590962 \tabularnewline
14.0022998479405 \tabularnewline
13.0901255661665 \tabularnewline
8.18250032191687 \tabularnewline
4.06113675509864 \tabularnewline
1.23330456366138 \tabularnewline
19.6018654119438 \tabularnewline
-10.8372073864454 \tabularnewline
-8.57251839491538 \tabularnewline
-4.62146908699422 \tabularnewline
3.37575723399635 \tabularnewline
-3.59550376034052 \tabularnewline
-5.1098169016225 \tabularnewline
-2.25586381123653 \tabularnewline
15.8841904331453 \tabularnewline
4.97097909447205 \tabularnewline
3.1411207020598 \tabularnewline
-3.55571163790905 \tabularnewline
-3.75908180569757 \tabularnewline
-2.7387983449338 \tabularnewline
3.98327999537922 \tabularnewline
11.8560303063493 \tabularnewline
3.01112304774995 \tabularnewline
8.94034019753047 \tabularnewline
3.62481231215254 \tabularnewline
-1.53086752636967 \tabularnewline
-18.0746161890267 \tabularnewline
13.5147917429781 \tabularnewline
9.98169526418138 \tabularnewline
-1.71375595777147 \tabularnewline
4.38609944281082 \tabularnewline
-6.14486041954323 \tabularnewline
-1.62716566182924 \tabularnewline
-12.1618780125005 \tabularnewline
6.50436526850678 \tabularnewline
-7.73482740501696 \tabularnewline
8.63396657530401 \tabularnewline
0.580269015390385 \tabularnewline
-2.19499025749442 \tabularnewline
8.65591624660251 \tabularnewline
-0.793001885985587 \tabularnewline
4.82520246309037 \tabularnewline
8.63178780143452 \tabularnewline
2.2728163473747 \tabularnewline
8.2649402405671 \tabularnewline
-6.0824181083038 \tabularnewline
3.37779556483997 \tabularnewline
-11.7018786097316 \tabularnewline
-10.9090308385315 \tabularnewline
1.67571264602045 \tabularnewline
3.03929859972271 \tabularnewline
3.11234625936261 \tabularnewline
9.60649052734833 \tabularnewline
7.04368819285847 \tabularnewline
-1.80997777286116 \tabularnewline
8.72204395068472 \tabularnewline
-7.28556857820509 \tabularnewline
10.8937621476936 \tabularnewline
-0.392284825925598 \tabularnewline
4.86167591654598 \tabularnewline
-3.48353262944624 \tabularnewline
11.0659723747182 \tabularnewline
-5.68250612051535 \tabularnewline
25.945189309305 \tabularnewline
7.55626866785607 \tabularnewline
-3.04533570347392 \tabularnewline
4.54272556740838 \tabularnewline
4.61269086886696 \tabularnewline
-16.5400515205221 \tabularnewline
-7.18287311121687 \tabularnewline
1.89460113164681 \tabularnewline
-2.35207010108058 \tabularnewline
-7.38752859244955 \tabularnewline
-6.8783452583115 \tabularnewline
11.0025739980102 \tabularnewline
19.5796808607066 \tabularnewline
-31.2335071429418 \tabularnewline
-6.63396174190628 \tabularnewline
15.2080731406654 \tabularnewline
-8.64780682180361 \tabularnewline
0.974009733352157 \tabularnewline
-4.56892250533305 \tabularnewline
-1.49583071679738 \tabularnewline
0.00515241259860271 \tabularnewline
-3.62702131828785 \tabularnewline
7.16938998538097 \tabularnewline
-24.4608364775904 \tabularnewline
0.691943032851717 \tabularnewline
-14.1185229243526 \tabularnewline
-3.73220329756531 \tabularnewline
-13.331595715154 \tabularnewline
-12.6325878514423 \tabularnewline
0.662772141776123 \tabularnewline
-3.6486011745512 \tabularnewline
27.7742018039998 \tabularnewline
7.66834626425379 \tabularnewline
-8.977345875882 \tabularnewline
4.18550777158654 \tabularnewline
1.09634806006025 \tabularnewline
-20.0492208113228 \tabularnewline
-3.19440559390633 \tabularnewline
-1.95896750304276 \tabularnewline
0.79585207868365 \tabularnewline
9.13137674913843 \tabularnewline
0.826550325155824 \tabularnewline
0.753298734093316 \tabularnewline
-11.1458244284479 \tabularnewline
-4.0540929283267 \tabularnewline
\hline
\end{tabular}
%Source: https://freestatistics.org/blog/index.php?pk=303287&T=2

[TABLE]
[ROW][C]Estimated ARIMA Residuals[/C][/ROW]
[ROW][C]Value[/C][/ROW]
[ROW][C]0.159238079041958[/C][/ROW]
[ROW][C]-23.9952886346913[/C][/ROW]
[ROW][C]-1.14886928611222[/C][/ROW]
[ROW][C]3.03730093482998[/C][/ROW]
[ROW][C]-4.54458669280301[/C][/ROW]
[ROW][C]13.0423475701989[/C][/ROW]
[ROW][C]3.4263795091332[/C][/ROW]
[ROW][C]2.7650352524018[/C][/ROW]
[ROW][C]7.55809609590962[/C][/ROW]
[ROW][C]14.0022998479405[/C][/ROW]
[ROW][C]13.0901255661665[/C][/ROW]
[ROW][C]8.18250032191687[/C][/ROW]
[ROW][C]4.06113675509864[/C][/ROW]
[ROW][C]1.23330456366138[/C][/ROW]
[ROW][C]19.6018654119438[/C][/ROW]
[ROW][C]-10.8372073864454[/C][/ROW]
[ROW][C]-8.57251839491538[/C][/ROW]
[ROW][C]-4.62146908699422[/C][/ROW]
[ROW][C]3.37575723399635[/C][/ROW]
[ROW][C]-3.59550376034052[/C][/ROW]
[ROW][C]-5.1098169016225[/C][/ROW]
[ROW][C]-2.25586381123653[/C][/ROW]
[ROW][C]15.8841904331453[/C][/ROW]
[ROW][C]4.97097909447205[/C][/ROW]
[ROW][C]3.1411207020598[/C][/ROW]
[ROW][C]-3.55571163790905[/C][/ROW]
[ROW][C]-3.75908180569757[/C][/ROW]
[ROW][C]-2.7387983449338[/C][/ROW]
[ROW][C]3.98327999537922[/C][/ROW]
[ROW][C]11.8560303063493[/C][/ROW]
[ROW][C]3.01112304774995[/C][/ROW]
[ROW][C]8.94034019753047[/C][/ROW]
[ROW][C]3.62481231215254[/C][/ROW]
[ROW][C]-1.53086752636967[/C][/ROW]
[ROW][C]-18.0746161890267[/C][/ROW]
[ROW][C]13.5147917429781[/C][/ROW]
[ROW][C]9.98169526418138[/C][/ROW]
[ROW][C]-1.71375595777147[/C][/ROW]
[ROW][C]4.38609944281082[/C][/ROW]
[ROW][C]-6.14486041954323[/C][/ROW]
[ROW][C]-1.62716566182924[/C][/ROW]
[ROW][C]-12.1618780125005[/C][/ROW]
[ROW][C]6.50436526850678[/C][/ROW]
[ROW][C]-7.73482740501696[/C][/ROW]
[ROW][C]8.63396657530401[/C][/ROW]
[ROW][C]0.580269015390385[/C][/ROW]
[ROW][C]-2.19499025749442[/C][/ROW]
[ROW][C]8.65591624660251[/C][/ROW]
[ROW][C]-0.793001885985587[/C][/ROW]
[ROW][C]4.82520246309037[/C][/ROW]
[ROW][C]8.63178780143452[/C][/ROW]
[ROW][C]2.2728163473747[/C][/ROW]
[ROW][C]8.2649402405671[/C][/ROW]
[ROW][C]-6.0824181083038[/C][/ROW]
[ROW][C]3.37779556483997[/C][/ROW]
[ROW][C]-11.7018786097316[/C][/ROW]
[ROW][C]-10.9090308385315[/C][/ROW]
[ROW][C]1.67571264602045[/C][/ROW]
[ROW][C]3.03929859972271[/C][/ROW]
[ROW][C]3.11234625936261[/C][/ROW]
[ROW][C]9.60649052734833[/C][/ROW]
[ROW][C]7.04368819285847[/C][/ROW]
[ROW][C]-1.80997777286116[/C][/ROW]
[ROW][C]8.72204395068472[/C][/ROW]
[ROW][C]-7.28556857820509[/C][/ROW]
[ROW][C]10.8937621476936[/C][/ROW]
[ROW][C]-0.392284825925598[/C][/ROW]
[ROW][C]4.86167591654598[/C][/ROW]
[ROW][C]-3.48353262944624[/C][/ROW]
[ROW][C]11.0659723747182[/C][/ROW]
[ROW][C]-5.68250612051535[/C][/ROW]
[ROW][C]25.945189309305[/C][/ROW]
[ROW][C]7.55626866785607[/C][/ROW]
[ROW][C]-3.04533570347392[/C][/ROW]
[ROW][C]4.54272556740838[/C][/ROW]
[ROW][C]4.61269086886696[/C][/ROW]
[ROW][C]-16.5400515205221[/C][/ROW]
[ROW][C]-7.18287311121687[/C][/ROW]
[ROW][C]1.89460113164681[/C][/ROW]
[ROW][C]-2.35207010108058[/C][/ROW]
[ROW][C]-7.38752859244955[/C][/ROW]
[ROW][C]-6.8783452583115[/C][/ROW]
[ROW][C]11.0025739980102[/C][/ROW]
[ROW][C]19.5796808607066[/C][/ROW]
[ROW][C]-31.2335071429418[/C][/ROW]
[ROW][C]-6.63396174190628[/C][/ROW]
[ROW][C]15.2080731406654[/C][/ROW]
[ROW][C]-8.64780682180361[/C][/ROW]
[ROW][C]0.974009733352157[/C][/ROW]
[ROW][C]-4.56892250533305[/C][/ROW]
[ROW][C]-1.49583071679738[/C][/ROW]
[ROW][C]0.00515241259860271[/C][/ROW]
[ROW][C]-3.62702131828785[/C][/ROW]
[ROW][C]7.16938998538097[/C][/ROW]
[ROW][C]-24.4608364775904[/C][/ROW]
[ROW][C]0.691943032851717[/C][/ROW]
[ROW][C]-14.1185229243526[/C][/ROW]
[ROW][C]-3.73220329756531[/C][/ROW]
[ROW][C]-13.331595715154[/C][/ROW]
[ROW][C]-12.6325878514423[/C][/ROW]
[ROW][C]0.662772141776123[/C][/ROW]
[ROW][C]-3.6486011745512[/C][/ROW]
[ROW][C]27.7742018039998[/C][/ROW]
[ROW][C]7.66834626425379[/C][/ROW]
[ROW][C]-8.977345875882[/C][/ROW]
[ROW][C]4.18550777158654[/C][/ROW]
[ROW][C]1.09634806006025[/C][/ROW]
[ROW][C]-20.0492208113228[/C][/ROW]
[ROW][C]-3.19440559390633[/C][/ROW]
[ROW][C]-1.95896750304276[/C][/ROW]
[ROW][C]0.79585207868365[/C][/ROW]
[ROW][C]9.13137674913843[/C][/ROW]
[ROW][C]0.826550325155824[/C][/ROW]
[ROW][C]0.753298734093316[/C][/ROW]
[ROW][C]-11.1458244284479[/C][/ROW]
[ROW][C]-4.0540929283267[/C][/ROW]
[/TABLE]
Source: https://freestatistics.org/blog/index.php?pk=303287&T=2

Globally Unique Identifier (entire table): ba.freestatistics.org/blog/index.php?pk=303287&T=2

As an alternative you can also use a QR Code:  

The GUIDs for individual cells are displayed in the table below:

Estimated ARIMA Residuals
Value
0.159238079041958
-23.9952886346913
-1.14886928611222
3.03730093482998
-4.54458669280301
13.0423475701989
3.4263795091332
2.7650352524018
7.55809609590962
14.0022998479405
13.0901255661665
8.18250032191687
4.06113675509864
1.23330456366138
19.6018654119438
-10.8372073864454
-8.57251839491538
-4.62146908699422
3.37575723399635
-3.59550376034052
-5.1098169016225
-2.25586381123653
15.8841904331453
4.97097909447205
3.1411207020598
-3.55571163790905
-3.75908180569757
-2.7387983449338
3.98327999537922
11.8560303063493
3.01112304774995
8.94034019753047
3.62481231215254
-1.53086752636967
-18.0746161890267
13.5147917429781
9.98169526418138
-1.71375595777147
4.38609944281082
-6.14486041954323
-1.62716566182924
-12.1618780125005
6.50436526850678
-7.73482740501696
8.63396657530401
0.580269015390385
-2.19499025749442
8.65591624660251
-0.793001885985587
4.82520246309037
8.63178780143452
2.2728163473747
8.2649402405671
-6.0824181083038
3.37779556483997
-11.7018786097316
-10.9090308385315
1.67571264602045
3.03929859972271
3.11234625936261
9.60649052734833
7.04368819285847
-1.80997777286116
8.72204395068472
-7.28556857820509
10.8937621476936
-0.392284825925598
4.86167591654598
-3.48353262944624
11.0659723747182
-5.68250612051535
25.945189309305
7.55626866785607
-3.04533570347392
4.54272556740838
4.61269086886696
-16.5400515205221
-7.18287311121687
1.89460113164681
-2.35207010108058
-7.38752859244955
-6.8783452583115
11.0025739980102
19.5796808607066
-31.2335071429418
-6.63396174190628
15.2080731406654
-8.64780682180361
0.974009733352157
-4.56892250533305
-1.49583071679738
0.00515241259860271
-3.62702131828785
7.16938998538097
-24.4608364775904
0.691943032851717
-14.1185229243526
-3.73220329756531
-13.331595715154
-12.6325878514423
0.662772141776123
-3.6486011745512
27.7742018039998
7.66834626425379
-8.977345875882
4.18550777158654
1.09634806006025
-20.0492208113228
-3.19440559390633
-1.95896750304276
0.79585207868365
9.13137674913843
0.826550325155824
0.753298734093316
-11.1458244284479
-4.0540929283267


Parameters (Session):
Parameters (R input):
par1 = FALSE ; par2 = 0.6 ; par3 = 1 ; par4 = 0 ; par5 = 12 ; par6 = 2 ; par7 = 1 ; par8 = 2 ; par9 = 1 ;
R code (references can be found in the software module):
par9 <- '1'
par8 <- '2'
par7 <- '1'
par6 <- '1'
par5 <- '12'
par4 <- '0'
par3 <- '1'
par2 <- '0.6'
par1 <- 'FALSE'
library(lattice)
if (par1 == 'TRUE') par1 <- TRUE
if (par1 == 'FALSE') par1 <- FALSE
par2 <- as.numeric(par2) #Box-Cox lambda transformation parameter
par3 <- as.numeric(par3) #degree of non-seasonal differencing
par4 <- as.numeric(par4) #degree of seasonal differencing
par5 <- as.numeric(par5) #seasonal period
par6 <- as.numeric(par6) #degree (p) of the non-seasonal AR(p) polynomial
par7 <- as.numeric(par7) #degree (q) of the non-seasonal MA(q) polynomial
par8 <- as.numeric(par8) #degree (P) of the seasonal AR(P) polynomial
par9 <- as.numeric(par9) #degree (Q) of the seasonal MA(Q) polynomial
armaGR <- function(arima.out, names, n){
try1 <- arima.out$coef
try2 <- sqrt(diag(arima.out$var.coef))
try.data.frame <- data.frame(matrix(NA,ncol=4,nrow=length(names)))
dimnames(try.data.frame) <- list(names,c('coef','std','tstat','pv'))
try.data.frame[,1] <- try1
for(i in 1:length(try2)) try.data.frame[which(rownames(try.data.frame)==names(try2)[i]),2] <- try2[i]
try.data.frame[,3] <- try.data.frame[,1] / try.data.frame[,2]
try.data.frame[,4] <- round((1-pt(abs(try.data.frame[,3]),df=n-(length(try2)+1)))*2,5)
vector <- rep(NA,length(names))
vector[is.na(try.data.frame[,4])] <- 0
maxi <- which.max(try.data.frame[,4])
continue <- max(try.data.frame[,4],na.rm=TRUE) > .05
vector[maxi] <- 0
list(summary=try.data.frame,next.vector=vector,continue=continue)
}
arimaSelect <- function(series, order=c(13,0,0), seasonal=list(order=c(2,0,0),period=12), include.mean=F){
nrc <- order[1]+order[3]+seasonal$order[1]+seasonal$order[3]
coeff <- matrix(NA, nrow=nrc*2, ncol=nrc)
pval <- matrix(NA, nrow=nrc*2, ncol=nrc)
mylist <- rep(list(NULL), nrc)
names <- NULL
if(order[1] > 0) names <- paste('ar',1:order[1],sep='')
if(order[3] > 0) names <- c( names , paste('ma',1:order[3],sep='') )
if(seasonal$order[1] > 0) names <- c(names, paste('sar',1:seasonal$order[1],sep=''))
if(seasonal$order[3] > 0) names <- c(names, paste('sma',1:seasonal$order[3],sep=''))
arima.out <- arima(series, order=order, seasonal=seasonal, include.mean=include.mean, method='ML')
mylist[[1]] <- arima.out
last.arma <- armaGR(arima.out, names, length(series))
mystop <- FALSE
i <- 1
coeff[i,] <- last.arma[[1]][,1]
pval [i,] <- last.arma[[1]][,4]
i <- 2
aic <- arima.out$aic
while(!mystop){
mylist[[i]] <- arima.out
arima.out <- arima(series, order=order, seasonal=seasonal, include.mean=include.mean, method='ML', fixed=last.arma$next.vector)
aic <- c(aic, arima.out$aic)
last.arma <- armaGR(arima.out, names, length(series))
mystop <- !last.arma$continue
coeff[i,] <- last.arma[[1]][,1]
pval [i,] <- last.arma[[1]][,4]
i <- i+1
}
list(coeff, pval, mylist, aic=aic)
}
arimaSelectplot <- function(arimaSelect.out,noms,choix){
noms <- names(arimaSelect.out[[3]][[1]]$coef)
coeff <- arimaSelect.out[[1]]
k <- min(which(is.na(coeff[,1])))-1
coeff <- coeff[1:k,]
pval <- arimaSelect.out[[2]][1:k,]
aic <- arimaSelect.out$aic[1:k]
coeff[coeff==0] <- NA
n <- ncol(coeff)
if(missing(choix)) choix <- k
layout(matrix(c(1,1,1,2,
3,3,3,2,
3,3,3,4,
5,6,7,7),nr=4),
widths=c(10,35,45,15),
heights=c(30,30,15,15))
couleurs <- rainbow(75)[1:50]#(50)
ticks <- pretty(coeff)
par(mar=c(1,1,3,1))
plot(aic,k:1-.5,type='o',pch=21,bg='blue',cex=2,axes=F,lty=2,xpd=NA)
points(aic[choix],k-choix+.5,pch=21,cex=4,bg=2,xpd=NA)
title('aic',line=2)
par(mar=c(3,0,0,0))
plot(0,axes=F,xlab='',ylab='',xlim=range(ticks),ylim=c(.1,1))
rect(xleft = min(ticks) + (0:49)/50*(max(ticks)-min(ticks)),
xright = min(ticks) + (1:50)/50*(max(ticks)-min(ticks)),
ytop = rep(1,50),
ybottom= rep(0,50),col=couleurs,border=NA)
axis(1,ticks)
rect(xleft=min(ticks),xright=max(ticks),ytop=1,ybottom=0)
text(mean(coeff,na.rm=T),.5,'coefficients',cex=2,font=2)
par(mar=c(1,1,3,1))
image(1:n,1:k,t(coeff[k:1,]),axes=F,col=couleurs,zlim=range(ticks))
for(i in 1:n) for(j in 1:k) if(!is.na(coeff[j,i])) {
if(pval[j,i]<.01) symb = 'green'
else if( (pval[j,i]<.05) & (pval[j,i]>=.01)) symb = 'orange'
else if( (pval[j,i]<.1) & (pval[j,i]>=.05)) symb = 'red'
else symb = 'black'
polygon(c(i+.5 ,i+.2 ,i+.5 ,i+.5),
c(k-j+0.5,k-j+0.5,k-j+0.8,k-j+0.5),
col=symb)
if(j==choix) {
rect(xleft=i-.5,
xright=i+.5,
ybottom=k-j+1.5,
ytop=k-j+.5,
lwd=4)
text(i,
k-j+1,
round(coeff[j,i],2),
cex=1.2,
font=2)
}
else{
rect(xleft=i-.5,xright=i+.5,ybottom=k-j+1.5,ytop=k-j+.5)
text(i,k-j+1,round(coeff[j,i],2),cex=1.2,font=1)
}
}
axis(3,1:n,noms)
par(mar=c(0.5,0,0,0.5))
plot(0,axes=F,xlab='',ylab='',type='n',xlim=c(0,8),ylim=c(-.2,.8))
cols <- c('green','orange','red','black')
niv <- c('0','0.01','0.05','0.1')
for(i in 0:3){
polygon(c(1+2*i ,1+2*i ,1+2*i-.5 ,1+2*i),
c(.4 ,.7 , .4 , .4),
col=cols[i+1])
text(2*i,0.5,niv[i+1],cex=1.5)
}
text(8,.5,1,cex=1.5)
text(4,0,'p-value',cex=2)
box()
residus <- arimaSelect.out[[3]][[choix]]$res
par(mar=c(1,2,4,1))
acf(residus,main='')
title('acf',line=.5)
par(mar=c(1,2,4,1))
pacf(residus,main='')
title('pacf',line=.5)
par(mar=c(2,2,4,1))
qqnorm(residus,main='')
title('qq-norm',line=.5)
qqline(residus)
residus
}
if (par2 == 0) x <- log(x)
if (par2 != 0) x <- x^par2
(selection <- arimaSelect(x, order=c(par6,par3,par7), seasonal=list(order=c(par8,par4,par9), period=par5)))
bitmap(file='test1.png')
resid <- arimaSelectplot(selection)
dev.off()
resid
bitmap(file='test2.png')
acf(resid,length(resid)/2, main='Residual Autocorrelation Function')
dev.off()
bitmap(file='test3.png')
pacf(resid,length(resid)/2, main='Residual Partial Autocorrelation Function')
dev.off()
bitmap(file='test4.png')
cpgram(resid, main='Residual Cumulative Periodogram')
dev.off()
bitmap(file='test5.png')
hist(resid, main='Residual Histogram', xlab='values of Residuals')
dev.off()
bitmap(file='test6.png')
densityplot(~resid,col='black',main='Residual Density Plot', xlab='values of Residuals')
dev.off()
bitmap(file='test7.png')
qqnorm(resid, main='Residual Normal Q-Q Plot')
qqline(resid)
dev.off()
ncols <- length(selection[[1]][1,])
nrows <- length(selection[[2]][,1])-1
load(file='createtable')
a<-table.start()
a<-table.row.start(a)
a<-table.element(a,'ARIMA Parameter Estimation and Backward Selection', ncols+1,TRUE)
a<-table.row.end(a)
a<-table.row.start(a)
a<-table.element(a,'Iteration', header=TRUE)
for (i in 1:ncols) {
a<-table.element(a,names(selection[[3]][[1]]$coef)[i],header=TRUE)
}
a<-table.row.end(a)
for (j in 1:nrows) {
a<-table.row.start(a)
mydum <- 'Estimates ('
mydum <- paste(mydum,j)
mydum <- paste(mydum,')')
a<-table.element(a,mydum, header=TRUE)
for (i in 1:ncols) {
a<-table.element(a,round(selection[[1]][j,i],4))
}
a<-table.row.end(a)
a<-table.row.start(a)
a<-table.element(a,'(p-val)', header=TRUE)
for (i in 1:ncols) {
mydum <- '('
mydum <- paste(mydum,round(selection[[2]][j,i],4),sep='')
mydum <- paste(mydum,')')
a<-table.element(a,mydum)
}
a<-table.row.end(a)
}
a<-table.end(a)
table.save(a,file='mytable.tab')
a<-table.start()
a<-table.row.start(a)
a<-table.element(a,'Estimated ARIMA Residuals', 1,TRUE)
a<-table.row.end(a)
a<-table.row.start(a)
a<-table.element(a,'Value', 1,TRUE)
a<-table.row.end(a)
for (i in (par4*par5+par3):length(resid)) {
a<-table.row.start(a)
a<-table.element(a,resid[i])
a<-table.row.end(a)
}
a<-table.end(a)
table.save(a,file='mytable1.tab')