Free Statistics

of Irreproducible Research!

Author's title

Author*Unverified author*
R Software Modulerwasp_exponentialsmoothing.wasp
Title produced by softwareExponential Smoothing
Date of computationSun, 08 Jan 2017 21:34:18 +0000
Cite this page as followsStatistical Computations at FreeStatistics.org, Office for Research Development and Education, URL https://freestatistics.org/blog/index.php?v=date/2017/Jan/08/t1483911353fhi27pyr9chk3zx.htm/, Retrieved Tue, 14 May 2024 01:40:53 +0200
Statistical Computations at FreeStatistics.org, Office for Research Development and Education, URL https://freestatistics.org/blog/index.php?pk=, Retrieved Tue, 14 May 2024 01:40:53 +0200
QR Codes:

Original text written by user:
IsPrivate?No (this computation is public)
User-defined keywords
Estimated Impact0
Dataseries X:
1,336
1,3649
1,3999
1,4442
1,4349
1,4388
1,4264
1,4343
1,377
1,3706
1,3556
1,3179
1,2905
1,3224
1,3201
1,3162
1,2789
1,2526
1,2288
1,24
1,2856
1,2974
1,2828
1,3119
1,3288
1,3359
1,2964
1,3026
1,2982
1,3189
1,308
1,331
1,3348
1,3635
1,3493
1,3704
1,361
1,3658
1,3823
1,3812
1,3732
1,3592
1,3539
1,3316
1,2901
1,2673
1,2472
1,2331
1,1621
1,135
1,0838
1,0779
1,115
1,1213
1,0996
1,1139
1,1221
1,1235
1,0736
1,0877


Summary of computational transaction
Raw Inputview raw input (R code)
Raw Outputview raw output of R engine
Computing time1 seconds
R Server'Gertrude Mary Cox' @ cox.wessa.net

\begin{tabular}{lllllllll}
\hline
Summary of computational transaction \tabularnewline
Raw Input & view raw input (R code)  \tabularnewline
Raw Output & view raw output of R engine  \tabularnewline
Computing time & 1 seconds \tabularnewline
R Server & 'Gertrude Mary Cox' @ cox.wessa.net \tabularnewline
\hline
\end{tabular}
%Source: https://freestatistics.org/blog/index.php?pk=&T=0

[TABLE]
[ROW][C]Summary of computational transaction[/C][/ROW]
[ROW][C]Raw Input[/C][C]view raw input (R code) [/C][/ROW]
[ROW][C]Raw Output[/C][C]view raw output of R engine [/C][/ROW]
[ROW][C]Computing time[/C][C]1 seconds[/C][/ROW]
[ROW][C]R Server[/C][C]'Gertrude Mary Cox' @ cox.wessa.net[/C][/ROW]
[/TABLE]
Source: https://freestatistics.org/blog/index.php?pk=&T=0

Globally Unique Identifier (entire table): ba.freestatistics.org/blog/index.php?pk=&T=0

As an alternative you can also use a QR Code:  

The GUIDs for individual cells are displayed in the table below:

Summary of computational transaction
Raw Inputview raw input (R code)
Raw Outputview raw output of R engine
Computing time1 seconds
R Server'Gertrude Mary Cox' @ cox.wessa.net


Estimated Parameters of Exponential Smoothing
ParameterValue
alpha1
beta0.283915505806246
gammaFALSE

\begin{tabular}{lllllllll}
\hline
Estimated Parameters of Exponential Smoothing \tabularnewline
Parameter & Value \tabularnewline
alpha & 1 \tabularnewline
beta & 0.283915505806246 \tabularnewline
gamma & FALSE \tabularnewline
\hline
\end{tabular}
%Source: https://freestatistics.org/blog/index.php?pk=&T=1

[TABLE]
[ROW][C]Estimated Parameters of Exponential Smoothing[/C][/ROW]
[ROW][C]Parameter[/C][C]Value[/C][/ROW]
[ROW][C]alpha[/C][C]1[/C][/ROW]
[ROW][C]beta[/C][C]0.283915505806246[/C][/ROW]
[ROW][C]gamma[/C][C]FALSE[/C][/ROW]
[/TABLE]
Source: https://freestatistics.org/blog/index.php?pk=&T=1

Globally Unique Identifier (entire table): ba.freestatistics.org/blog/index.php?pk=&T=1

As an alternative you can also use a QR Code:  

The GUIDs for individual cells are displayed in the table below:

Estimated Parameters of Exponential Smoothing
ParameterValue
alpha1
beta0.283915505806246
gammaFALSE


Interpolation Forecasts of Exponential Smoothing
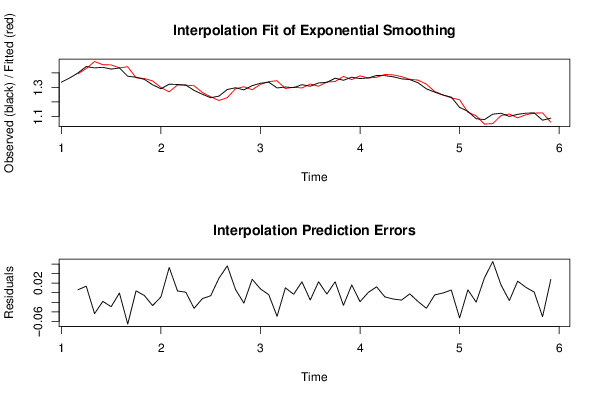
tObservedFittedResiduals
31.39991.39380.00609999999999999
41.44421.430531884585420.0136681154145819
51.43491.47871247448677-0.0438124744867672
61.43881.45697343363223-0.0181734336322334
71.42641.4557137140303-0.0293137140303019
81.43431.43499109608433-0.000691096084328935
91.3771.44269488318999-0.0656948831899857
101.37061.366743087200220.00385691279978118
111.35561.36143812454862-0.00583812454861943
121.31791.34478059046444-0.026880590464438
131.29051.29944877402636-0.00894877402635674
141.32241.269508078322320.0528919216776822
151.32011.31642491501850.00367508498149882
161.31621.31516832862990.00103167137009552
171.27891.31156123612877-0.032661236128771
181.25261.26498820475301-0.0123882047530137
191.22881.23517100133453-0.00637100133453061
201.241.209562175268140.0304378247318551
211.28561.229403945672530.0561960543274687
221.29741.290958876861230.00644112313876999
231.28281.30458761159513-0.0217876115951343
241.31191.283801770828790.0280982291712084
251.32881.32087929377620.00792070622380492
261.33591.34002810509007-0.00412810509006922
271.29641.3459560720454-0.0495560720454011
281.30261.292386334784860.0102136652151399
291.29821.30148615271055-0.0032861527105521
301.31891.296153163001580.0227468369984207
311.3081.32331134273348-0.0153113427334779
321.3311.308064215116730.0229357848832701
331.33481.33757604008293-0.00277604008292665
341.36351.340587879258640.0229121207413558
351.34931.37579298560802-0.02649298560802
361.37041.35407121619880.0163287838011987
371.3611.37980721111092-0.0188072111109197
381.36581.365067552255560.000732447744441922
391.38231.37007550552740.0122244944726024
401.38121.39004622905881-0.00884622905881249
411.37321.3864346474611-0.0132346474611018
421.35921.37467712583302-0.0154771258330157
431.35391.35628292982371-0.00238292982370791
441.33161.35030637909751-0.0187063790975095
451.29011.32269534801424-0.0325953480142365
461.26731.27194102329584-0.00464102329584382
471.24721.24782336481935-0.000623364819345884
481.23311.227546381881360.00555361811864064
491.16211.21502314017857-0.0529231401785681
501.1351.128997440065910.00600255993408516
511.08381.10360165990573-0.0198016599057329
521.07791.046779661617790.0311203383822063
531.1151.049715208230440.0652847917695607
541.12131.105350572907150.0159494270928504
551.09961.11617886256754-0.016578862567536
561.11391.089771866415980.0241281335840182
571.12211.110922217666650.0111777823333512
581.12351.122295763391610.00120423660838531
591.07361.12403766483739-0.0504376648373945
601.08771.05981762971340.0278823702866

\begin{tabular}{lllllllll}
\hline
Interpolation Forecasts of Exponential Smoothing \tabularnewline
t & Observed & Fitted & Residuals \tabularnewline
3 & 1.3999 & 1.3938 & 0.00609999999999999 \tabularnewline
4 & 1.4442 & 1.43053188458542 & 0.0136681154145819 \tabularnewline
5 & 1.4349 & 1.47871247448677 & -0.0438124744867672 \tabularnewline
6 & 1.4388 & 1.45697343363223 & -0.0181734336322334 \tabularnewline
7 & 1.4264 & 1.4557137140303 & -0.0293137140303019 \tabularnewline
8 & 1.4343 & 1.43499109608433 & -0.000691096084328935 \tabularnewline
9 & 1.377 & 1.44269488318999 & -0.0656948831899857 \tabularnewline
10 & 1.3706 & 1.36674308720022 & 0.00385691279978118 \tabularnewline
11 & 1.3556 & 1.36143812454862 & -0.00583812454861943 \tabularnewline
12 & 1.3179 & 1.34478059046444 & -0.026880590464438 \tabularnewline
13 & 1.2905 & 1.29944877402636 & -0.00894877402635674 \tabularnewline
14 & 1.3224 & 1.26950807832232 & 0.0528919216776822 \tabularnewline
15 & 1.3201 & 1.3164249150185 & 0.00367508498149882 \tabularnewline
16 & 1.3162 & 1.3151683286299 & 0.00103167137009552 \tabularnewline
17 & 1.2789 & 1.31156123612877 & -0.032661236128771 \tabularnewline
18 & 1.2526 & 1.26498820475301 & -0.0123882047530137 \tabularnewline
19 & 1.2288 & 1.23517100133453 & -0.00637100133453061 \tabularnewline
20 & 1.24 & 1.20956217526814 & 0.0304378247318551 \tabularnewline
21 & 1.2856 & 1.22940394567253 & 0.0561960543274687 \tabularnewline
22 & 1.2974 & 1.29095887686123 & 0.00644112313876999 \tabularnewline
23 & 1.2828 & 1.30458761159513 & -0.0217876115951343 \tabularnewline
24 & 1.3119 & 1.28380177082879 & 0.0280982291712084 \tabularnewline
25 & 1.3288 & 1.3208792937762 & 0.00792070622380492 \tabularnewline
26 & 1.3359 & 1.34002810509007 & -0.00412810509006922 \tabularnewline
27 & 1.2964 & 1.3459560720454 & -0.0495560720454011 \tabularnewline
28 & 1.3026 & 1.29238633478486 & 0.0102136652151399 \tabularnewline
29 & 1.2982 & 1.30148615271055 & -0.0032861527105521 \tabularnewline
30 & 1.3189 & 1.29615316300158 & 0.0227468369984207 \tabularnewline
31 & 1.308 & 1.32331134273348 & -0.0153113427334779 \tabularnewline
32 & 1.331 & 1.30806421511673 & 0.0229357848832701 \tabularnewline
33 & 1.3348 & 1.33757604008293 & -0.00277604008292665 \tabularnewline
34 & 1.3635 & 1.34058787925864 & 0.0229121207413558 \tabularnewline
35 & 1.3493 & 1.37579298560802 & -0.02649298560802 \tabularnewline
36 & 1.3704 & 1.3540712161988 & 0.0163287838011987 \tabularnewline
37 & 1.361 & 1.37980721111092 & -0.0188072111109197 \tabularnewline
38 & 1.3658 & 1.36506755225556 & 0.000732447744441922 \tabularnewline
39 & 1.3823 & 1.3700755055274 & 0.0122244944726024 \tabularnewline
40 & 1.3812 & 1.39004622905881 & -0.00884622905881249 \tabularnewline
41 & 1.3732 & 1.3864346474611 & -0.0132346474611018 \tabularnewline
42 & 1.3592 & 1.37467712583302 & -0.0154771258330157 \tabularnewline
43 & 1.3539 & 1.35628292982371 & -0.00238292982370791 \tabularnewline
44 & 1.3316 & 1.35030637909751 & -0.0187063790975095 \tabularnewline
45 & 1.2901 & 1.32269534801424 & -0.0325953480142365 \tabularnewline
46 & 1.2673 & 1.27194102329584 & -0.00464102329584382 \tabularnewline
47 & 1.2472 & 1.24782336481935 & -0.000623364819345884 \tabularnewline
48 & 1.2331 & 1.22754638188136 & 0.00555361811864064 \tabularnewline
49 & 1.1621 & 1.21502314017857 & -0.0529231401785681 \tabularnewline
50 & 1.135 & 1.12899744006591 & 0.00600255993408516 \tabularnewline
51 & 1.0838 & 1.10360165990573 & -0.0198016599057329 \tabularnewline
52 & 1.0779 & 1.04677966161779 & 0.0311203383822063 \tabularnewline
53 & 1.115 & 1.04971520823044 & 0.0652847917695607 \tabularnewline
54 & 1.1213 & 1.10535057290715 & 0.0159494270928504 \tabularnewline
55 & 1.0996 & 1.11617886256754 & -0.016578862567536 \tabularnewline
56 & 1.1139 & 1.08977186641598 & 0.0241281335840182 \tabularnewline
57 & 1.1221 & 1.11092221766665 & 0.0111777823333512 \tabularnewline
58 & 1.1235 & 1.12229576339161 & 0.00120423660838531 \tabularnewline
59 & 1.0736 & 1.12403766483739 & -0.0504376648373945 \tabularnewline
60 & 1.0877 & 1.0598176297134 & 0.0278823702866 \tabularnewline
\hline
\end{tabular}
%Source: https://freestatistics.org/blog/index.php?pk=&T=2

[TABLE]
[ROW][C]Interpolation Forecasts of Exponential Smoothing[/C][/ROW]
[ROW][C]t[/C][C]Observed[/C][C]Fitted[/C][C]Residuals[/C][/ROW]
[ROW][C]3[/C][C]1.3999[/C][C]1.3938[/C][C]0.00609999999999999[/C][/ROW]
[ROW][C]4[/C][C]1.4442[/C][C]1.43053188458542[/C][C]0.0136681154145819[/C][/ROW]
[ROW][C]5[/C][C]1.4349[/C][C]1.47871247448677[/C][C]-0.0438124744867672[/C][/ROW]
[ROW][C]6[/C][C]1.4388[/C][C]1.45697343363223[/C][C]-0.0181734336322334[/C][/ROW]
[ROW][C]7[/C][C]1.4264[/C][C]1.4557137140303[/C][C]-0.0293137140303019[/C][/ROW]
[ROW][C]8[/C][C]1.4343[/C][C]1.43499109608433[/C][C]-0.000691096084328935[/C][/ROW]
[ROW][C]9[/C][C]1.377[/C][C]1.44269488318999[/C][C]-0.0656948831899857[/C][/ROW]
[ROW][C]10[/C][C]1.3706[/C][C]1.36674308720022[/C][C]0.00385691279978118[/C][/ROW]
[ROW][C]11[/C][C]1.3556[/C][C]1.36143812454862[/C][C]-0.00583812454861943[/C][/ROW]
[ROW][C]12[/C][C]1.3179[/C][C]1.34478059046444[/C][C]-0.026880590464438[/C][/ROW]
[ROW][C]13[/C][C]1.2905[/C][C]1.29944877402636[/C][C]-0.00894877402635674[/C][/ROW]
[ROW][C]14[/C][C]1.3224[/C][C]1.26950807832232[/C][C]0.0528919216776822[/C][/ROW]
[ROW][C]15[/C][C]1.3201[/C][C]1.3164249150185[/C][C]0.00367508498149882[/C][/ROW]
[ROW][C]16[/C][C]1.3162[/C][C]1.3151683286299[/C][C]0.00103167137009552[/C][/ROW]
[ROW][C]17[/C][C]1.2789[/C][C]1.31156123612877[/C][C]-0.032661236128771[/C][/ROW]
[ROW][C]18[/C][C]1.2526[/C][C]1.26498820475301[/C][C]-0.0123882047530137[/C][/ROW]
[ROW][C]19[/C][C]1.2288[/C][C]1.23517100133453[/C][C]-0.00637100133453061[/C][/ROW]
[ROW][C]20[/C][C]1.24[/C][C]1.20956217526814[/C][C]0.0304378247318551[/C][/ROW]
[ROW][C]21[/C][C]1.2856[/C][C]1.22940394567253[/C][C]0.0561960543274687[/C][/ROW]
[ROW][C]22[/C][C]1.2974[/C][C]1.29095887686123[/C][C]0.00644112313876999[/C][/ROW]
[ROW][C]23[/C][C]1.2828[/C][C]1.30458761159513[/C][C]-0.0217876115951343[/C][/ROW]
[ROW][C]24[/C][C]1.3119[/C][C]1.28380177082879[/C][C]0.0280982291712084[/C][/ROW]
[ROW][C]25[/C][C]1.3288[/C][C]1.3208792937762[/C][C]0.00792070622380492[/C][/ROW]
[ROW][C]26[/C][C]1.3359[/C][C]1.34002810509007[/C][C]-0.00412810509006922[/C][/ROW]
[ROW][C]27[/C][C]1.2964[/C][C]1.3459560720454[/C][C]-0.0495560720454011[/C][/ROW]
[ROW][C]28[/C][C]1.3026[/C][C]1.29238633478486[/C][C]0.0102136652151399[/C][/ROW]
[ROW][C]29[/C][C]1.2982[/C][C]1.30148615271055[/C][C]-0.0032861527105521[/C][/ROW]
[ROW][C]30[/C][C]1.3189[/C][C]1.29615316300158[/C][C]0.0227468369984207[/C][/ROW]
[ROW][C]31[/C][C]1.308[/C][C]1.32331134273348[/C][C]-0.0153113427334779[/C][/ROW]
[ROW][C]32[/C][C]1.331[/C][C]1.30806421511673[/C][C]0.0229357848832701[/C][/ROW]
[ROW][C]33[/C][C]1.3348[/C][C]1.33757604008293[/C][C]-0.00277604008292665[/C][/ROW]
[ROW][C]34[/C][C]1.3635[/C][C]1.34058787925864[/C][C]0.0229121207413558[/C][/ROW]
[ROW][C]35[/C][C]1.3493[/C][C]1.37579298560802[/C][C]-0.02649298560802[/C][/ROW]
[ROW][C]36[/C][C]1.3704[/C][C]1.3540712161988[/C][C]0.0163287838011987[/C][/ROW]
[ROW][C]37[/C][C]1.361[/C][C]1.37980721111092[/C][C]-0.0188072111109197[/C][/ROW]
[ROW][C]38[/C][C]1.3658[/C][C]1.36506755225556[/C][C]0.000732447744441922[/C][/ROW]
[ROW][C]39[/C][C]1.3823[/C][C]1.3700755055274[/C][C]0.0122244944726024[/C][/ROW]
[ROW][C]40[/C][C]1.3812[/C][C]1.39004622905881[/C][C]-0.00884622905881249[/C][/ROW]
[ROW][C]41[/C][C]1.3732[/C][C]1.3864346474611[/C][C]-0.0132346474611018[/C][/ROW]
[ROW][C]42[/C][C]1.3592[/C][C]1.37467712583302[/C][C]-0.0154771258330157[/C][/ROW]
[ROW][C]43[/C][C]1.3539[/C][C]1.35628292982371[/C][C]-0.00238292982370791[/C][/ROW]
[ROW][C]44[/C][C]1.3316[/C][C]1.35030637909751[/C][C]-0.0187063790975095[/C][/ROW]
[ROW][C]45[/C][C]1.2901[/C][C]1.32269534801424[/C][C]-0.0325953480142365[/C][/ROW]
[ROW][C]46[/C][C]1.2673[/C][C]1.27194102329584[/C][C]-0.00464102329584382[/C][/ROW]
[ROW][C]47[/C][C]1.2472[/C][C]1.24782336481935[/C][C]-0.000623364819345884[/C][/ROW]
[ROW][C]48[/C][C]1.2331[/C][C]1.22754638188136[/C][C]0.00555361811864064[/C][/ROW]
[ROW][C]49[/C][C]1.1621[/C][C]1.21502314017857[/C][C]-0.0529231401785681[/C][/ROW]
[ROW][C]50[/C][C]1.135[/C][C]1.12899744006591[/C][C]0.00600255993408516[/C][/ROW]
[ROW][C]51[/C][C]1.0838[/C][C]1.10360165990573[/C][C]-0.0198016599057329[/C][/ROW]
[ROW][C]52[/C][C]1.0779[/C][C]1.04677966161779[/C][C]0.0311203383822063[/C][/ROW]
[ROW][C]53[/C][C]1.115[/C][C]1.04971520823044[/C][C]0.0652847917695607[/C][/ROW]
[ROW][C]54[/C][C]1.1213[/C][C]1.10535057290715[/C][C]0.0159494270928504[/C][/ROW]
[ROW][C]55[/C][C]1.0996[/C][C]1.11617886256754[/C][C]-0.016578862567536[/C][/ROW]
[ROW][C]56[/C][C]1.1139[/C][C]1.08977186641598[/C][C]0.0241281335840182[/C][/ROW]
[ROW][C]57[/C][C]1.1221[/C][C]1.11092221766665[/C][C]0.0111777823333512[/C][/ROW]
[ROW][C]58[/C][C]1.1235[/C][C]1.12229576339161[/C][C]0.00120423660838531[/C][/ROW]
[ROW][C]59[/C][C]1.0736[/C][C]1.12403766483739[/C][C]-0.0504376648373945[/C][/ROW]
[ROW][C]60[/C][C]1.0877[/C][C]1.0598176297134[/C][C]0.0278823702866[/C][/ROW]
[/TABLE]
Source: https://freestatistics.org/blog/index.php?pk=&T=2

Globally Unique Identifier (entire table): ba.freestatistics.org/blog/index.php?pk=&T=2

As an alternative you can also use a QR Code:  

The GUIDs for individual cells are displayed in the table below:

Interpolation Forecasts of Exponential Smoothing
tObservedFittedResiduals
31.39991.39380.00609999999999999
41.44421.430531884585420.0136681154145819
51.43491.47871247448677-0.0438124744867672
61.43881.45697343363223-0.0181734336322334
71.42641.4557137140303-0.0293137140303019
81.43431.43499109608433-0.000691096084328935
91.3771.44269488318999-0.0656948831899857
101.37061.366743087200220.00385691279978118
111.35561.36143812454862-0.00583812454861943
121.31791.34478059046444-0.026880590464438
131.29051.29944877402636-0.00894877402635674
141.32241.269508078322320.0528919216776822
151.32011.31642491501850.00367508498149882
161.31621.31516832862990.00103167137009552
171.27891.31156123612877-0.032661236128771
181.25261.26498820475301-0.0123882047530137
191.22881.23517100133453-0.00637100133453061
201.241.209562175268140.0304378247318551
211.28561.229403945672530.0561960543274687
221.29741.290958876861230.00644112313876999
231.28281.30458761159513-0.0217876115951343
241.31191.283801770828790.0280982291712084
251.32881.32087929377620.00792070622380492
261.33591.34002810509007-0.00412810509006922
271.29641.3459560720454-0.0495560720454011
281.30261.292386334784860.0102136652151399
291.29821.30148615271055-0.0032861527105521
301.31891.296153163001580.0227468369984207
311.3081.32331134273348-0.0153113427334779
321.3311.308064215116730.0229357848832701
331.33481.33757604008293-0.00277604008292665
341.36351.340587879258640.0229121207413558
351.34931.37579298560802-0.02649298560802
361.37041.35407121619880.0163287838011987
371.3611.37980721111092-0.0188072111109197
381.36581.365067552255560.000732447744441922
391.38231.37007550552740.0122244944726024
401.38121.39004622905881-0.00884622905881249
411.37321.3864346474611-0.0132346474611018
421.35921.37467712583302-0.0154771258330157
431.35391.35628292982371-0.00238292982370791
441.33161.35030637909751-0.0187063790975095
451.29011.32269534801424-0.0325953480142365
461.26731.27194102329584-0.00464102329584382
471.24721.24782336481935-0.000623364819345884
481.23311.227546381881360.00555361811864064
491.16211.21502314017857-0.0529231401785681
501.1351.128997440065910.00600255993408516
511.08381.10360165990573-0.0198016599057329
521.07791.046779661617790.0311203383822063
531.1151.049715208230440.0652847917695607
541.12131.105350572907150.0159494270928504
551.09961.11617886256754-0.016578862567536
561.11391.089771866415980.0241281335840182
571.12211.110922217666650.0111777823333512
581.12351.122295763391610.00120423660838531
591.07361.12403766483739-0.0504376648373945
601.08771.05981762971340.0278823702866


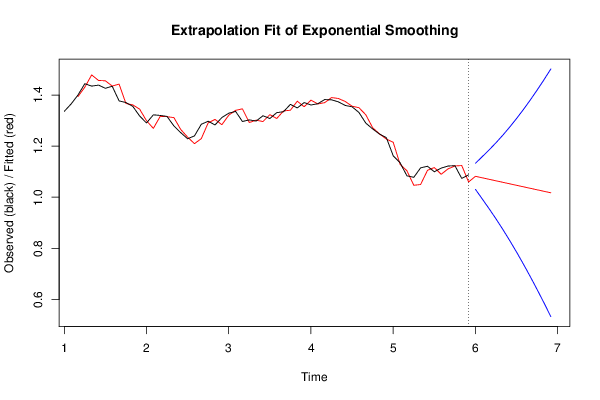
Extrapolation Forecasts of Exponential Smoothing
tForecast95% Lower Bound95% Upper Bound
611.08183386697641.030815576694181.13285215725861
621.075967733952790.9929404387790631.15899502912652
631.070101600929190.9548123077892351.18539089406915
641.064235467905590.9151825988928471.21328833691833
651.058369334881980.8737384452681481.24300022449582
661.052503201858380.8304071241357271.27459927958104
671.046637068834780.7851974228501341.30807671481942
681.040770935811180.7381486442181121.34339322740424
691.034904802787570.6893111395351251.38049846604002
701.029038669763970.6387381466573811.41933919287056
711.023172536740370.5864822233016511.45986285017908
721.017306403716760.5325937070261351.50201910040739

\begin{tabular}{lllllllll}
\hline
Extrapolation Forecasts of Exponential Smoothing \tabularnewline
t & Forecast & 95% Lower Bound & 95% Upper Bound \tabularnewline
61 & 1.0818338669764 & 1.03081557669418 & 1.13285215725861 \tabularnewline
62 & 1.07596773395279 & 0.992940438779063 & 1.15899502912652 \tabularnewline
63 & 1.07010160092919 & 0.954812307789235 & 1.18539089406915 \tabularnewline
64 & 1.06423546790559 & 0.915182598892847 & 1.21328833691833 \tabularnewline
65 & 1.05836933488198 & 0.873738445268148 & 1.24300022449582 \tabularnewline
66 & 1.05250320185838 & 0.830407124135727 & 1.27459927958104 \tabularnewline
67 & 1.04663706883478 & 0.785197422850134 & 1.30807671481942 \tabularnewline
68 & 1.04077093581118 & 0.738148644218112 & 1.34339322740424 \tabularnewline
69 & 1.03490480278757 & 0.689311139535125 & 1.38049846604002 \tabularnewline
70 & 1.02903866976397 & 0.638738146657381 & 1.41933919287056 \tabularnewline
71 & 1.02317253674037 & 0.586482223301651 & 1.45986285017908 \tabularnewline
72 & 1.01730640371676 & 0.532593707026135 & 1.50201910040739 \tabularnewline
\hline
\end{tabular}
%Source: https://freestatistics.org/blog/index.php?pk=&T=3

[TABLE]
[ROW][C]Extrapolation Forecasts of Exponential Smoothing[/C][/ROW]
[ROW][C]t[/C][C]Forecast[/C][C]95% Lower Bound[/C][C]95% Upper Bound[/C][/ROW]
[ROW][C]61[/C][C]1.0818338669764[/C][C]1.03081557669418[/C][C]1.13285215725861[/C][/ROW]
[ROW][C]62[/C][C]1.07596773395279[/C][C]0.992940438779063[/C][C]1.15899502912652[/C][/ROW]
[ROW][C]63[/C][C]1.07010160092919[/C][C]0.954812307789235[/C][C]1.18539089406915[/C][/ROW]
[ROW][C]64[/C][C]1.06423546790559[/C][C]0.915182598892847[/C][C]1.21328833691833[/C][/ROW]
[ROW][C]65[/C][C]1.05836933488198[/C][C]0.873738445268148[/C][C]1.24300022449582[/C][/ROW]
[ROW][C]66[/C][C]1.05250320185838[/C][C]0.830407124135727[/C][C]1.27459927958104[/C][/ROW]
[ROW][C]67[/C][C]1.04663706883478[/C][C]0.785197422850134[/C][C]1.30807671481942[/C][/ROW]
[ROW][C]68[/C][C]1.04077093581118[/C][C]0.738148644218112[/C][C]1.34339322740424[/C][/ROW]
[ROW][C]69[/C][C]1.03490480278757[/C][C]0.689311139535125[/C][C]1.38049846604002[/C][/ROW]
[ROW][C]70[/C][C]1.02903866976397[/C][C]0.638738146657381[/C][C]1.41933919287056[/C][/ROW]
[ROW][C]71[/C][C]1.02317253674037[/C][C]0.586482223301651[/C][C]1.45986285017908[/C][/ROW]
[ROW][C]72[/C][C]1.01730640371676[/C][C]0.532593707026135[/C][C]1.50201910040739[/C][/ROW]
[/TABLE]
Source: https://freestatistics.org/blog/index.php?pk=&T=3

Globally Unique Identifier (entire table): ba.freestatistics.org/blog/index.php?pk=&T=3

As an alternative you can also use a QR Code:  

The GUIDs for individual cells are displayed in the table below:

Extrapolation Forecasts of Exponential Smoothing
tForecast95% Lower Bound95% Upper Bound
611.08183386697641.030815576694181.13285215725861
621.075967733952790.9929404387790631.15899502912652
631.070101600929190.9548123077892351.18539089406915
641.064235467905590.9151825988928471.21328833691833
651.058369334881980.8737384452681481.24300022449582
661.052503201858380.8304071241357271.27459927958104
671.046637068834780.7851974228501341.30807671481942
681.040770935811180.7381486442181121.34339322740424
691.034904802787570.6893111395351251.38049846604002
701.029038669763970.6387381466573811.41933919287056
711.023172536740370.5864822233016511.45986285017908
721.017306403716760.5325937070261351.50201910040739


Parameters (Session):
par1 = 12 ; par2 = Double ; par3 = additive ;
Parameters (R input):
par1 = 12 ; par2 = Double ; par3 = additive ;
R code (references can be found in the software module):
par1 <- as.numeric(par1)
if (par2 == 'Single') K <- 1
if (par2 == 'Double') K <- 2
if (par2 == 'Triple') K <- par1
nx <- length(x)
nxmK <- nx - K
x <- ts(x, frequency = par1)
if (par2 == 'Single') fit <- HoltWinters(x, gamma=F, beta=F)
if (par2 == 'Double') fit <- HoltWinters(x, gamma=F)
if (par2 == 'Triple') fit <- HoltWinters(x, seasonal=par3)
fit
myresid <- x - fit$fitted[,'xhat']
bitmap(file='test1.png')
op <- par(mfrow=c(2,1))
plot(fit,ylab='Observed (black) / Fitted (red)',main='Interpolation Fit of Exponential Smoothing')
plot(myresid,ylab='Residuals',main='Interpolation Prediction Errors')
par(op)
dev.off()
bitmap(file='test2.png')
p <- predict(fit, par1, prediction.interval=TRUE)
np <- length(p[,1])
plot(fit,p,ylab='Observed (black) / Fitted (red)',main='Extrapolation Fit of Exponential Smoothing')
dev.off()
bitmap(file='test3.png')
op <- par(mfrow = c(2,2))
acf(as.numeric(myresid),lag.max = nx/2,main='Residual ACF')
spectrum(myresid,main='Residals Periodogram')
cpgram(myresid,main='Residal Cumulative Periodogram')
qqnorm(myresid,main='Residual Normal QQ Plot')
qqline(myresid)
par(op)
dev.off()
load(file='createtable')
a<-table.start()
a<-table.row.start(a)
a<-table.element(a,'Estimated Parameters of Exponential Smoothing',2,TRUE)
a<-table.row.end(a)
a<-table.row.start(a)
a<-table.element(a,'Parameter',header=TRUE)
a<-table.element(a,'Value',header=TRUE)
a<-table.row.end(a)
a<-table.row.start(a)
a<-table.element(a,'alpha',header=TRUE)
a<-table.element(a,fit$alpha)
a<-table.row.end(a)
a<-table.row.start(a)
a<-table.element(a,'beta',header=TRUE)
a<-table.element(a,fit$beta)
a<-table.row.end(a)
a<-table.row.start(a)
a<-table.element(a,'gamma',header=TRUE)
a<-table.element(a,fit$gamma)
a<-table.row.end(a)
a<-table.end(a)
table.save(a,file='mytable.tab')
a<-table.start()
a<-table.row.start(a)
a<-table.element(a,'Interpolation Forecasts of Exponential Smoothing',4,TRUE)
a<-table.row.end(a)
a<-table.row.start(a)
a<-table.element(a,'t',header=TRUE)
a<-table.element(a,'Observed',header=TRUE)
a<-table.element(a,'Fitted',header=TRUE)
a<-table.element(a,'Residuals',header=TRUE)
a<-table.row.end(a)
for (i in 1:nxmK) {
a<-table.row.start(a)
a<-table.element(a,i+K,header=TRUE)
a<-table.element(a,x[i+K])
a<-table.element(a,fit$fitted[i,'xhat'])
a<-table.element(a,myresid[i])
a<-table.row.end(a)
}
a<-table.end(a)
table.save(a,file='mytable1.tab')
a<-table.start()
a<-table.row.start(a)
a<-table.element(a,'Extrapolation Forecasts of Exponential Smoothing',4,TRUE)
a<-table.row.end(a)
a<-table.row.start(a)
a<-table.element(a,'t',header=TRUE)
a<-table.element(a,'Forecast',header=TRUE)
a<-table.element(a,'95% Lower Bound',header=TRUE)
a<-table.element(a,'95% Upper Bound',header=TRUE)
a<-table.row.end(a)
for (i in 1:np) {
a<-table.row.start(a)
a<-table.element(a,nx+i,header=TRUE)
a<-table.element(a,p[i,'fit'])
a<-table.element(a,p[i,'lwr'])
a<-table.element(a,p[i,'upr'])
a<-table.row.end(a)
}
a<-table.end(a)
table.save(a,file='mytable2.tab')