Free Statistics

of Irreproducible Research!

Author's title

Author*Unverified author*
R Software Modulerwasp_exponentialsmoothing.wasp
Title produced by softwareExponential Smoothing
Date of computationSun, 08 Jan 2017 14:09:56 +0000
Cite this page as followsStatistical Computations at FreeStatistics.org, Office for Research Development and Education, URL https://freestatistics.org/blog/index.php?v=date/2017/Jan/08/t148388463665ckuknia6t9556.htm/, Retrieved Wed, 15 May 2024 00:50:55 +0200
Statistical Computations at FreeStatistics.org, Office for Research Development and Education, URL https://freestatistics.org/blog/index.php?pk=, Retrieved Wed, 15 May 2024 00:50:55 +0200
QR Codes:

Original text written by user:
IsPrivate?No (this computation is public)
User-defined keywords
Estimated Impact0
Dataseries X:
209305
161498
126542
100278
168677
143277
127573
90760
160404
132039
117053
101248
152336
135356
119590
81695
155847
129364
111902
86772
150695
123177
114397
76927
160032
126833
110054
87080
161472
133737
121069
89365
163837
136276
120950
78858
124634
96579
94974
71028
145065
125041
120555
92507
180404
147940
125532
101901
166452
164909
95859
75225
115418
95535
90178
115685
107032
91924
85095
103517
109702
91594
99712
148342


Summary of computational transaction
Raw Inputview raw input (R code)
Raw Outputview raw output of R engine
Computing time1 seconds
R Server'Sir Maurice George Kendall' @ kendall.wessa.net

\begin{tabular}{lllllllll}
\hline
Summary of computational transaction \tabularnewline
Raw Input & view raw input (R code)  \tabularnewline
Raw Output & view raw output of R engine  \tabularnewline
Computing time & 1 seconds \tabularnewline
R Server & 'Sir Maurice George Kendall' @ kendall.wessa.net \tabularnewline
\hline
\end{tabular}
%Source: https://freestatistics.org/blog/index.php?pk=&T=0

[TABLE]
[ROW][C]Summary of computational transaction[/C][/ROW]
[ROW][C]Raw Input[/C][C]view raw input (R code) [/C][/ROW]
[ROW][C]Raw Output[/C][C]view raw output of R engine [/C][/ROW]
[ROW][C]Computing time[/C][C]1 seconds[/C][/ROW]
[ROW][C]R Server[/C][C]'Sir Maurice George Kendall' @ kendall.wessa.net[/C][/ROW]
[/TABLE]
Source: https://freestatistics.org/blog/index.php?pk=&T=0

Globally Unique Identifier (entire table): ba.freestatistics.org/blog/index.php?pk=&T=0

As an alternative you can also use a QR Code:  

The GUIDs for individual cells are displayed in the table below:

Summary of computational transaction
Raw Inputview raw input (R code)
Raw Outputview raw output of R engine
Computing time1 seconds
R Server'Sir Maurice George Kendall' @ kendall.wessa.net


Estimated Parameters of Exponential Smoothing
ParameterValue
alpha0.391986182007351
beta0
gamma0

\begin{tabular}{lllllllll}
\hline
Estimated Parameters of Exponential Smoothing \tabularnewline
Parameter & Value \tabularnewline
alpha & 0.391986182007351 \tabularnewline
beta & 0 \tabularnewline
gamma & 0 \tabularnewline
\hline
\end{tabular}
%Source: https://freestatistics.org/blog/index.php?pk=&T=1

[TABLE]
[ROW][C]Estimated Parameters of Exponential Smoothing[/C][/ROW]
[ROW][C]Parameter[/C][C]Value[/C][/ROW]
[ROW][C]alpha[/C][C]0.391986182007351[/C][/ROW]
[ROW][C]beta[/C][C]0[/C][/ROW]
[ROW][C]gamma[/C][C]0[/C][/ROW]
[/TABLE]
Source: https://freestatistics.org/blog/index.php?pk=&T=1

Globally Unique Identifier (entire table): ba.freestatistics.org/blog/index.php?pk=&T=1

As an alternative you can also use a QR Code:  

The GUIDs for individual cells are displayed in the table below:

Estimated Parameters of Exponential Smoothing
ParameterValue
alpha0.391986182007351
beta0
gamma0


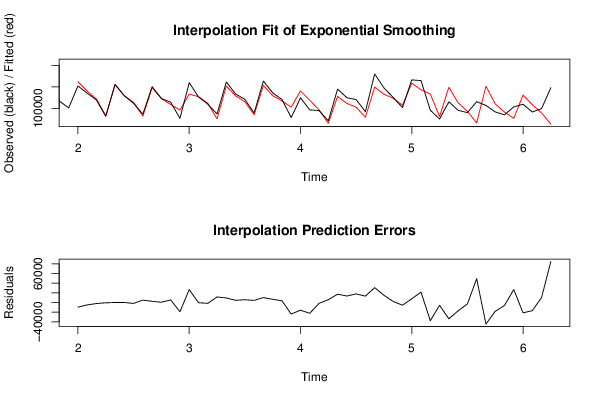
Interpolation Forecasts of Exponential Smoothing
tObservedFittedResiduals
13152336162101.529684067-9765.52968406695
14135356140373.576678711-5017.57667871096
15119590121796.670499704-2206.67049970437
168169582408.2553041083-713.255304108287
17155847155901.652717332-54.6527173316572
18129364129431.293468127-67.2934681265469
19111902113902.850466999-2000.85046699946
208677281853.70378897014918.29621102993
21150695148301.1061899362393.89381006433
22123177122748.620396811428.379603189416
23114397109086.9227256475310.07727435305
247692796134.7048434186-19207.7048434186
25160032133304.07533103526727.9246689653
26126833127411.247074283-578.24707428315
27110054111835.714197656-1781.71419765647
288708075675.184426583911404.8155734161
29161472152103.9486483939368.05135160673
30133737129344.0507068084392.94929319204
31121069115378.2368530915690.76314690869
328936585132.9614758044232.038524196
33163837153677.97565690510159.024343095
34136276129737.7359491146538.26405088624
35120950117491.7226372933458.27736270748
3678858102835.592912091-23977.592912091
37124634140644.852275564-16010.8522755643
3896579118992.805756769-22413.805756769
399497496766.0923484747-1792.09234847466
407102865312.89197180125715.10802819878
41145065127986.96147144717078.0385285526
42125041111671.0346377913369.9653622102
43120555102806.62493776617748.3750622339
449250779403.748699971413103.2513000286
45180404149655.80965166930748.1903483311
46147940133097.96427318514842.0357268149
47125532123416.5669236192115.4330763813
48101901107546.480553205-5645.48055320467
49166452158721.6616015977730.3383984027
50164909143484.59353165221424.4064683481
5195859133758.073208631-37899.0732086306
527522581013.0732631409-5788.07326314088
53115418149419.858299257-34001.8582992567
5495535112852.557140138-17317.5571401379
559017893171.8997876757-2993.89978767571
5611568566429.970486707449255.0295132926
57107032151794.264271229-44762.264271229
5891924110305.861513679-18381.8615136786
598509591338.7779516602-6243.77795166025
6010351776694.948920067626822.0510799324
61109702131181.796083553-21479.7960835533
6291594108611.505203925-17017.5052039247
639971289429.054202510310282.9457974897
6414834263522.936489867384819.0635101327

\begin{tabular}{lllllllll}
\hline
Interpolation Forecasts of Exponential Smoothing \tabularnewline
t & Observed & Fitted & Residuals \tabularnewline
13 & 152336 & 162101.529684067 & -9765.52968406695 \tabularnewline
14 & 135356 & 140373.576678711 & -5017.57667871096 \tabularnewline
15 & 119590 & 121796.670499704 & -2206.67049970437 \tabularnewline
16 & 81695 & 82408.2553041083 & -713.255304108287 \tabularnewline
17 & 155847 & 155901.652717332 & -54.6527173316572 \tabularnewline
18 & 129364 & 129431.293468127 & -67.2934681265469 \tabularnewline
19 & 111902 & 113902.850466999 & -2000.85046699946 \tabularnewline
20 & 86772 & 81853.7037889701 & 4918.29621102993 \tabularnewline
21 & 150695 & 148301.106189936 & 2393.89381006433 \tabularnewline
22 & 123177 & 122748.620396811 & 428.379603189416 \tabularnewline
23 & 114397 & 109086.922725647 & 5310.07727435305 \tabularnewline
24 & 76927 & 96134.7048434186 & -19207.7048434186 \tabularnewline
25 & 160032 & 133304.075331035 & 26727.9246689653 \tabularnewline
26 & 126833 & 127411.247074283 & -578.24707428315 \tabularnewline
27 & 110054 & 111835.714197656 & -1781.71419765647 \tabularnewline
28 & 87080 & 75675.1844265839 & 11404.8155734161 \tabularnewline
29 & 161472 & 152103.948648393 & 9368.05135160673 \tabularnewline
30 & 133737 & 129344.050706808 & 4392.94929319204 \tabularnewline
31 & 121069 & 115378.236853091 & 5690.76314690869 \tabularnewline
32 & 89365 & 85132.961475804 & 4232.038524196 \tabularnewline
33 & 163837 & 153677.975656905 & 10159.024343095 \tabularnewline
34 & 136276 & 129737.735949114 & 6538.26405088624 \tabularnewline
35 & 120950 & 117491.722637293 & 3458.27736270748 \tabularnewline
36 & 78858 & 102835.592912091 & -23977.592912091 \tabularnewline
37 & 124634 & 140644.852275564 & -16010.8522755643 \tabularnewline
38 & 96579 & 118992.805756769 & -22413.805756769 \tabularnewline
39 & 94974 & 96766.0923484747 & -1792.09234847466 \tabularnewline
40 & 71028 & 65312.8919718012 & 5715.10802819878 \tabularnewline
41 & 145065 & 127986.961471447 & 17078.0385285526 \tabularnewline
42 & 125041 & 111671.03463779 & 13369.9653622102 \tabularnewline
43 & 120555 & 102806.624937766 & 17748.3750622339 \tabularnewline
44 & 92507 & 79403.7486999714 & 13103.2513000286 \tabularnewline
45 & 180404 & 149655.809651669 & 30748.1903483311 \tabularnewline
46 & 147940 & 133097.964273185 & 14842.0357268149 \tabularnewline
47 & 125532 & 123416.566923619 & 2115.4330763813 \tabularnewline
48 & 101901 & 107546.480553205 & -5645.48055320467 \tabularnewline
49 & 166452 & 158721.661601597 & 7730.3383984027 \tabularnewline
50 & 164909 & 143484.593531652 & 21424.4064683481 \tabularnewline
51 & 95859 & 133758.073208631 & -37899.0732086306 \tabularnewline
52 & 75225 & 81013.0732631409 & -5788.07326314088 \tabularnewline
53 & 115418 & 149419.858299257 & -34001.8582992567 \tabularnewline
54 & 95535 & 112852.557140138 & -17317.5571401379 \tabularnewline
55 & 90178 & 93171.8997876757 & -2993.89978767571 \tabularnewline
56 & 115685 & 66429.9704867074 & 49255.0295132926 \tabularnewline
57 & 107032 & 151794.264271229 & -44762.264271229 \tabularnewline
58 & 91924 & 110305.861513679 & -18381.8615136786 \tabularnewline
59 & 85095 & 91338.7779516602 & -6243.77795166025 \tabularnewline
60 & 103517 & 76694.9489200676 & 26822.0510799324 \tabularnewline
61 & 109702 & 131181.796083553 & -21479.7960835533 \tabularnewline
62 & 91594 & 108611.505203925 & -17017.5052039247 \tabularnewline
63 & 99712 & 89429.0542025103 & 10282.9457974897 \tabularnewline
64 & 148342 & 63522.9364898673 & 84819.0635101327 \tabularnewline
\hline
\end{tabular}
%Source: https://freestatistics.org/blog/index.php?pk=&T=2

[TABLE]
[ROW][C]Interpolation Forecasts of Exponential Smoothing[/C][/ROW]
[ROW][C]t[/C][C]Observed[/C][C]Fitted[/C][C]Residuals[/C][/ROW]
[ROW][C]13[/C][C]152336[/C][C]162101.529684067[/C][C]-9765.52968406695[/C][/ROW]
[ROW][C]14[/C][C]135356[/C][C]140373.576678711[/C][C]-5017.57667871096[/C][/ROW]
[ROW][C]15[/C][C]119590[/C][C]121796.670499704[/C][C]-2206.67049970437[/C][/ROW]
[ROW][C]16[/C][C]81695[/C][C]82408.2553041083[/C][C]-713.255304108287[/C][/ROW]
[ROW][C]17[/C][C]155847[/C][C]155901.652717332[/C][C]-54.6527173316572[/C][/ROW]
[ROW][C]18[/C][C]129364[/C][C]129431.293468127[/C][C]-67.2934681265469[/C][/ROW]
[ROW][C]19[/C][C]111902[/C][C]113902.850466999[/C][C]-2000.85046699946[/C][/ROW]
[ROW][C]20[/C][C]86772[/C][C]81853.7037889701[/C][C]4918.29621102993[/C][/ROW]
[ROW][C]21[/C][C]150695[/C][C]148301.106189936[/C][C]2393.89381006433[/C][/ROW]
[ROW][C]22[/C][C]123177[/C][C]122748.620396811[/C][C]428.379603189416[/C][/ROW]
[ROW][C]23[/C][C]114397[/C][C]109086.922725647[/C][C]5310.07727435305[/C][/ROW]
[ROW][C]24[/C][C]76927[/C][C]96134.7048434186[/C][C]-19207.7048434186[/C][/ROW]
[ROW][C]25[/C][C]160032[/C][C]133304.075331035[/C][C]26727.9246689653[/C][/ROW]
[ROW][C]26[/C][C]126833[/C][C]127411.247074283[/C][C]-578.24707428315[/C][/ROW]
[ROW][C]27[/C][C]110054[/C][C]111835.714197656[/C][C]-1781.71419765647[/C][/ROW]
[ROW][C]28[/C][C]87080[/C][C]75675.1844265839[/C][C]11404.8155734161[/C][/ROW]
[ROW][C]29[/C][C]161472[/C][C]152103.948648393[/C][C]9368.05135160673[/C][/ROW]
[ROW][C]30[/C][C]133737[/C][C]129344.050706808[/C][C]4392.94929319204[/C][/ROW]
[ROW][C]31[/C][C]121069[/C][C]115378.236853091[/C][C]5690.76314690869[/C][/ROW]
[ROW][C]32[/C][C]89365[/C][C]85132.961475804[/C][C]4232.038524196[/C][/ROW]
[ROW][C]33[/C][C]163837[/C][C]153677.975656905[/C][C]10159.024343095[/C][/ROW]
[ROW][C]34[/C][C]136276[/C][C]129737.735949114[/C][C]6538.26405088624[/C][/ROW]
[ROW][C]35[/C][C]120950[/C][C]117491.722637293[/C][C]3458.27736270748[/C][/ROW]
[ROW][C]36[/C][C]78858[/C][C]102835.592912091[/C][C]-23977.592912091[/C][/ROW]
[ROW][C]37[/C][C]124634[/C][C]140644.852275564[/C][C]-16010.8522755643[/C][/ROW]
[ROW][C]38[/C][C]96579[/C][C]118992.805756769[/C][C]-22413.805756769[/C][/ROW]
[ROW][C]39[/C][C]94974[/C][C]96766.0923484747[/C][C]-1792.09234847466[/C][/ROW]
[ROW][C]40[/C][C]71028[/C][C]65312.8919718012[/C][C]5715.10802819878[/C][/ROW]
[ROW][C]41[/C][C]145065[/C][C]127986.961471447[/C][C]17078.0385285526[/C][/ROW]
[ROW][C]42[/C][C]125041[/C][C]111671.03463779[/C][C]13369.9653622102[/C][/ROW]
[ROW][C]43[/C][C]120555[/C][C]102806.624937766[/C][C]17748.3750622339[/C][/ROW]
[ROW][C]44[/C][C]92507[/C][C]79403.7486999714[/C][C]13103.2513000286[/C][/ROW]
[ROW][C]45[/C][C]180404[/C][C]149655.809651669[/C][C]30748.1903483311[/C][/ROW]
[ROW][C]46[/C][C]147940[/C][C]133097.964273185[/C][C]14842.0357268149[/C][/ROW]
[ROW][C]47[/C][C]125532[/C][C]123416.566923619[/C][C]2115.4330763813[/C][/ROW]
[ROW][C]48[/C][C]101901[/C][C]107546.480553205[/C][C]-5645.48055320467[/C][/ROW]
[ROW][C]49[/C][C]166452[/C][C]158721.661601597[/C][C]7730.3383984027[/C][/ROW]
[ROW][C]50[/C][C]164909[/C][C]143484.593531652[/C][C]21424.4064683481[/C][/ROW]
[ROW][C]51[/C][C]95859[/C][C]133758.073208631[/C][C]-37899.0732086306[/C][/ROW]
[ROW][C]52[/C][C]75225[/C][C]81013.0732631409[/C][C]-5788.07326314088[/C][/ROW]
[ROW][C]53[/C][C]115418[/C][C]149419.858299257[/C][C]-34001.8582992567[/C][/ROW]
[ROW][C]54[/C][C]95535[/C][C]112852.557140138[/C][C]-17317.5571401379[/C][/ROW]
[ROW][C]55[/C][C]90178[/C][C]93171.8997876757[/C][C]-2993.89978767571[/C][/ROW]
[ROW][C]56[/C][C]115685[/C][C]66429.9704867074[/C][C]49255.0295132926[/C][/ROW]
[ROW][C]57[/C][C]107032[/C][C]151794.264271229[/C][C]-44762.264271229[/C][/ROW]
[ROW][C]58[/C][C]91924[/C][C]110305.861513679[/C][C]-18381.8615136786[/C][/ROW]
[ROW][C]59[/C][C]85095[/C][C]91338.7779516602[/C][C]-6243.77795166025[/C][/ROW]
[ROW][C]60[/C][C]103517[/C][C]76694.9489200676[/C][C]26822.0510799324[/C][/ROW]
[ROW][C]61[/C][C]109702[/C][C]131181.796083553[/C][C]-21479.7960835533[/C][/ROW]
[ROW][C]62[/C][C]91594[/C][C]108611.505203925[/C][C]-17017.5052039247[/C][/ROW]
[ROW][C]63[/C][C]99712[/C][C]89429.0542025103[/C][C]10282.9457974897[/C][/ROW]
[ROW][C]64[/C][C]148342[/C][C]63522.9364898673[/C][C]84819.0635101327[/C][/ROW]
[/TABLE]
Source: https://freestatistics.org/blog/index.php?pk=&T=2

Globally Unique Identifier (entire table): ba.freestatistics.org/blog/index.php?pk=&T=2

As an alternative you can also use a QR Code:  

The GUIDs for individual cells are displayed in the table below:

Interpolation Forecasts of Exponential Smoothing
tObservedFittedResiduals
13152336162101.529684067-9765.52968406695
14135356140373.576678711-5017.57667871096
15119590121796.670499704-2206.67049970437
168169582408.2553041083-713.255304108287
17155847155901.652717332-54.6527173316572
18129364129431.293468127-67.2934681265469
19111902113902.850466999-2000.85046699946
208677281853.70378897014918.29621102993
21150695148301.1061899362393.89381006433
22123177122748.620396811428.379603189416
23114397109086.9227256475310.07727435305
247692796134.7048434186-19207.7048434186
25160032133304.07533103526727.9246689653
26126833127411.247074283-578.24707428315
27110054111835.714197656-1781.71419765647
288708075675.184426583911404.8155734161
29161472152103.9486483939368.05135160673
30133737129344.0507068084392.94929319204
31121069115378.2368530915690.76314690869
328936585132.9614758044232.038524196
33163837153677.97565690510159.024343095
34136276129737.7359491146538.26405088624
35120950117491.7226372933458.27736270748
3678858102835.592912091-23977.592912091
37124634140644.852275564-16010.8522755643
3896579118992.805756769-22413.805756769
399497496766.0923484747-1792.09234847466
407102865312.89197180125715.10802819878
41145065127986.96147144717078.0385285526
42125041111671.0346377913369.9653622102
43120555102806.62493776617748.3750622339
449250779403.748699971413103.2513000286
45180404149655.80965166930748.1903483311
46147940133097.96427318514842.0357268149
47125532123416.5669236192115.4330763813
48101901107546.480553205-5645.48055320467
49166452158721.6616015977730.3383984027
50164909143484.59353165221424.4064683481
5195859133758.073208631-37899.0732086306
527522581013.0732631409-5788.07326314088
53115418149419.858299257-34001.8582992567
5495535112852.557140138-17317.5571401379
559017893171.8997876757-2993.89978767571
5611568566429.970486707449255.0295132926
57107032151794.264271229-44762.264271229
5891924110305.861513679-18381.8615136786
598509591338.7779516602-6243.77795166025
6010351776694.948920067626822.0510799324
61109702131181.796083553-21479.7960835533
6291594108611.505203925-17017.5052039247
639971289429.054202510310282.9457974897
6414834263522.936489867384819.0635101327


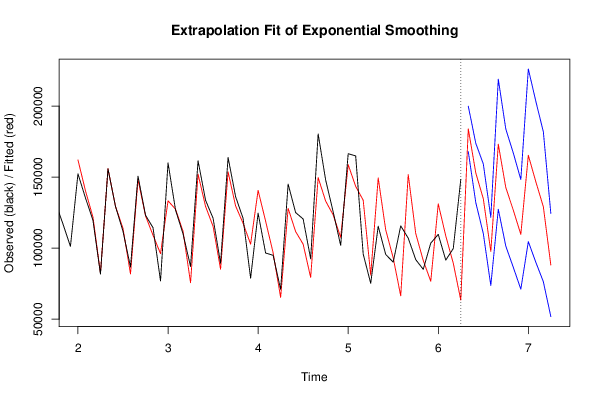
Extrapolation Forecasts of Exponential Smoothing
tForecast95% Lower Bound95% Upper Bound
65183943.960743812167946.062444704199941.859042921
66152942.835231216132072.512855384173813.157607048
67134809.058032711110323.384866696159294.731198726
6897693.918259052973700.5899303336121687.246587772
69173151.059938329127405.968366149218896.151510509
70142595.062029653101394.219733915183795.904325391
71126711.83545118886492.0410804892166931.629821887
72109698.43834309271127.1546433349148269.722042848
73165353.988286559104602.044763974226105.931809144
74146706.40191601790062.8639148173203349.939917216
75129163.5508078376402.1215579022181924.980057758
7688067.187477271751796.7465448952124337.628409648

\begin{tabular}{lllllllll}
\hline
Extrapolation Forecasts of Exponential Smoothing \tabularnewline
t & Forecast & 95% Lower Bound & 95% Upper Bound \tabularnewline
65 & 183943.960743812 & 167946.062444704 & 199941.859042921 \tabularnewline
66 & 152942.835231216 & 132072.512855384 & 173813.157607048 \tabularnewline
67 & 134809.058032711 & 110323.384866696 & 159294.731198726 \tabularnewline
68 & 97693.9182590529 & 73700.5899303336 & 121687.246587772 \tabularnewline
69 & 173151.059938329 & 127405.968366149 & 218896.151510509 \tabularnewline
70 & 142595.062029653 & 101394.219733915 & 183795.904325391 \tabularnewline
71 & 126711.835451188 & 86492.0410804892 & 166931.629821887 \tabularnewline
72 & 109698.438343092 & 71127.1546433349 & 148269.722042848 \tabularnewline
73 & 165353.988286559 & 104602.044763974 & 226105.931809144 \tabularnewline
74 & 146706.401916017 & 90062.8639148173 & 203349.939917216 \tabularnewline
75 & 129163.55080783 & 76402.1215579022 & 181924.980057758 \tabularnewline
76 & 88067.1874772717 & 51796.7465448952 & 124337.628409648 \tabularnewline
\hline
\end{tabular}
%Source: https://freestatistics.org/blog/index.php?pk=&T=3

[TABLE]
[ROW][C]Extrapolation Forecasts of Exponential Smoothing[/C][/ROW]
[ROW][C]t[/C][C]Forecast[/C][C]95% Lower Bound[/C][C]95% Upper Bound[/C][/ROW]
[ROW][C]65[/C][C]183943.960743812[/C][C]167946.062444704[/C][C]199941.859042921[/C][/ROW]
[ROW][C]66[/C][C]152942.835231216[/C][C]132072.512855384[/C][C]173813.157607048[/C][/ROW]
[ROW][C]67[/C][C]134809.058032711[/C][C]110323.384866696[/C][C]159294.731198726[/C][/ROW]
[ROW][C]68[/C][C]97693.9182590529[/C][C]73700.5899303336[/C][C]121687.246587772[/C][/ROW]
[ROW][C]69[/C][C]173151.059938329[/C][C]127405.968366149[/C][C]218896.151510509[/C][/ROW]
[ROW][C]70[/C][C]142595.062029653[/C][C]101394.219733915[/C][C]183795.904325391[/C][/ROW]
[ROW][C]71[/C][C]126711.835451188[/C][C]86492.0410804892[/C][C]166931.629821887[/C][/ROW]
[ROW][C]72[/C][C]109698.438343092[/C][C]71127.1546433349[/C][C]148269.722042848[/C][/ROW]
[ROW][C]73[/C][C]165353.988286559[/C][C]104602.044763974[/C][C]226105.931809144[/C][/ROW]
[ROW][C]74[/C][C]146706.401916017[/C][C]90062.8639148173[/C][C]203349.939917216[/C][/ROW]
[ROW][C]75[/C][C]129163.55080783[/C][C]76402.1215579022[/C][C]181924.980057758[/C][/ROW]
[ROW][C]76[/C][C]88067.1874772717[/C][C]51796.7465448952[/C][C]124337.628409648[/C][/ROW]
[/TABLE]
Source: https://freestatistics.org/blog/index.php?pk=&T=3

Globally Unique Identifier (entire table): ba.freestatistics.org/blog/index.php?pk=&T=3

As an alternative you can also use a QR Code:  

The GUIDs for individual cells are displayed in the table below:

Extrapolation Forecasts of Exponential Smoothing
tForecast95% Lower Bound95% Upper Bound
65183943.960743812167946.062444704199941.859042921
66152942.835231216132072.512855384173813.157607048
67134809.058032711110323.384866696159294.731198726
6897693.918259052973700.5899303336121687.246587772
69173151.059938329127405.968366149218896.151510509
70142595.062029653101394.219733915183795.904325391
71126711.83545118886492.0410804892166931.629821887
72109698.43834309271127.1546433349148269.722042848
73165353.988286559104602.044763974226105.931809144
74146706.40191601790062.8639148173203349.939917216
75129163.5508078376402.1215579022181924.980057758
7688067.187477271751796.7465448952124337.628409648


Parameters (Session):
par1 = 12 ; par2 = Triple ; par3 = multiplicative ;
Parameters (R input):
par1 = 12 ; par2 = Triple ; par3 = multiplicative ;
R code (references can be found in the software module):
par1 <- as.numeric(par1)
if (par2 == 'Single') K <- 1
if (par2 == 'Double') K <- 2
if (par2 == 'Triple') K <- par1
nx <- length(x)
nxmK <- nx - K
x <- ts(x, frequency = par1)
if (par2 == 'Single') fit <- HoltWinters(x, gamma=F, beta=F)
if (par2 == 'Double') fit <- HoltWinters(x, gamma=F)
if (par2 == 'Triple') fit <- HoltWinters(x, seasonal=par3)
fit
myresid <- x - fit$fitted[,'xhat']
bitmap(file='test1.png')
op <- par(mfrow=c(2,1))
plot(fit,ylab='Observed (black) / Fitted (red)',main='Interpolation Fit of Exponential Smoothing')
plot(myresid,ylab='Residuals',main='Interpolation Prediction Errors')
par(op)
dev.off()
bitmap(file='test2.png')
p <- predict(fit, par1, prediction.interval=TRUE)
np <- length(p[,1])
plot(fit,p,ylab='Observed (black) / Fitted (red)',main='Extrapolation Fit of Exponential Smoothing')
dev.off()
bitmap(file='test3.png')
op <- par(mfrow = c(2,2))
acf(as.numeric(myresid),lag.max = nx/2,main='Residual ACF')
spectrum(myresid,main='Residals Periodogram')
cpgram(myresid,main='Residal Cumulative Periodogram')
qqnorm(myresid,main='Residual Normal QQ Plot')
qqline(myresid)
par(op)
dev.off()
load(file='createtable')
a<-table.start()
a<-table.row.start(a)
a<-table.element(a,'Estimated Parameters of Exponential Smoothing',2,TRUE)
a<-table.row.end(a)
a<-table.row.start(a)
a<-table.element(a,'Parameter',header=TRUE)
a<-table.element(a,'Value',header=TRUE)
a<-table.row.end(a)
a<-table.row.start(a)
a<-table.element(a,'alpha',header=TRUE)
a<-table.element(a,fit$alpha)
a<-table.row.end(a)
a<-table.row.start(a)
a<-table.element(a,'beta',header=TRUE)
a<-table.element(a,fit$beta)
a<-table.row.end(a)
a<-table.row.start(a)
a<-table.element(a,'gamma',header=TRUE)
a<-table.element(a,fit$gamma)
a<-table.row.end(a)
a<-table.end(a)
table.save(a,file='mytable.tab')
a<-table.start()
a<-table.row.start(a)
a<-table.element(a,'Interpolation Forecasts of Exponential Smoothing',4,TRUE)
a<-table.row.end(a)
a<-table.row.start(a)
a<-table.element(a,'t',header=TRUE)
a<-table.element(a,'Observed',header=TRUE)
a<-table.element(a,'Fitted',header=TRUE)
a<-table.element(a,'Residuals',header=TRUE)
a<-table.row.end(a)
for (i in 1:nxmK) {
a<-table.row.start(a)
a<-table.element(a,i+K,header=TRUE)
a<-table.element(a,x[i+K])
a<-table.element(a,fit$fitted[i,'xhat'])
a<-table.element(a,myresid[i])
a<-table.row.end(a)
}
a<-table.end(a)
table.save(a,file='mytable1.tab')
a<-table.start()
a<-table.row.start(a)
a<-table.element(a,'Extrapolation Forecasts of Exponential Smoothing',4,TRUE)
a<-table.row.end(a)
a<-table.row.start(a)
a<-table.element(a,'t',header=TRUE)
a<-table.element(a,'Forecast',header=TRUE)
a<-table.element(a,'95% Lower Bound',header=TRUE)
a<-table.element(a,'95% Upper Bound',header=TRUE)
a<-table.row.end(a)
for (i in 1:np) {
a<-table.row.start(a)
a<-table.element(a,nx+i,header=TRUE)
a<-table.element(a,p[i,'fit'])
a<-table.element(a,p[i,'lwr'])
a<-table.element(a,p[i,'upr'])
a<-table.row.end(a)
}
a<-table.end(a)
table.save(a,file='mytable2.tab')