Free Statistics
of Irreproducible Research!
Description of Statistical Computation | |||||||||||||||||||||||||||||||||||||||||
|---|---|---|---|---|---|---|---|---|---|---|---|---|---|---|---|---|---|---|---|---|---|---|---|---|---|---|---|---|---|---|---|---|---|---|---|---|---|---|---|---|---|
| Author's title | |||||||||||||||||||||||||||||||||||||||||
| Author | *Unverified author* | ||||||||||||||||||||||||||||||||||||||||
| R Software Module | rwasp_univariatedataseries.wasp | ||||||||||||||||||||||||||||||||||||||||
| Title produced by software | Univariate Data Series | ||||||||||||||||||||||||||||||||||||||||
| Date of computation | Tue, 14 Feb 2017 11:17:50 +0000 | ||||||||||||||||||||||||||||||||||||||||
| Cite this page as follows | Statistical Computations at FreeStatistics.org, Office for Research Development and Education, URL https://freestatistics.org/blog/index.php?v=date/2017/Feb/14/t1487071173d9dbzp4jdsa0vvp.htm/, Retrieved Sun, 12 May 2024 13:35:18 +0200 | ||||||||||||||||||||||||||||||||||||||||
| Statistical Computations at FreeStatistics.org, Office for Research Development and Education, URL https://freestatistics.org/blog/index.php?pk=, Retrieved Sun, 12 May 2024 13:35:18 +0200 | |||||||||||||||||||||||||||||||||||||||||
| QR Codes: | |||||||||||||||||||||||||||||||||||||||||
|
| |||||||||||||||||||||||||||||||||||||||||
| Original text written by user: | |||||||||||||||||||||||||||||||||||||||||
| IsPrivate? | No (this computation is public) | ||||||||||||||||||||||||||||||||||||||||
| User-defined keywords | |||||||||||||||||||||||||||||||||||||||||
| Estimated Impact | 0 | ||||||||||||||||||||||||||||||||||||||||
Tree of Dependent Computations | |||||||||||||||||||||||||||||||||||||||||
Dataset | |||||||||||||||||||||||||||||||||||||||||
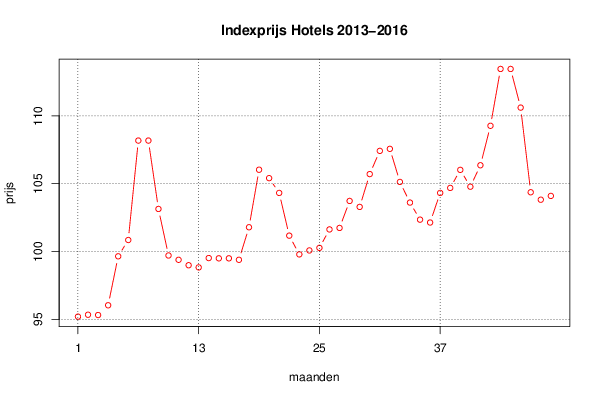
| Dataseries X: | |||||||||||||||||||||||||||||||||||||||||
95,2 95,34 95,32 96,04 99,65 100,85 108,18 108,18 103,14 99,71 99,39 98,99 98,83 99,52 99,5 99,5 99,39 101,79 106,03 105,41 104,32 101,17 99,79 100,08 100,27 101,63 101,74 103,73 103,29 105,71 107,42 107,57 105,13 103,61 102,35 102,14 104,32 104,69 106,02 104,78 106,36 109,27 113,46 113,46 110,61 104,37 103,82 104,1 | |||||||||||||||||||||||||||||||||||||||||
Tables (Output of Computation) | |||||||||||||||||||||||||||||||||||||||||
| |||||||||||||||||||||||||||||||||||||||||
Figures (Output of Computation) | |||||||||||||||||||||||||||||||||||||||||
Input Parameters & R Code | |||||||||||||||||||||||||||||||||||||||||
| Parameters (Session): | |||||||||||||||||||||||||||||||||||||||||
| par1 = consumptie indexprijs hotels ; par2 = NBB ; par3 = Indexprijs Hotels 2013-2016 ; par4 = 12 ; | |||||||||||||||||||||||||||||||||||||||||
| Parameters (R input): | |||||||||||||||||||||||||||||||||||||||||
| par1 = consumptie indexprijs hotels ; par2 = NBB ; par3 = Indexprijs Hotels 2013-2016 ; par4 = 12 ; | |||||||||||||||||||||||||||||||||||||||||
| R code (references can be found in the software module): | |||||||||||||||||||||||||||||||||||||||||
if (par4 != 'No season') { | |||||||||||||||||||||||||||||||||||||||||