Free Statistics

of Irreproducible Research!

Author's title

Author*The author of this computation has been verified*
R Software Modulerwasp_notchedbox1.wasp
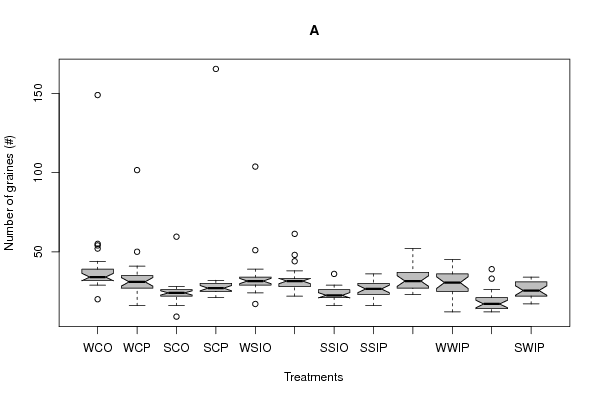
Title produced by softwareNotched Boxplots
Date of computationWed, 27 Dec 2017 04:36:37 +0100
Cite this page as followsStatistical Computations at FreeStatistics.org, Office for Research Development and Education, URL https://freestatistics.org/blog/index.php?v=date/2017/Dec/27/t1514345974khl5sxqa1j6f1hi.htm/, Retrieved Wed, 15 May 2024 06:02:37 +0200
Statistical Computations at FreeStatistics.org, Office for Research Development and Education, URL https://freestatistics.org/blog/index.php?pk=, Retrieved Wed, 15 May 2024 06:02:37 +0200
QR Codes:

Original text written by user:
IsPrivate?This computation is private
User-defined keywordsazospirillum, wheat
Estimated Impact0
Dataseries X:
36	35	25	26	33	32	20	16	28	21	17	30
29	36	23	21	39	30	24	23	34	33	26	26
32	21	26	30	32	44	22	31	31	39	20	24
35	30	  9	28	31	36	19	26	36	36	17	20
34	41	22	24	29	29	29	22	30	45	16	34
52	33	25	32	29	27	23	26	31	36	14	31
55	28	19	24	29	25	16	30	48	25	26	32
31	36	22	28	26	33	18	25	37	43	19	23
33	30	26	26	29	23	22	26	24	28	20	26
39	32	23	26	38	26	28	29	33	30	12	33
54	25	21	27	51	31	21	27	32	12	18	24
29	20	16	27	34	33	22	17	26	31	16	17
44	27	28	27	26	33	21	29	27	33	15	19
33	33	27	25	28	32	26	29	52	24	21	25
30	34	23	30	34	48	22	32	40	38	13	25
33	23	24	30	34	22	25	23	34	37	14	20
33	27	25	30	29	38	23	19	30	31	25	22
34	50	18	26	34	28	22	28	37	28	13	34
38	29	28	23	34	29	23	32	39	28	16	27
38	33	24	31	24	32	28	25	27	23	14	18

149.0	101.6	59.5
165.5	103.8	61.3


Summary of computational transaction
Raw Input view raw input (R code)
Raw Outputview raw output of R engine
Computing time1 seconds
R ServerBig Analytics Cloud Computing Center
R Framework error message
Warning: there are blank lines in the 'Data X' field.
Please, use NA for missing data - blank lines are simply
 deleted and are NOT treated as missing values.

\begin{tabular}{lllllllll}
\hline
Summary of computational transaction \tabularnewline
Raw Input view raw input (R code)  \tabularnewline
Raw Outputview raw output of R engine  \tabularnewline
Computing time1 seconds \tabularnewline
R ServerBig Analytics Cloud Computing Center \tabularnewline
R Framework error message & 
Warning: there are blank lines in the 'Data X' field.
Please, use NA for missing data - blank lines are simply
 deleted and are NOT treated as missing values.
\tabularnewline \hline \end{tabular} %Source: https://freestatistics.org/blog/index.php?pk=&T=0

[TABLE]
[ROW]
Summary of computational transaction[/C][/ROW] [ROW]Raw Input[/C] view raw input (R code) [/C][/ROW] [ROW]Raw Output[/C]view raw output of R engine [/C][/ROW] [ROW]Computing time[/C]1 seconds[/C][/ROW] [ROW]R Server[/C]Big Analytics Cloud Computing Center[/C][/ROW] [ROW]R Framework error message[/C][C]
Warning: there are blank lines in the 'Data X' field.
Please, use NA for missing data - blank lines are simply
 deleted and are NOT treated as missing values.
[/C][/ROW] [/TABLE] Source: https://freestatistics.org/blog/index.php?pk=&T=0

Globally Unique Identifier (entire table): ba.freestatistics.org/blog/index.php?pk=&T=0

As an alternative you can also use a QR Code:  

The GUIDs for individual cells are displayed in the table below:

Summary of computational transaction
Raw Input view raw input (R code)
Raw Outputview raw output of R engine
Computing time1 seconds
R ServerBig Analytics Cloud Computing Center
R Framework error message
Warning: there are blank lines in the 'Data X' field.
Please, use NA for missing data - blank lines are simply
 deleted and are NOT treated as missing values.


Boxplot statistics
Variablelower whiskerlower hingemedianupper hingeupper whisker
WCO2932343944
WCP1627313541
SCO1622242628
SCP2125273032
WSIO242931.53439
WSIP222831.53338
SSIO162122.52629
SSIP162326.53036
WWIO232731.53752
WWIP122530.53645
SWIO1214172126
SWIP 172225.53134

\begin{tabular}{lllllllll}
\hline
Boxplot statistics \tabularnewline
Variable & lower whisker & lower hinge & median & upper hinge & upper whisker \tabularnewline
WCO & 29 & 32 & 34 & 39 & 44 \tabularnewline
WCP & 16 & 27 & 31 & 35 & 41 \tabularnewline
SCO & 16 & 22 & 24 & 26 & 28 \tabularnewline
SCP & 21 & 25 & 27 & 30 & 32 \tabularnewline
WSIO & 24 & 29 & 31.5 & 34 & 39 \tabularnewline
WSIP & 22 & 28 & 31.5 & 33 & 38 \tabularnewline
SSIO & 16 & 21 & 22.5 & 26 & 29 \tabularnewline
SSIP & 16 & 23 & 26.5 & 30 & 36 \tabularnewline
WWIO & 23 & 27 & 31.5 & 37 & 52 \tabularnewline
WWIP & 12 & 25 & 30.5 & 36 & 45 \tabularnewline
SWIO & 12 & 14 & 17 & 21 & 26 \tabularnewline
SWIP
 & 17 & 22 & 25.5 & 31 & 34 \tabularnewline
\hline
\end{tabular}
%Source: https://freestatistics.org/blog/index.php?pk=&T=1

[TABLE]
[ROW][C]Boxplot statistics[/C][/ROW]
[ROW][C]Variable[/C][C]lower whisker[/C][C]lower hinge[/C][C]median[/C][C]upper hinge[/C][C]upper whisker[/C][/ROW]
[ROW][C]WCO[/C][C]29[/C][C]32[/C][C]34[/C][C]39[/C][C]44[/C][/ROW]
[ROW][C]WCP[/C][C]16[/C][C]27[/C][C]31[/C][C]35[/C][C]41[/C][/ROW]
[ROW][C]SCO[/C][C]16[/C][C]22[/C][C]24[/C][C]26[/C][C]28[/C][/ROW]
[ROW][C]SCP[/C][C]21[/C][C]25[/C][C]27[/C][C]30[/C][C]32[/C][/ROW]
[ROW][C]WSIO[/C][C]24[/C][C]29[/C][C]31.5[/C][C]34[/C][C]39[/C][/ROW]
[ROW][C]WSIP[/C][C]22[/C][C]28[/C][C]31.5[/C][C]33[/C][C]38[/C][/ROW]
[ROW][C]SSIO[/C][C]16[/C][C]21[/C][C]22.5[/C][C]26[/C][C]29[/C][/ROW]
[ROW][C]SSIP[/C][C]16[/C][C]23[/C][C]26.5[/C][C]30[/C][C]36[/C][/ROW]
[ROW][C]WWIO[/C][C]23[/C][C]27[/C][C]31.5[/C][C]37[/C][C]52[/C][/ROW]
[ROW][C]WWIP[/C][C]12[/C][C]25[/C][C]30.5[/C][C]36[/C][C]45[/C][/ROW]
[ROW][C]SWIO[/C][C]12[/C][C]14[/C][C]17[/C][C]21[/C][C]26[/C][/ROW]
[ROW][C]SWIP
[/C][C]17[/C][C]22[/C][C]25.5[/C][C]31[/C][C]34[/C][/ROW]
[/TABLE]
Source: https://freestatistics.org/blog/index.php?pk=&T=1

Globally Unique Identifier (entire table): ba.freestatistics.org/blog/index.php?pk=&T=1

As an alternative you can also use a QR Code:  

The GUIDs for individual cells are displayed in the table below:

Boxplot statistics
Variablelower whiskerlower hingemedianupper hingeupper whisker
WCO2932343944
WCP1627313541
SCO1622242628
SCP2125273032
WSIO242931.53439
WSIP222831.53338
SSIO162122.52629
SSIP162326.53036
WWIO232731.53752
WWIP122530.53645
SWIO1214172126
SWIP 172225.53134


Boxplot Notches
Variablelower boundmedianupper bound
WCO31.64200007710693436.3579999228931
WCP28.30514294526513133.6948570547349
SCO22.65257147263252425.3474285273675
SCP25.31571434079072728.6842856592093
WSIO29.815714340790731.533.1842856592093
WSIP29.815714340790731.533.1842856592093
SSIO20.815714340790722.524.1842856592093
SSIP24.142000077106926.528.8579999228931
WWIO28.131428681581431.534.8685713184186
WWIP26.794571549739530.534.2054284502605
SWIO14.64200007710691719.3579999228931
SWIP 22.468285813423225.528.5317141865768

\begin{tabular}{lllllllll}
\hline
Boxplot Notches \tabularnewline
Variable & lower bound & median & upper bound \tabularnewline
WCO & 31.6420000771069 & 34 & 36.3579999228931 \tabularnewline
WCP & 28.3051429452651 & 31 & 33.6948570547349 \tabularnewline
SCO & 22.6525714726325 & 24 & 25.3474285273675 \tabularnewline
SCP & 25.3157143407907 & 27 & 28.6842856592093 \tabularnewline
WSIO & 29.8157143407907 & 31.5 & 33.1842856592093 \tabularnewline
WSIP & 29.8157143407907 & 31.5 & 33.1842856592093 \tabularnewline
SSIO & 20.8157143407907 & 22.5 & 24.1842856592093 \tabularnewline
SSIP & 24.1420000771069 & 26.5 & 28.8579999228931 \tabularnewline
WWIO & 28.1314286815814 & 31.5 & 34.8685713184186 \tabularnewline
WWIP & 26.7945715497395 & 30.5 & 34.2054284502605 \tabularnewline
SWIO & 14.6420000771069 & 17 & 19.3579999228931 \tabularnewline
SWIP
 & 22.4682858134232 & 25.5 & 28.5317141865768 \tabularnewline
\hline
\end{tabular}
%Source: https://freestatistics.org/blog/index.php?pk=&T=2

[TABLE]
[ROW][C]Boxplot Notches[/C][/ROW]
[ROW][C]Variable[/C][C]lower bound[/C][C]median[/C][C]upper bound[/C][/ROW]
[ROW][C]WCO[/C][C]31.6420000771069[/C][C]34[/C][C]36.3579999228931[/C][/ROW]
[ROW][C]WCP[/C][C]28.3051429452651[/C][C]31[/C][C]33.6948570547349[/C][/ROW]
[ROW][C]SCO[/C][C]22.6525714726325[/C][C]24[/C][C]25.3474285273675[/C][/ROW]
[ROW][C]SCP[/C][C]25.3157143407907[/C][C]27[/C][C]28.6842856592093[/C][/ROW]
[ROW][C]WSIO[/C][C]29.8157143407907[/C][C]31.5[/C][C]33.1842856592093[/C][/ROW]
[ROW][C]WSIP[/C][C]29.8157143407907[/C][C]31.5[/C][C]33.1842856592093[/C][/ROW]
[ROW][C]SSIO[/C][C]20.8157143407907[/C][C]22.5[/C][C]24.1842856592093[/C][/ROW]
[ROW][C]SSIP[/C][C]24.1420000771069[/C][C]26.5[/C][C]28.8579999228931[/C][/ROW]
[ROW][C]WWIO[/C][C]28.1314286815814[/C][C]31.5[/C][C]34.8685713184186[/C][/ROW]
[ROW][C]WWIP[/C][C]26.7945715497395[/C][C]30.5[/C][C]34.2054284502605[/C][/ROW]
[ROW][C]SWIO[/C][C]14.6420000771069[/C][C]17[/C][C]19.3579999228931[/C][/ROW]
[ROW][C]SWIP
[/C][C]22.4682858134232[/C][C]25.5[/C][C]28.5317141865768[/C][/ROW]
[/TABLE]
Source: https://freestatistics.org/blog/index.php?pk=&T=2

Globally Unique Identifier (entire table): ba.freestatistics.org/blog/index.php?pk=&T=2

As an alternative you can also use a QR Code:  

The GUIDs for individual cells are displayed in the table below:

Boxplot Notches
Variablelower boundmedianupper bound
WCO31.64200007710693436.3579999228931
WCP28.30514294526513133.6948570547349
SCO22.65257147263252425.3474285273675
SCP25.31571434079072728.6842856592093
WSIO29.815714340790731.533.1842856592093
WSIP29.815714340790731.533.1842856592093
SSIO20.815714340790722.524.1842856592093
SSIP24.142000077106926.528.8579999228931
WWIO28.131428681581431.534.8685713184186
WWIP26.794571549739530.534.2054284502605
SWIO14.64200007710691719.3579999228931
SWIP 22.468285813423225.528.5317141865768


Parameters (Session):
par1 = grey ; par2 = no ;
Parameters (R input):
par1 = grey ; par2 = no ;
R code (references can be found in the software module):
if(par2=='yes') {
z <- na.omit(as.data.frame(t(y)))
} else {
z <- as.data.frame(t(y))
}
bitmap(file='test1.png')
(r<-boxplot(z ,xlab=xlab,ylab=ylab,main=main,notch=TRUE,col=par1))
dev.off()
load(file='createtable')
a<-table.start()
a<-table.row.start(a)
a<-table.element(a,'Boxplot statistics',6,TRUE)
a<-table.row.end(a)
a<-table.row.start(a)
a<-table.element(a,'Variable',1,TRUE)
a<-table.element(a,'lower whisker',1,TRUE)
a<-table.element(a,'lower hinge',1,TRUE)
a<-table.element(a,'median',1,TRUE)
a<-table.element(a,'upper hinge',1,TRUE)
a<-table.element(a,'upper whisker',1,TRUE)
a<-table.row.end(a)
for (i in 1:length(y[,1]))
{
a<-table.row.start(a)
a<-table.element(a,dimnames(t(x))[[2]][i],1,TRUE)
for (j in 1:5)
{
a<-table.element(a,r$stats[j,i])
}
a<-table.row.end(a)
}
a<-table.end(a)
table.save(a,file='mytable.tab')
a<-table.start()
a<-table.row.start(a)
a<-table.element(a,'Boxplot Notches',4,TRUE)
a<-table.row.end(a)
a<-table.row.start(a)
a<-table.element(a,'Variable',1,TRUE)
a<-table.element(a,'lower bound',1,TRUE)
a<-table.element(a,'median',1,TRUE)
a<-table.element(a,'upper bound',1,TRUE)
a<-table.row.end(a)
for (i in 1:length(y[,1]))
{
a<-table.row.start(a)
a<-table.element(a,dimnames(t(x))[[2]][i],1,TRUE)
a<-table.element(a,r$conf[1,i])
a<-table.element(a,r$stats[3,i])
a<-table.element(a,r$conf[2,i])
a<-table.row.end(a)
}
a<-table.end(a)
table.save(a,file='mytable1.tab')