Free Statistics

of Irreproducible Research!

Author's title

Author*Unverified author*
R Software Modulerwasp_kendall.wasp
Title produced by softwareKendall tau Rank Correlation
Date of computationSun, 24 Dec 2017 00:45:56 +0100
Cite this page as followsStatistical Computations at FreeStatistics.org, Office for Research Development and Education, URL https://freestatistics.org/blog/index.php?v=date/2017/Dec/24/t1514072807ltf58j4atpgrmjc.htm/, Retrieved Mon, 13 May 2024 22:14:56 +0000
Statistical Computations at FreeStatistics.org, Office for Research Development and Education, URL https://freestatistics.org/blog/index.php?pk=310882, Retrieved Mon, 13 May 2024 22:14:56 +0000
QR Codes:

Original text written by user:
IsPrivate?No (this computation is public)
User-defined keywords
Estimated Impact128
Family? (F = Feedback message, R = changed R code, M = changed R Module, P = changed Parameters, D = changed Data)
-       [Kendall tau Rank Correlation] [] [2017-12-23 23:45:56] [d41d8cd98f00b204e9800998ecf8427e] [Current]
Feedback Forum

Post a new message
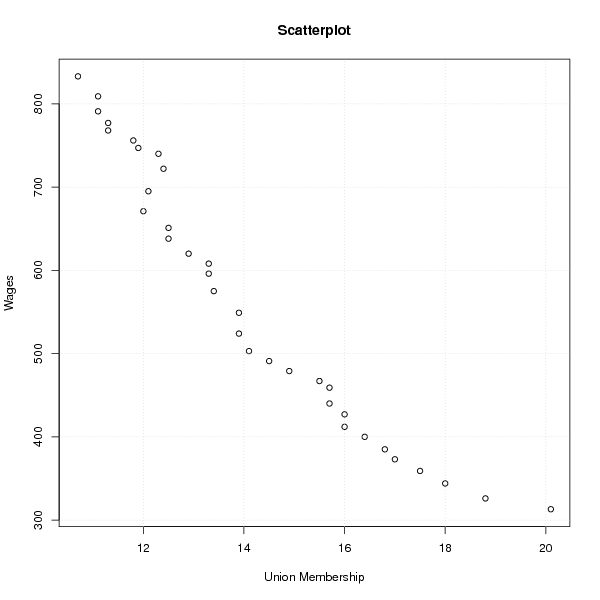
Dataseries X:
20.1
18.8
18.0
17.5
17.0
16.8
16.4
16.0
16.0
15.7
15.7
15.5
14.9
14.5
14.1
13.9
13.9
13.4
13.3
13.3
12.9
12.5
12.5
12.0
12.1
12.4
12.3
11.9
11.8
11.3
11.3
11.1
11.1
10.7
Dataseries Y:
313
326
344
359
373
385
400
412
427
440
459
467
479
491
503
524
549
575
596
608
620
638
651
671
695
722
740
747
756
768
777
791
809
833


Summary of computational transaction
Raw Input view raw input (R code)
Raw Outputview raw output of R engine
Computing time1 seconds
R ServerBig Analytics Cloud Computing Center

\begin{tabular}{lllllllll}
\hline
Summary of computational transaction \tabularnewline
Raw Input view raw input (R code)  \tabularnewline
Raw Outputview raw output of R engine  \tabularnewline
Computing time1 seconds \tabularnewline
R ServerBig Analytics Cloud Computing Center \tabularnewline
\hline
\end{tabular}
%Source: https://freestatistics.org/blog/index.php?pk=310882&T=0

[TABLE]
[ROW]
Summary of computational transaction[/C][/ROW] [ROW]Raw Input[/C] view raw input (R code) [/C][/ROW] [ROW]Raw Output[/C]view raw output of R engine [/C][/ROW] [ROW]Computing time[/C]1 seconds[/C][/ROW] [ROW]R Server[/C]Big Analytics Cloud Computing Center[/C][/ROW] [/TABLE] Source: https://freestatistics.org/blog/index.php?pk=310882&T=0

Globally Unique Identifier (entire table): ba.freestatistics.org/blog/index.php?pk=310882&T=0

As an alternative you can also use a QR Code:  

The GUIDs for individual cells are displayed in the table below:

Summary of computational transaction
Raw Input view raw input (R code)
Raw Outputview raw output of R engine
Computing time1 seconds
R ServerBig Analytics Cloud Computing Center


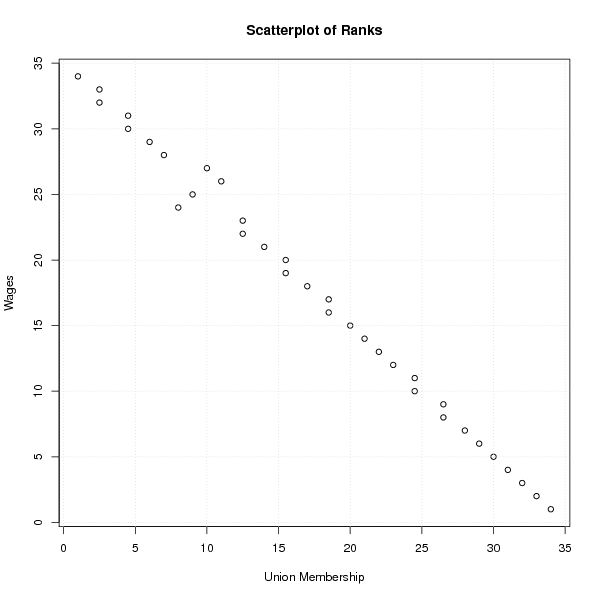
Kendall tau Rank Correlation
Kendall tau-0.975803971290588
2-sided p-value7.89142533413764e-16
Score-544
Var(Score)4543.33349609375
Denominator557.489013671875

\begin{tabular}{lllllllll}
\hline
Kendall tau Rank Correlation \tabularnewline
Kendall tau & -0.975803971290588 \tabularnewline
2-sided p-value & 7.89142533413764e-16 \tabularnewline
Score & -544 \tabularnewline
Var(Score) & 4543.33349609375 \tabularnewline
Denominator & 557.489013671875 \tabularnewline
\hline
\end{tabular}
%Source: https://freestatistics.org/blog/index.php?pk=310882&T=1

[TABLE]
[ROW][C]Kendall tau Rank Correlation[/C][/ROW]
[ROW][C]Kendall tau[/C][C]-0.975803971290588[/C][/ROW]
[ROW][C]2-sided p-value[/C][C]7.89142533413764e-16[/C][/ROW]
[ROW][C]Score[/C][C]-544[/C][/ROW]
[ROW][C]Var(Score)[/C][C]4543.33349609375[/C][/ROW]
[ROW][C]Denominator[/C][C]557.489013671875[/C][/ROW]
[/TABLE]
Source: https://freestatistics.org/blog/index.php?pk=310882&T=1

Globally Unique Identifier (entire table): ba.freestatistics.org/blog/index.php?pk=310882&T=1

As an alternative you can also use a QR Code:  

The GUIDs for individual cells are displayed in the table below:

Kendall tau Rank Correlation
Kendall tau-0.975803971290588
2-sided p-value7.89142533413764e-16
Score-544
Var(Score)4543.33349609375
Denominator557.489013671875


Parameters (Session):
Parameters (R input):
R code (references can be found in the software module):
library('Kendall')
k <- Kendall(x,y)
bitmap(file='test1.png')
par(bg=rgb(0.2,0.4,0.6))
plot(x,y,main='Scatterplot',xlab=xlab,ylab=ylab)
grid()
dev.off()
bitmap(file='test2.png')
par(bg=rgb(0.2,0.4,0.6))
plot(rank(x),rank(y),main='Scatterplot of Ranks',xlab=xlab,ylab=ylab)
grid()
dev.off()
load(file='createtable')
a<-table.start()
a<-table.row.start(a)
a<-table.element(a,'Kendall tau Rank Correlation',2,TRUE)
a<-table.row.end(a)
a<-table.row.start(a)
a<-table.element(a,'Kendall tau',header=TRUE)
a<-table.element(a,k$tau)
a<-table.row.end(a)
a<-table.row.start(a)
a<-table.element(a,'2-sided p-value',header=TRUE)
a<-table.element(a,k$sl)
a<-table.row.end(a)
a<-table.row.start(a)
a<-table.element(a,'Score',header=TRUE)
a<-table.element(a,k$S)
a<-table.row.end(a)
a<-table.row.start(a)
a<-table.element(a,'Var(Score)',header=TRUE)
a<-table.element(a,k$varS)
a<-table.row.end(a)
a<-table.row.start(a)
a<-table.element(a,'Denominator',header=TRUE)
a<-table.element(a,k$D)
a<-table.row.end(a)
a<-table.end(a)
table.save(a,file='mytable.tab')