Free Statistics
of Irreproducible Research!
Description of Statistical Computation | ||||||||||||||||||||||||||||||
|---|---|---|---|---|---|---|---|---|---|---|---|---|---|---|---|---|---|---|---|---|---|---|---|---|---|---|---|---|---|---|
| Author's title | ||||||||||||||||||||||||||||||
| Author | *The author of this computation has been verified* | |||||||||||||||||||||||||||||
| R Software Module | rwasp_skewness_kurtosis_plot.wasp | |||||||||||||||||||||||||||||
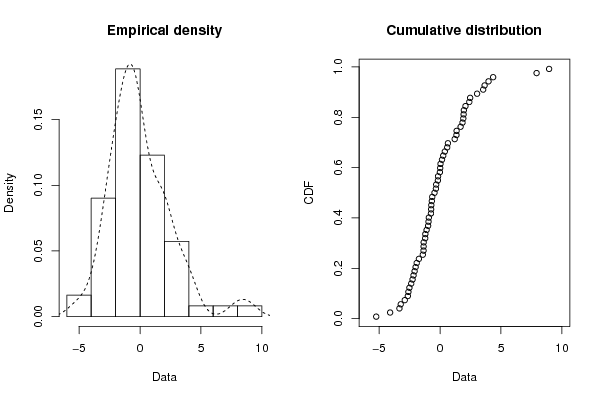
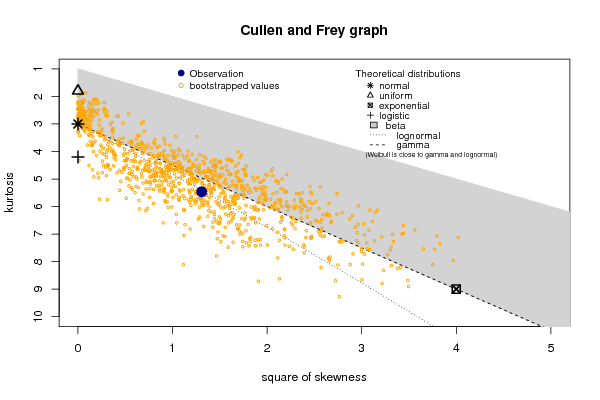
| Title produced by software | Skewness-Kurtosis Plot | |||||||||||||||||||||||||||||
| Date of computation | Sat, 23 Dec 2017 21:35:24 +0100 | |||||||||||||||||||||||||||||
| Cite this page as follows | Statistical Computations at FreeStatistics.org, Office for Research Development and Education, URL https://freestatistics.org/blog/index.php?v=date/2017/Dec/23/t1514062018grdr67pq40z80l1.htm/, Retrieved Wed, 15 May 2024 03:04:34 +0000 | |||||||||||||||||||||||||||||
| Statistical Computations at FreeStatistics.org, Office for Research Development and Education, URL https://freestatistics.org/blog/index.php?pk=310878, Retrieved Wed, 15 May 2024 03:04:34 +0000 | ||||||||||||||||||||||||||||||
| QR Codes: | ||||||||||||||||||||||||||||||
|
| ||||||||||||||||||||||||||||||
| Original text written by user: | Paper Sandrine Ponet & Jeremy Moras | |||||||||||||||||||||||||||||
| IsPrivate? | No (this computation is public) | |||||||||||||||||||||||||||||
| User-defined keywords | ||||||||||||||||||||||||||||||
| Estimated Impact | 79 | |||||||||||||||||||||||||||||
Tree of Dependent Computations | ||||||||||||||||||||||||||||||
| Family? (F = Feedback message, R = changed R code, M = changed R Module, P = changed Parameters, D = changed Data) | ||||||||||||||||||||||||||||||
| - [Skewness-Kurtosis Plot] [Skewness-Kurtosis...] [2017-12-23 20:35:24] [1cdffd72486a8dae23479df836ed99fd] [Current] | ||||||||||||||||||||||||||||||
| Feedback Forum | ||||||||||||||||||||||||||||||
Post a new message | ||||||||||||||||||||||||||||||
Dataset | ||||||||||||||||||||||||||||||
| Dataseries X: | ||||||||||||||||||||||||||||||
-0.976787115908831 -0.161294587381388 -2.63726348770093 -2.25127869531085 1.90837463451655 -0.72755914289797 -2.59325397493619 -1.41236766224092 -0.452895875109189 1.34891910960604 0.393134210673728 0.264087514848468 2.08814913048933 3.97894589702823 0.161899679278506 2.47117607115864 4.35751422384582 -0.637431519513299 -0.942978955895221 -2.88990396236902 -0.335622711272262 -1.72779136463042 1.93601715424977 -5.23223754180399 -1.33924356722636 -2.50896517557212 -2.17205027626886 7.91984546476342 -1.20350875940718 3.65740907472147 -2.08475206481219 -1.35112578226491 2.39984901173353 1.95527400118601 -3.22102485611896 3.03957509257294 -1.21503609254058 -0.916830674439972 -1.34741777531473 -0.0088672104368378 -3.32819250497403 -1.09974155907158 3.53913537559331 -0.672073038477158 1.3606287227615 -2.00006949570706 -4.09017922189623 0.649669036933679 -0.174122343312202 0.58911251743656 -0.717038568574659 -0.313550724540172 -2.36252066909778 1.68813419437634 0.0142103635959394 8.94531178499756 1.20438467785026 -1.90875377411265 1.84457628294094 -0.741431688997163 0.0398291929752785 | ||||||||||||||||||||||||||||||
Tables (Output of Computation) | ||||||||||||||||||||||||||||||
| ||||||||||||||||||||||||||||||
Figures (Output of Computation) | ||||||||||||||||||||||||||||||
Input Parameters & R Code | ||||||||||||||||||||||||||||||
| Parameters (Session): | ||||||||||||||||||||||||||||||
| par1 = 1 ; par2 = 2 ; par3 = TRUE ; | ||||||||||||||||||||||||||||||
| Parameters (R input): | ||||||||||||||||||||||||||||||
| R code (references can be found in the software module): | ||||||||||||||||||||||||||||||
library(fitdistrplus) | ||||||||||||||||||||||||||||||