Free Statistics

of Irreproducible Research!

Author's title

Author*The author of this computation has been verified*
R Software Modulerwasp_autocorrelation.wasp
Title produced by software(Partial) Autocorrelation Function
Date of computationFri, 22 Dec 2017 22:19:55 +0100
Cite this page as followsStatistical Computations at FreeStatistics.org, Office for Research Development and Education, URL https://freestatistics.org/blog/index.php?v=date/2017/Dec/22/t1513977737bviramw500nshdi.htm/, Retrieved Wed, 15 May 2024 05:00:39 +0000
Statistical Computations at FreeStatistics.org, Office for Research Development and Education, URL https://freestatistics.org/blog/index.php?pk=310838, Retrieved Wed, 15 May 2024 05:00:39 +0000
QR Codes:

Original text written by user:
IsPrivate?No (this computation is public)
User-defined keywords
Estimated Impact69
Family? (F = Feedback message, R = changed R code, M = changed R Module, P = changed Parameters, D = changed Data)
-       [(Partial) Autocorrelation Function] [autocorrelatie] [2017-12-22 21:19:55] [40cb9af790d98472ea54923de2b5af04] [Current]
Feedback Forum

Post a new message
Dataseries X:
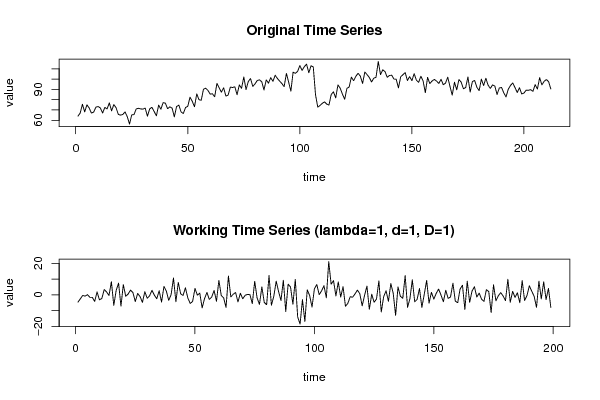
63.9
67.1
75.5
68.1
75
71.9
67
67.9
72.7
73.3
71.9
67
72.5
71
76.9
69.1
75.2
72.2
65.7
65
65.6
68.1
63.5
56.3
65.2
65.5
71
71.6
71
70.8
71.8
63.9
71
72.6
68.5
64.3
74.7
70.7
77.1
76.6
71.2
73
71.8
63.3
73.3
74.7
68.1
66.5
72.3
73.6
82.4
78.4
73.1
85.6
80
79.4
90.1
91.1
89
85.4
85.7
82.8
95.7
91.5
87.3
91.5
83.5
84.4
92.2
91.8
92.5
84.8
94.3
91
102
89.8
97.6
100.5
92.9
95.3
98.6
99.2
97.4
89.4
99.2
96
101.4
97.8
103.7
100.5
98
95.6
92.6
105.5
97.1
88.2
106.7
105.6
107.4
113.1
108.4
112
114.5
106.1
112.9
111.7
84.7
72.8
74.3
76.4
77.8
75.7
74.8
85
87.6
81.7
94.3
91.2
85.4
80.3
90.9
92.3
101.9
98.4
102.7
105.6
102.8
95.7
106.8
104.3
101.5
97.2
100.8
101.8
117
104.3
109
107.2
101.7
103.5
103.7
100
99.8
91.4
102.2
104.2
106.3
98.6
102.4
98.4
105.2
99
96.8
102.7
98.1
86.8
101.6
95.6
98.1
99.6
98.1
95.7
99.8
94.5
96
101.8
92.8
84.4
96.9
89.6
99.5
97
90.5
91.8
102
87.4
97.6
98.6
92
88.8
99.9
93.7
100.8
94.1
90.9
94.3
93.2
85
91.4
91.8
86.6
82.7
90.1
93.8
96.2
91.7
86.9
91.6
85.5
86.4
89.2
89.1
89.7
88.1
94.6
90.3
101.4
94.3
97.8
99.5
97.5
90.3


Summary of computational transaction
Raw Input view raw input (R code)
Raw Outputview raw output of R engine
Computing time1 seconds
R ServerBig Analytics Cloud Computing Center

\begin{tabular}{lllllllll}
\hline
Summary of computational transaction \tabularnewline
Raw Input view raw input (R code)  \tabularnewline
Raw Outputview raw output of R engine  \tabularnewline
Computing time1 seconds \tabularnewline
R ServerBig Analytics Cloud Computing Center \tabularnewline
\hline
\end{tabular}
%Source: https://freestatistics.org/blog/index.php?pk=310838&T=0

[TABLE]
[ROW]
Summary of computational transaction[/C][/ROW] [ROW]Raw Input[/C] view raw input (R code) [/C][/ROW] [ROW]Raw Output[/C]view raw output of R engine [/C][/ROW] [ROW]Computing time[/C]1 seconds[/C][/ROW] [ROW]R Server[/C]Big Analytics Cloud Computing Center[/C][/ROW] [/TABLE] Source: https://freestatistics.org/blog/index.php?pk=310838&T=0

Globally Unique Identifier (entire table): ba.freestatistics.org/blog/index.php?pk=310838&T=0

As an alternative you can also use a QR Code:  

The GUIDs for individual cells are displayed in the table below:

Summary of computational transaction
Raw Input view raw input (R code)
Raw Outputview raw output of R engine
Computing time1 seconds
R ServerBig Analytics Cloud Computing Center


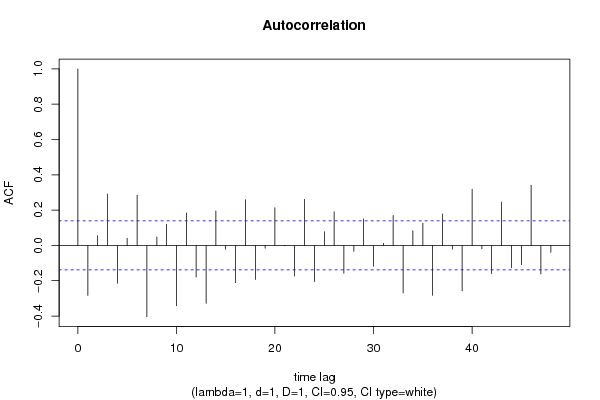
Autocorrelation Function
Time lag kACF(k)T-STATP-value
1-0.282923-3.99114.6e-05
20.0548810.77420.219867
30.290924.10393e-05
4-0.213985-3.01860.001436
50.0411390.58030.281172
60.2843094.01074.3e-05
7-0.403596-5.69340
80.04810.67850.24911
90.1205251.70020.045326
10-0.341512-4.81761e-06
110.1841072.59710.005051
12-0.178976-2.52480.006179
13-0.32744-4.61913e-06
140.1951272.75260.00323
15-0.021465-0.30280.381176
16-0.21101-2.97670.001638
170.259083.65480.000165
18-0.193101-2.7240.003511
19-0.016088-0.22690.410349
200.2136723.01420.001456
21-0.001436-0.02030.491929
22-0.172999-2.44050.007772
230.261033.68230.000149
24-0.204475-2.88450.002176
250.0774541.09260.137941
260.1904692.68690.003911
27-0.157421-2.22070.01375
28-0.03298-0.46520.321135
290.1506892.12570.017379
30-0.117928-1.66360.048885
310.0115320.16270.43547
320.1695592.39190.008845
33-0.269135-3.79669.7e-05
340.0831111.17240.121215
350.1253491.76830.039275
36-0.28254-3.98574.7e-05
370.1785242.51840.006288
38-0.021042-0.29680.383454
39-0.257369-3.63060.00018
400.3183654.49116e-06
41-0.018839-0.26580.395353
42-0.158969-2.24250.013015
430.2454033.46180.000328
44-0.126029-1.77790.038477
45-0.10907-1.53860.062742
460.3413974.8161e-06
47-0.161064-2.27210.012075
48-0.038847-0.5480.292151

\begin{tabular}{lllllllll}
\hline
Autocorrelation Function \tabularnewline
Time lag k & ACF(k) & T-STAT & P-value \tabularnewline
1 & -0.282923 & -3.9911 & 4.6e-05 \tabularnewline
2 & 0.054881 & 0.7742 & 0.219867 \tabularnewline
3 & 0.29092 & 4.1039 & 3e-05 \tabularnewline
4 & -0.213985 & -3.0186 & 0.001436 \tabularnewline
5 & 0.041139 & 0.5803 & 0.281172 \tabularnewline
6 & 0.284309 & 4.0107 & 4.3e-05 \tabularnewline
7 & -0.403596 & -5.6934 & 0 \tabularnewline
8 & 0.0481 & 0.6785 & 0.24911 \tabularnewline
9 & 0.120525 & 1.7002 & 0.045326 \tabularnewline
10 & -0.341512 & -4.8176 & 1e-06 \tabularnewline
11 & 0.184107 & 2.5971 & 0.005051 \tabularnewline
12 & -0.178976 & -2.5248 & 0.006179 \tabularnewline
13 & -0.32744 & -4.6191 & 3e-06 \tabularnewline
14 & 0.195127 & 2.7526 & 0.00323 \tabularnewline
15 & -0.021465 & -0.3028 & 0.381176 \tabularnewline
16 & -0.21101 & -2.9767 & 0.001638 \tabularnewline
17 & 0.25908 & 3.6548 & 0.000165 \tabularnewline
18 & -0.193101 & -2.724 & 0.003511 \tabularnewline
19 & -0.016088 & -0.2269 & 0.410349 \tabularnewline
20 & 0.213672 & 3.0142 & 0.001456 \tabularnewline
21 & -0.001436 & -0.0203 & 0.491929 \tabularnewline
22 & -0.172999 & -2.4405 & 0.007772 \tabularnewline
23 & 0.26103 & 3.6823 & 0.000149 \tabularnewline
24 & -0.204475 & -2.8845 & 0.002176 \tabularnewline
25 & 0.077454 & 1.0926 & 0.137941 \tabularnewline
26 & 0.190469 & 2.6869 & 0.003911 \tabularnewline
27 & -0.157421 & -2.2207 & 0.01375 \tabularnewline
28 & -0.03298 & -0.4652 & 0.321135 \tabularnewline
29 & 0.150689 & 2.1257 & 0.017379 \tabularnewline
30 & -0.117928 & -1.6636 & 0.048885 \tabularnewline
31 & 0.011532 & 0.1627 & 0.43547 \tabularnewline
32 & 0.169559 & 2.3919 & 0.008845 \tabularnewline
33 & -0.269135 & -3.7966 & 9.7e-05 \tabularnewline
34 & 0.083111 & 1.1724 & 0.121215 \tabularnewline
35 & 0.125349 & 1.7683 & 0.039275 \tabularnewline
36 & -0.28254 & -3.9857 & 4.7e-05 \tabularnewline
37 & 0.178524 & 2.5184 & 0.006288 \tabularnewline
38 & -0.021042 & -0.2968 & 0.383454 \tabularnewline
39 & -0.257369 & -3.6306 & 0.00018 \tabularnewline
40 & 0.318365 & 4.4911 & 6e-06 \tabularnewline
41 & -0.018839 & -0.2658 & 0.395353 \tabularnewline
42 & -0.158969 & -2.2425 & 0.013015 \tabularnewline
43 & 0.245403 & 3.4618 & 0.000328 \tabularnewline
44 & -0.126029 & -1.7779 & 0.038477 \tabularnewline
45 & -0.10907 & -1.5386 & 0.062742 \tabularnewline
46 & 0.341397 & 4.816 & 1e-06 \tabularnewline
47 & -0.161064 & -2.2721 & 0.012075 \tabularnewline
48 & -0.038847 & -0.548 & 0.292151 \tabularnewline
\hline
\end{tabular}
%Source: https://freestatistics.org/blog/index.php?pk=310838&T=1

[TABLE]
[ROW][C]Autocorrelation Function[/C][/ROW]
[ROW][C]Time lag k[/C][C]ACF(k)[/C][C]T-STAT[/C][C]P-value[/C][/ROW]
[ROW][C]1[/C][C]-0.282923[/C][C]-3.9911[/C][C]4.6e-05[/C][/ROW]
[ROW][C]2[/C][C]0.054881[/C][C]0.7742[/C][C]0.219867[/C][/ROW]
[ROW][C]3[/C][C]0.29092[/C][C]4.1039[/C][C]3e-05[/C][/ROW]
[ROW][C]4[/C][C]-0.213985[/C][C]-3.0186[/C][C]0.001436[/C][/ROW]
[ROW][C]5[/C][C]0.041139[/C][C]0.5803[/C][C]0.281172[/C][/ROW]
[ROW][C]6[/C][C]0.284309[/C][C]4.0107[/C][C]4.3e-05[/C][/ROW]
[ROW][C]7[/C][C]-0.403596[/C][C]-5.6934[/C][C]0[/C][/ROW]
[ROW][C]8[/C][C]0.0481[/C][C]0.6785[/C][C]0.24911[/C][/ROW]
[ROW][C]9[/C][C]0.120525[/C][C]1.7002[/C][C]0.045326[/C][/ROW]
[ROW][C]10[/C][C]-0.341512[/C][C]-4.8176[/C][C]1e-06[/C][/ROW]
[ROW][C]11[/C][C]0.184107[/C][C]2.5971[/C][C]0.005051[/C][/ROW]
[ROW][C]12[/C][C]-0.178976[/C][C]-2.5248[/C][C]0.006179[/C][/ROW]
[ROW][C]13[/C][C]-0.32744[/C][C]-4.6191[/C][C]3e-06[/C][/ROW]
[ROW][C]14[/C][C]0.195127[/C][C]2.7526[/C][C]0.00323[/C][/ROW]
[ROW][C]15[/C][C]-0.021465[/C][C]-0.3028[/C][C]0.381176[/C][/ROW]
[ROW][C]16[/C][C]-0.21101[/C][C]-2.9767[/C][C]0.001638[/C][/ROW]
[ROW][C]17[/C][C]0.25908[/C][C]3.6548[/C][C]0.000165[/C][/ROW]
[ROW][C]18[/C][C]-0.193101[/C][C]-2.724[/C][C]0.003511[/C][/ROW]
[ROW][C]19[/C][C]-0.016088[/C][C]-0.2269[/C][C]0.410349[/C][/ROW]
[ROW][C]20[/C][C]0.213672[/C][C]3.0142[/C][C]0.001456[/C][/ROW]
[ROW][C]21[/C][C]-0.001436[/C][C]-0.0203[/C][C]0.491929[/C][/ROW]
[ROW][C]22[/C][C]-0.172999[/C][C]-2.4405[/C][C]0.007772[/C][/ROW]
[ROW][C]23[/C][C]0.26103[/C][C]3.6823[/C][C]0.000149[/C][/ROW]
[ROW][C]24[/C][C]-0.204475[/C][C]-2.8845[/C][C]0.002176[/C][/ROW]
[ROW][C]25[/C][C]0.077454[/C][C]1.0926[/C][C]0.137941[/C][/ROW]
[ROW][C]26[/C][C]0.190469[/C][C]2.6869[/C][C]0.003911[/C][/ROW]
[ROW][C]27[/C][C]-0.157421[/C][C]-2.2207[/C][C]0.01375[/C][/ROW]
[ROW][C]28[/C][C]-0.03298[/C][C]-0.4652[/C][C]0.321135[/C][/ROW]
[ROW][C]29[/C][C]0.150689[/C][C]2.1257[/C][C]0.017379[/C][/ROW]
[ROW][C]30[/C][C]-0.117928[/C][C]-1.6636[/C][C]0.048885[/C][/ROW]
[ROW][C]31[/C][C]0.011532[/C][C]0.1627[/C][C]0.43547[/C][/ROW]
[ROW][C]32[/C][C]0.169559[/C][C]2.3919[/C][C]0.008845[/C][/ROW]
[ROW][C]33[/C][C]-0.269135[/C][C]-3.7966[/C][C]9.7e-05[/C][/ROW]
[ROW][C]34[/C][C]0.083111[/C][C]1.1724[/C][C]0.121215[/C][/ROW]
[ROW][C]35[/C][C]0.125349[/C][C]1.7683[/C][C]0.039275[/C][/ROW]
[ROW][C]36[/C][C]-0.28254[/C][C]-3.9857[/C][C]4.7e-05[/C][/ROW]
[ROW][C]37[/C][C]0.178524[/C][C]2.5184[/C][C]0.006288[/C][/ROW]
[ROW][C]38[/C][C]-0.021042[/C][C]-0.2968[/C][C]0.383454[/C][/ROW]
[ROW][C]39[/C][C]-0.257369[/C][C]-3.6306[/C][C]0.00018[/C][/ROW]
[ROW][C]40[/C][C]0.318365[/C][C]4.4911[/C][C]6e-06[/C][/ROW]
[ROW][C]41[/C][C]-0.018839[/C][C]-0.2658[/C][C]0.395353[/C][/ROW]
[ROW][C]42[/C][C]-0.158969[/C][C]-2.2425[/C][C]0.013015[/C][/ROW]
[ROW][C]43[/C][C]0.245403[/C][C]3.4618[/C][C]0.000328[/C][/ROW]
[ROW][C]44[/C][C]-0.126029[/C][C]-1.7779[/C][C]0.038477[/C][/ROW]
[ROW][C]45[/C][C]-0.10907[/C][C]-1.5386[/C][C]0.062742[/C][/ROW]
[ROW][C]46[/C][C]0.341397[/C][C]4.816[/C][C]1e-06[/C][/ROW]
[ROW][C]47[/C][C]-0.161064[/C][C]-2.2721[/C][C]0.012075[/C][/ROW]
[ROW][C]48[/C][C]-0.038847[/C][C]-0.548[/C][C]0.292151[/C][/ROW]
[/TABLE]
Source: https://freestatistics.org/blog/index.php?pk=310838&T=1

Globally Unique Identifier (entire table): ba.freestatistics.org/blog/index.php?pk=310838&T=1

As an alternative you can also use a QR Code:  

The GUIDs for individual cells are displayed in the table below:

Autocorrelation Function
Time lag kACF(k)T-STATP-value
1-0.282923-3.99114.6e-05
20.0548810.77420.219867
30.290924.10393e-05
4-0.213985-3.01860.001436
50.0411390.58030.281172
60.2843094.01074.3e-05
7-0.403596-5.69340
80.04810.67850.24911
90.1205251.70020.045326
10-0.341512-4.81761e-06
110.1841072.59710.005051
12-0.178976-2.52480.006179
13-0.32744-4.61913e-06
140.1951272.75260.00323
15-0.021465-0.30280.381176
16-0.21101-2.97670.001638
170.259083.65480.000165
18-0.193101-2.7240.003511
19-0.016088-0.22690.410349
200.2136723.01420.001456
21-0.001436-0.02030.491929
22-0.172999-2.44050.007772
230.261033.68230.000149
24-0.204475-2.88450.002176
250.0774541.09260.137941
260.1904692.68690.003911
27-0.157421-2.22070.01375
28-0.03298-0.46520.321135
290.1506892.12570.017379
30-0.117928-1.66360.048885
310.0115320.16270.43547
320.1695592.39190.008845
33-0.269135-3.79669.7e-05
340.0831111.17240.121215
350.1253491.76830.039275
36-0.28254-3.98574.7e-05
370.1785242.51840.006288
38-0.021042-0.29680.383454
39-0.257369-3.63060.00018
400.3183654.49116e-06
41-0.018839-0.26580.395353
42-0.158969-2.24250.013015
430.2454033.46180.000328
44-0.126029-1.77790.038477
45-0.10907-1.53860.062742
460.3413974.8161e-06
47-0.161064-2.27210.012075
48-0.038847-0.5480.292151


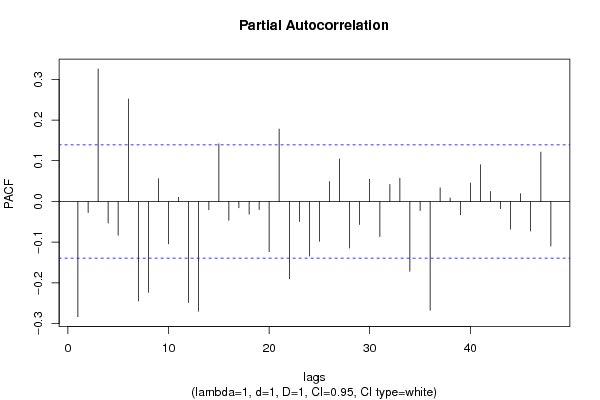
Partial Autocorrelation Function
Time lag kPACF(k)T-STATP-value
1-0.282923-3.99114.6e-05
2-0.027354-0.38590.350002
30.3254044.59044e-06
4-0.053095-0.7490.227373
5-0.083104-1.17230.121235
60.2513963.54640.000243
7-0.244301-3.44630.000347
8-0.222971-3.14540.000956
90.0556770.78540.216569
10-0.104163-1.46940.071651
110.0100450.14170.443727
12-0.248083-3.49960.000287
13-0.269773-3.80569.4e-05
14-0.020517-0.28940.386275
150.1414121.99490.023711
16-0.04638-0.65430.256845
17-0.015607-0.22020.412984
18-0.031131-0.43920.330514
19-0.019633-0.2770.391049
20-0.123321-1.73970.041733
210.1776052.50540.006516
22-0.189736-2.67650.004029
23-0.049232-0.69450.244089
24-0.133973-1.88990.030111
25-0.097709-1.37840.084821
260.0489790.69090.245207
270.1042861.47110.071417
28-0.114201-1.6110.054383
29-0.056526-0.79740.213086
300.0546720.77120.220741
31-0.086134-1.21510.112889
320.0415810.58660.279078
330.0570880.80530.210797
34-0.171598-2.42070.008194
35-0.022074-0.31140.377912
36-0.26731-3.77090.000107
370.0334060.47120.318991
380.0085780.1210.451903
39-0.032663-0.46080.322735
400.0450990.63620.262687
410.0902481.27310.102233
420.024440.34480.365314
43-0.017611-0.24840.402025
44-0.06796-0.95870.16944
450.0187930.26510.395601
46-0.072472-1.02230.153931
470.1211031.70840.044563
48-0.109576-1.54580.061875

\begin{tabular}{lllllllll}
\hline
Partial Autocorrelation Function \tabularnewline
Time lag k & PACF(k) & T-STAT & P-value \tabularnewline
1 & -0.282923 & -3.9911 & 4.6e-05 \tabularnewline
2 & -0.027354 & -0.3859 & 0.350002 \tabularnewline
3 & 0.325404 & 4.5904 & 4e-06 \tabularnewline
4 & -0.053095 & -0.749 & 0.227373 \tabularnewline
5 & -0.083104 & -1.1723 & 0.121235 \tabularnewline
6 & 0.251396 & 3.5464 & 0.000243 \tabularnewline
7 & -0.244301 & -3.4463 & 0.000347 \tabularnewline
8 & -0.222971 & -3.1454 & 0.000956 \tabularnewline
9 & 0.055677 & 0.7854 & 0.216569 \tabularnewline
10 & -0.104163 & -1.4694 & 0.071651 \tabularnewline
11 & 0.010045 & 0.1417 & 0.443727 \tabularnewline
12 & -0.248083 & -3.4996 & 0.000287 \tabularnewline
13 & -0.269773 & -3.8056 & 9.4e-05 \tabularnewline
14 & -0.020517 & -0.2894 & 0.386275 \tabularnewline
15 & 0.141412 & 1.9949 & 0.023711 \tabularnewline
16 & -0.04638 & -0.6543 & 0.256845 \tabularnewline
17 & -0.015607 & -0.2202 & 0.412984 \tabularnewline
18 & -0.031131 & -0.4392 & 0.330514 \tabularnewline
19 & -0.019633 & -0.277 & 0.391049 \tabularnewline
20 & -0.123321 & -1.7397 & 0.041733 \tabularnewline
21 & 0.177605 & 2.5054 & 0.006516 \tabularnewline
22 & -0.189736 & -2.6765 & 0.004029 \tabularnewline
23 & -0.049232 & -0.6945 & 0.244089 \tabularnewline
24 & -0.133973 & -1.8899 & 0.030111 \tabularnewline
25 & -0.097709 & -1.3784 & 0.084821 \tabularnewline
26 & 0.048979 & 0.6909 & 0.245207 \tabularnewline
27 & 0.104286 & 1.4711 & 0.071417 \tabularnewline
28 & -0.114201 & -1.611 & 0.054383 \tabularnewline
29 & -0.056526 & -0.7974 & 0.213086 \tabularnewline
30 & 0.054672 & 0.7712 & 0.220741 \tabularnewline
31 & -0.086134 & -1.2151 & 0.112889 \tabularnewline
32 & 0.041581 & 0.5866 & 0.279078 \tabularnewline
33 & 0.057088 & 0.8053 & 0.210797 \tabularnewline
34 & -0.171598 & -2.4207 & 0.008194 \tabularnewline
35 & -0.022074 & -0.3114 & 0.377912 \tabularnewline
36 & -0.26731 & -3.7709 & 0.000107 \tabularnewline
37 & 0.033406 & 0.4712 & 0.318991 \tabularnewline
38 & 0.008578 & 0.121 & 0.451903 \tabularnewline
39 & -0.032663 & -0.4608 & 0.322735 \tabularnewline
40 & 0.045099 & 0.6362 & 0.262687 \tabularnewline
41 & 0.090248 & 1.2731 & 0.102233 \tabularnewline
42 & 0.02444 & 0.3448 & 0.365314 \tabularnewline
43 & -0.017611 & -0.2484 & 0.402025 \tabularnewline
44 & -0.06796 & -0.9587 & 0.16944 \tabularnewline
45 & 0.018793 & 0.2651 & 0.395601 \tabularnewline
46 & -0.072472 & -1.0223 & 0.153931 \tabularnewline
47 & 0.121103 & 1.7084 & 0.044563 \tabularnewline
48 & -0.109576 & -1.5458 & 0.061875 \tabularnewline
\hline
\end{tabular}
%Source: https://freestatistics.org/blog/index.php?pk=310838&T=2

[TABLE]
[ROW][C]Partial Autocorrelation Function[/C][/ROW]
[ROW][C]Time lag k[/C][C]PACF(k)[/C][C]T-STAT[/C][C]P-value[/C][/ROW]
[ROW][C]1[/C][C]-0.282923[/C][C]-3.9911[/C][C]4.6e-05[/C][/ROW]
[ROW][C]2[/C][C]-0.027354[/C][C]-0.3859[/C][C]0.350002[/C][/ROW]
[ROW][C]3[/C][C]0.325404[/C][C]4.5904[/C][C]4e-06[/C][/ROW]
[ROW][C]4[/C][C]-0.053095[/C][C]-0.749[/C][C]0.227373[/C][/ROW]
[ROW][C]5[/C][C]-0.083104[/C][C]-1.1723[/C][C]0.121235[/C][/ROW]
[ROW][C]6[/C][C]0.251396[/C][C]3.5464[/C][C]0.000243[/C][/ROW]
[ROW][C]7[/C][C]-0.244301[/C][C]-3.4463[/C][C]0.000347[/C][/ROW]
[ROW][C]8[/C][C]-0.222971[/C][C]-3.1454[/C][C]0.000956[/C][/ROW]
[ROW][C]9[/C][C]0.055677[/C][C]0.7854[/C][C]0.216569[/C][/ROW]
[ROW][C]10[/C][C]-0.104163[/C][C]-1.4694[/C][C]0.071651[/C][/ROW]
[ROW][C]11[/C][C]0.010045[/C][C]0.1417[/C][C]0.443727[/C][/ROW]
[ROW][C]12[/C][C]-0.248083[/C][C]-3.4996[/C][C]0.000287[/C][/ROW]
[ROW][C]13[/C][C]-0.269773[/C][C]-3.8056[/C][C]9.4e-05[/C][/ROW]
[ROW][C]14[/C][C]-0.020517[/C][C]-0.2894[/C][C]0.386275[/C][/ROW]
[ROW][C]15[/C][C]0.141412[/C][C]1.9949[/C][C]0.023711[/C][/ROW]
[ROW][C]16[/C][C]-0.04638[/C][C]-0.6543[/C][C]0.256845[/C][/ROW]
[ROW][C]17[/C][C]-0.015607[/C][C]-0.2202[/C][C]0.412984[/C][/ROW]
[ROW][C]18[/C][C]-0.031131[/C][C]-0.4392[/C][C]0.330514[/C][/ROW]
[ROW][C]19[/C][C]-0.019633[/C][C]-0.277[/C][C]0.391049[/C][/ROW]
[ROW][C]20[/C][C]-0.123321[/C][C]-1.7397[/C][C]0.041733[/C][/ROW]
[ROW][C]21[/C][C]0.177605[/C][C]2.5054[/C][C]0.006516[/C][/ROW]
[ROW][C]22[/C][C]-0.189736[/C][C]-2.6765[/C][C]0.004029[/C][/ROW]
[ROW][C]23[/C][C]-0.049232[/C][C]-0.6945[/C][C]0.244089[/C][/ROW]
[ROW][C]24[/C][C]-0.133973[/C][C]-1.8899[/C][C]0.030111[/C][/ROW]
[ROW][C]25[/C][C]-0.097709[/C][C]-1.3784[/C][C]0.084821[/C][/ROW]
[ROW][C]26[/C][C]0.048979[/C][C]0.6909[/C][C]0.245207[/C][/ROW]
[ROW][C]27[/C][C]0.104286[/C][C]1.4711[/C][C]0.071417[/C][/ROW]
[ROW][C]28[/C][C]-0.114201[/C][C]-1.611[/C][C]0.054383[/C][/ROW]
[ROW][C]29[/C][C]-0.056526[/C][C]-0.7974[/C][C]0.213086[/C][/ROW]
[ROW][C]30[/C][C]0.054672[/C][C]0.7712[/C][C]0.220741[/C][/ROW]
[ROW][C]31[/C][C]-0.086134[/C][C]-1.2151[/C][C]0.112889[/C][/ROW]
[ROW][C]32[/C][C]0.041581[/C][C]0.5866[/C][C]0.279078[/C][/ROW]
[ROW][C]33[/C][C]0.057088[/C][C]0.8053[/C][C]0.210797[/C][/ROW]
[ROW][C]34[/C][C]-0.171598[/C][C]-2.4207[/C][C]0.008194[/C][/ROW]
[ROW][C]35[/C][C]-0.022074[/C][C]-0.3114[/C][C]0.377912[/C][/ROW]
[ROW][C]36[/C][C]-0.26731[/C][C]-3.7709[/C][C]0.000107[/C][/ROW]
[ROW][C]37[/C][C]0.033406[/C][C]0.4712[/C][C]0.318991[/C][/ROW]
[ROW][C]38[/C][C]0.008578[/C][C]0.121[/C][C]0.451903[/C][/ROW]
[ROW][C]39[/C][C]-0.032663[/C][C]-0.4608[/C][C]0.322735[/C][/ROW]
[ROW][C]40[/C][C]0.045099[/C][C]0.6362[/C][C]0.262687[/C][/ROW]
[ROW][C]41[/C][C]0.090248[/C][C]1.2731[/C][C]0.102233[/C][/ROW]
[ROW][C]42[/C][C]0.02444[/C][C]0.3448[/C][C]0.365314[/C][/ROW]
[ROW][C]43[/C][C]-0.017611[/C][C]-0.2484[/C][C]0.402025[/C][/ROW]
[ROW][C]44[/C][C]-0.06796[/C][C]-0.9587[/C][C]0.16944[/C][/ROW]
[ROW][C]45[/C][C]0.018793[/C][C]0.2651[/C][C]0.395601[/C][/ROW]
[ROW][C]46[/C][C]-0.072472[/C][C]-1.0223[/C][C]0.153931[/C][/ROW]
[ROW][C]47[/C][C]0.121103[/C][C]1.7084[/C][C]0.044563[/C][/ROW]
[ROW][C]48[/C][C]-0.109576[/C][C]-1.5458[/C][C]0.061875[/C][/ROW]
[/TABLE]
Source: https://freestatistics.org/blog/index.php?pk=310838&T=2

Globally Unique Identifier (entire table): ba.freestatistics.org/blog/index.php?pk=310838&T=2

As an alternative you can also use a QR Code:  

The GUIDs for individual cells are displayed in the table below:

Partial Autocorrelation Function
Time lag kPACF(k)T-STATP-value
1-0.282923-3.99114.6e-05
2-0.027354-0.38590.350002
30.3254044.59044e-06
4-0.053095-0.7490.227373
5-0.083104-1.17230.121235
60.2513963.54640.000243
7-0.244301-3.44630.000347
8-0.222971-3.14540.000956
90.0556770.78540.216569
10-0.104163-1.46940.071651
110.0100450.14170.443727
12-0.248083-3.49960.000287
13-0.269773-3.80569.4e-05
14-0.020517-0.28940.386275
150.1414121.99490.023711
16-0.04638-0.65430.256845
17-0.015607-0.22020.412984
18-0.031131-0.43920.330514
19-0.019633-0.2770.391049
20-0.123321-1.73970.041733
210.1776052.50540.006516
22-0.189736-2.67650.004029
23-0.049232-0.69450.244089
24-0.133973-1.88990.030111
25-0.097709-1.37840.084821
260.0489790.69090.245207
270.1042861.47110.071417
28-0.114201-1.6110.054383
29-0.056526-0.79740.213086
300.0546720.77120.220741
31-0.086134-1.21510.112889
320.0415810.58660.279078
330.0570880.80530.210797
34-0.171598-2.42070.008194
35-0.022074-0.31140.377912
36-0.26731-3.77090.000107
370.0334060.47120.318991
380.0085780.1210.451903
39-0.032663-0.46080.322735
400.0450990.63620.262687
410.0902481.27310.102233
420.024440.34480.365314
43-0.017611-0.24840.402025
44-0.06796-0.95870.16944
450.0187930.26510.395601
46-0.072472-1.02230.153931
470.1211031.70840.044563
48-0.109576-1.54580.061875


Parameters (Session):
Parameters (R input):
par1 = 48 ; par2 = 1 ; par3 = 1 ; par4 = 1 ; par5 = 12 ; par6 = White Noise ; par7 = 0.95 ; par8 = ;
R code (references can be found in the software module):
if (par1 == 'Default') {
par1 = 10*log10(length(x))
} else {
par1 <- as.numeric(par1)
}
par2 <- as.numeric(par2)
par3 <- as.numeric(par3)
par4 <- as.numeric(par4)
par5 <- as.numeric(par5)
if (par6 == 'White Noise') par6 <- 'white' else par6 <- 'ma'
par7 <- as.numeric(par7)
if (par8 != '') par8 <- as.numeric(par8)
x <- na.omit(x)
ox <- x
if (par8 == '') {
if (par2 == 0) {
x <- log(x)
} else {
x <- (x ^ par2 - 1) / par2
}
} else {
x <- log(x,base=par8)
}
if (par3 > 0) x <- diff(x,lag=1,difference=par3)
if (par4 > 0) x <- diff(x,lag=par5,difference=par4)
bitmap(file='picts.png')
op <- par(mfrow=c(2,1))
plot(ox,type='l',main='Original Time Series',xlab='time',ylab='value')
if (par8=='') {
mytitle <- paste('Working Time Series (lambda=',par2,', d=',par3,', D=',par4,')',sep='')
mysub <- paste('(lambda=',par2,', d=',par3,', D=',par4,', CI=', par7, ', CI type=',par6,')',sep='')
} else {
mytitle <- paste('Working Time Series (base=',par8,', d=',par3,', D=',par4,')',sep='')
mysub <- paste('(base=',par8,', d=',par3,', D=',par4,', CI=', par7, ', CI type=',par6,')',sep='')
}
plot(x,type='l', main=mytitle,xlab='time',ylab='value')
par(op)
dev.off()
bitmap(file='pic1.png')
racf <- acf(x, par1, main='Autocorrelation', xlab='time lag', ylab='ACF', ci.type=par6, ci=par7, sub=mysub)
dev.off()
bitmap(file='pic2.png')
rpacf <- pacf(x,par1,main='Partial Autocorrelation',xlab='lags',ylab='PACF',sub=mysub)
dev.off()
(myacf <- c(racf$acf))
(mypacf <- c(rpacf$acf))
lengthx <- length(x)
sqrtn <- sqrt(lengthx)
load(file='createtable')
a<-table.start()
a<-table.row.start(a)
a<-table.element(a,'Autocorrelation Function',4,TRUE)
a<-table.row.end(a)
a<-table.row.start(a)
a<-table.element(a,'Time lag k',header=TRUE)
a<-table.element(a,'ACF(k)',header=TRUE)
a<-table.element(a,'T-STAT',header=TRUE)
a<-table.element(a,'P-value',header=TRUE)
a<-table.row.end(a)
for (i in 2:(par1+1)) {
a<-table.row.start(a)
a<-table.element(a,i-1,header=TRUE)
a<-table.element(a,round(myacf[i],6))
mytstat <- myacf[i]*sqrtn
a<-table.element(a,round(mytstat,4))
a<-table.element(a,round(1-pt(abs(mytstat),lengthx),6))
a<-table.row.end(a)
}
a<-table.end(a)
table.save(a,file='mytable.tab')
a<-table.start()
a<-table.row.start(a)
a<-table.element(a,'Partial Autocorrelation Function',4,TRUE)
a<-table.row.end(a)
a<-table.row.start(a)
a<-table.element(a,'Time lag k',header=TRUE)
a<-table.element(a,'PACF(k)',header=TRUE)
a<-table.element(a,'T-STAT',header=TRUE)
a<-table.element(a,'P-value',header=TRUE)
a<-table.row.end(a)
for (i in 1:par1) {
a<-table.row.start(a)
a<-table.element(a,i,header=TRUE)
a<-table.element(a,round(mypacf[i],6))
mytstat <- mypacf[i]*sqrtn
a<-table.element(a,round(mytstat,4))
a<-table.element(a,round(1-pt(abs(mytstat),lengthx),6))
a<-table.row.end(a)
}
a<-table.end(a)
table.save(a,file='mytable1.tab')