Free Statistics
of Irreproducible Research!
Description of Statistical Computation | ||||||||||||||||||||||||||||||
|---|---|---|---|---|---|---|---|---|---|---|---|---|---|---|---|---|---|---|---|---|---|---|---|---|---|---|---|---|---|---|
| Author's title | ||||||||||||||||||||||||||||||
| Author | *The author of this computation has been verified* | |||||||||||||||||||||||||||||
| R Software Module | rwasp_skewness_kurtosis_plot.wasp | |||||||||||||||||||||||||||||
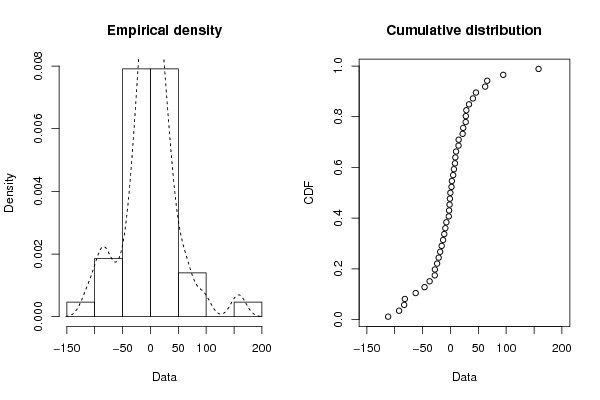
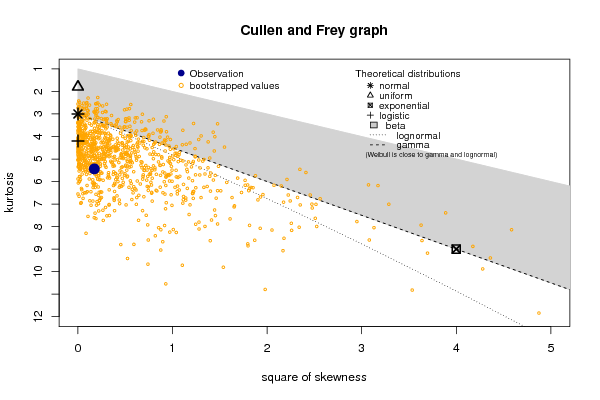
| Title produced by software | Skewness-Kurtosis Plot | |||||||||||||||||||||||||||||
| Date of computation | Fri, 22 Dec 2017 11:35:37 +0100 | |||||||||||||||||||||||||||||
| Cite this page as follows | Statistical Computations at FreeStatistics.org, Office for Research Development and Education, URL https://freestatistics.org/blog/index.php?v=date/2017/Dec/22/t1513938947k3fb2sameolbwy5.htm/, Retrieved Wed, 15 May 2024 06:43:43 +0000 | |||||||||||||||||||||||||||||
| Statistical Computations at FreeStatistics.org, Office for Research Development and Education, URL https://freestatistics.org/blog/index.php?pk=310756, Retrieved Wed, 15 May 2024 06:43:43 +0000 | ||||||||||||||||||||||||||||||
| QR Codes: | ||||||||||||||||||||||||||||||
|
| ||||||||||||||||||||||||||||||
| Original text written by user: | ||||||||||||||||||||||||||||||
| IsPrivate? | No (this computation is public) | |||||||||||||||||||||||||||||
| User-defined keywords | ||||||||||||||||||||||||||||||
| Estimated Impact | 103 | |||||||||||||||||||||||||||||
Tree of Dependent Computations | ||||||||||||||||||||||||||||||
| Family? (F = Feedback message, R = changed R code, M = changed R Module, P = changed Parameters, D = changed Data) | ||||||||||||||||||||||||||||||
| - [Skewness-Kurtosis Plot] [] [2017-12-22 10:35:37] [3c3f1142cbd5b1dfc6913e0ceac18617] [Current] | ||||||||||||||||||||||||||||||
| Feedback Forum | ||||||||||||||||||||||||||||||
Post a new message | ||||||||||||||||||||||||||||||
Dataset | ||||||||||||||||||||||||||||||
| Dataseries X: | ||||||||||||||||||||||||||||||
40.3105545108661 8.10478535408506 62.2503721293991 158.036910121033 -2.49986679998888 33.2600568075623 27.3235484874008 8.68853346264306 45.7331799191883 10.0525837130546 -37.3628654083609 6.20087121786452 65.9259138038709 -81.7789562763358 -92.1746513234155 -7.3521894364565 -3.01877472532556 22.8226043319919 94.6570627859797 -23.9189643709936 -0.975114574761247 -1.60315807765155 -0.199810298582729 14.6918179816508 -11.1259577405637 1.83408740733631 -83.0279808614524 27.5706497352354 -46.4717641214987 4.86400033824224 28.4467647334344 2.53558598497492 -111.822423621151 -62.3368420333084 21.7788273525226 -9.2252820777914 -18.4913448414827 -15.7287308915736 -28.127870554047 -27.9643699724303 -21.0956652638027 -13.2575934812382 14.4714665738766 | ||||||||||||||||||||||||||||||
Tables (Output of Computation) | ||||||||||||||||||||||||||||||
| ||||||||||||||||||||||||||||||
Figures (Output of Computation) | ||||||||||||||||||||||||||||||
Input Parameters & R Code | ||||||||||||||||||||||||||||||
| Parameters (Session): | ||||||||||||||||||||||||||||||
| par1 = 8 ; par2 = Do not include Seasonal Dummies ; par3 = No Linear Trend ; par4 = 0 ; par5 = 0 ; par6 = 12 ; | ||||||||||||||||||||||||||||||
| Parameters (R input): | ||||||||||||||||||||||||||||||
| R code (references can be found in the software module): | ||||||||||||||||||||||||||||||
library(fitdistrplus) | ||||||||||||||||||||||||||||||