Free Statistics

of Irreproducible Research!

Author's title

Author*The author of this computation has been verified*
R Software Modulerwasp_pairs.wasp
Title produced by softwareKendall tau Correlation Matrix
Date of computationFri, 22 Dec 2017 09:27:51 +0100
Cite this page as followsStatistical Computations at FreeStatistics.org, Office for Research Development and Education, URL https://freestatistics.org/blog/index.php?v=date/2017/Dec/22/t15139313330brvj3r65mtwh9e.htm/, Retrieved Wed, 15 May 2024 08:28:36 +0000
Statistical Computations at FreeStatistics.org, Office for Research Development and Education, URL https://freestatistics.org/blog/index.php?pk=310748, Retrieved Wed, 15 May 2024 08:28:36 +0000
QR Codes:

Original text written by user:
IsPrivate?No (this computation is public)
User-defined keywords
Estimated Impact120
Family? (F = Feedback message, R = changed R code, M = changed R Module, P = changed Parameters, D = changed Data)
-       [Kendall tau Correlation Matrix] [Paper] [2017-12-22 08:27:51] [2fb711e06e7eb81d34c9e51edb934d8a] [Current]
Feedback Forum

Post a new message
Dataseries X:
57000	27000	144
40200	18750	36
21450	12000	381
21900	13200	190
45000	21000	138
32100	13500	67
36000	18750	114
21900	9750	0
27900	12750	115
24000	13500	244
30300	16500	143
28350	12000	26
27750	14250	34
35100	16800	137
27300	13500	66
40800	15000	24
46000	14250	48
103750	27510	70
42300	14250	103
26250	11550	48
38850	15000	17
21750	12750	315
24000	11100	75
16950	9000	124
21150	9000	171
31050	12600	14
60375	27480	96
32550	14250	43
135000	79980	199
31200	14250	54
36150	14250	83
110625	45000	120
42000	15000	68
92000	39990	175
81250	30000	18
31350	11250	52
29100	13500	113
31350	15000	49
36000	15000	46
19200	9000	23
23550	11550	52
35100	16500	90
23250	14250	46
29250	14250	50
30750	13500	307
22350	12750	165
30000	16500	228
30750	14100	240
34800	16500	93
60000	23730	59
35550	15000	48
45150	15000	40
73750	26250	56
25050	13500	444
27000	15000	120
26850	13500	5
33900	15750	78
26400	13500	3
28050	14250	36
30900	15000	102
22500	9750	36
48000	21750	22
55000	26250	32
53125	21000	48
21900	14550	41
78125	30000	7
46000	21240	35
45250	21480	36
56550	25000	34
41100	20250	27
82500	34980	207
54000	18000	11
26400	10500	0
33900	19500	192
24150	11550	0
29250	11550	11
27600	11400	6
22950	10500	10
34800	14550	8
51000	18000	22
24300	10950	5
24750	14250	193
22950	11250	0
25050	10950	8
25950	17100	42
31650	15750	64
24150	14100	130
72500	28740	10
68750	27480	8
16200	9750	0
20100	11250	24
24000	10950	6
25950	10950	0
24600	10050	44
28500	10500	6
30750	15000	432
40200	19500	168
30000	15000	144
22050	10950	5
78250	27480	47
60625	22500	44
39900	15750	59
97000	35010	68
27450	15750	48
31650	13500	18
91250	29490	23
25200	14400	83
21000	11550	108
30450	15000	49
28350	18000	151
30750	9000	314
30750	15000	240
54875	27480	68
37800	16500	60
33450	14100	85
30300	16500	16
31500	18750	205
31650	14250	48
25200	14100	55


Summary of computational transaction
Raw Input view raw input (R code)
Raw Outputview raw output of R engine
Computing time1 seconds
R ServerBig Analytics Cloud Computing Center

\begin{tabular}{lllllllll}
\hline
Summary of computational transaction \tabularnewline
Raw Input view raw input (R code)  \tabularnewline
Raw Outputview raw output of R engine  \tabularnewline
Computing time1 seconds \tabularnewline
R ServerBig Analytics Cloud Computing Center \tabularnewline
\hline
\end{tabular}
%Source: https://freestatistics.org/blog/index.php?pk=310748&T=0

[TABLE]
[ROW]
Summary of computational transaction[/C][/ROW] [ROW]Raw Input[/C] view raw input (R code) [/C][/ROW] [ROW]Raw Output[/C]view raw output of R engine [/C][/ROW] [ROW]Computing time[/C]1 seconds[/C][/ROW] [ROW]R Server[/C]Big Analytics Cloud Computing Center[/C][/ROW] [/TABLE] Source: https://freestatistics.org/blog/index.php?pk=310748&T=0

Globally Unique Identifier (entire table): ba.freestatistics.org/blog/index.php?pk=310748&T=0

As an alternative you can also use a QR Code:  

The GUIDs for individual cells are displayed in the table below:

Summary of computational transaction
Raw Input view raw input (R code)
Raw Outputview raw output of R engine
Computing time1 seconds
R ServerBig Analytics Cloud Computing Center


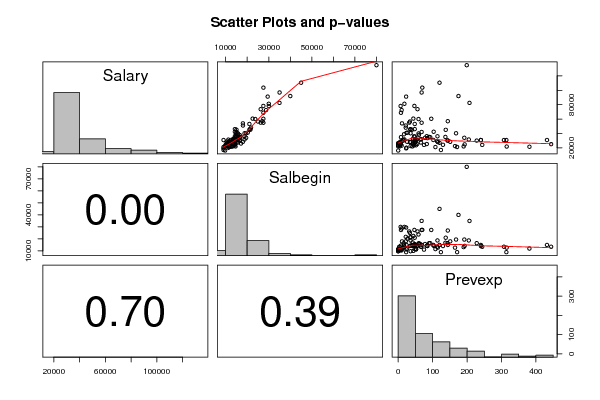
Correlations for all pairs of data series (method=pearson)
SalarySalbeginPrevexp
Salary10.912-0.035
Salbegin0.91210.079
Prevexp-0.0350.0791

\begin{tabular}{lllllllll}
\hline
Correlations for all pairs of data series (method=pearson) \tabularnewline
  & Salary & Salbegin & Prevexp \tabularnewline
Salary & 1 & 0.912 & -0.035 \tabularnewline
Salbegin & 0.912 & 1 & 0.079 \tabularnewline
Prevexp & -0.035 & 0.079 & 1 \tabularnewline
\hline
\end{tabular}
%Source: https://freestatistics.org/blog/index.php?pk=310748&T=1

[TABLE]
[ROW][C]Correlations for all pairs of data series (method=pearson)[/C][/ROW]
[ROW][C] [/C][C]Salary[/C][C]Salbegin[/C][C]Prevexp[/C][/ROW]
[ROW][C]Salary[/C][C]1[/C][C]0.912[/C][C]-0.035[/C][/ROW]
[ROW][C]Salbegin[/C][C]0.912[/C][C]1[/C][C]0.079[/C][/ROW]
[ROW][C]Prevexp[/C][C]-0.035[/C][C]0.079[/C][C]1[/C][/ROW]
[/TABLE]
Source: https://freestatistics.org/blog/index.php?pk=310748&T=1

Globally Unique Identifier (entire table): ba.freestatistics.org/blog/index.php?pk=310748&T=1

As an alternative you can also use a QR Code:  

The GUIDs for individual cells are displayed in the table below:

Correlations for all pairs of data series (method=pearson)
SalarySalbeginPrevexp
Salary10.912-0.035
Salbegin0.91210.079
Prevexp-0.0350.0791


Correlations for all pairs of data series with p-values
pairPearson rSpearman rhoKendall tau
Salary;Salbegin0.91230.85160.6898
p-value(0)(0)(0)
Salary;Prevexp-0.03530.04690.0278
p-value(0.7028)(0.6124)(0.6558)
Salbegin;Prevexp0.07910.19090.1228
p-value(0.3927)(0.0376)(0.0524)

\begin{tabular}{lllllllll}
\hline
Correlations for all pairs of data series with p-values \tabularnewline
pair & Pearson r & Spearman rho & Kendall tau \tabularnewline
Salary;Salbegin & 0.9123 & 0.8516 & 0.6898 \tabularnewline
p-value & (0) & (0) & (0) \tabularnewline
Salary;Prevexp & -0.0353 & 0.0469 & 0.0278 \tabularnewline
p-value & (0.7028) & (0.6124) & (0.6558) \tabularnewline
Salbegin;Prevexp & 0.0791 & 0.1909 & 0.1228 \tabularnewline
p-value & (0.3927) & (0.0376) & (0.0524) \tabularnewline
\hline
\end{tabular}
%Source: https://freestatistics.org/blog/index.php?pk=310748&T=2

[TABLE]
[ROW][C]Correlations for all pairs of data series with p-values[/C][/ROW]
[ROW][C]pair[/C][C]Pearson r[/C][C]Spearman rho[/C][C]Kendall tau[/C][/ROW]
[ROW][C]Salary;Salbegin[/C][C]0.9123[/C][C]0.8516[/C][C]0.6898[/C][/ROW]
[ROW][C]p-value[/C][C](0)[/C][C](0)[/C][C](0)[/C][/ROW]
[ROW][C]Salary;Prevexp[/C][C]-0.0353[/C][C]0.0469[/C][C]0.0278[/C][/ROW]
[ROW][C]p-value[/C][C](0.7028)[/C][C](0.6124)[/C][C](0.6558)[/C][/ROW]
[ROW][C]Salbegin;Prevexp[/C][C]0.0791[/C][C]0.1909[/C][C]0.1228[/C][/ROW]
[ROW][C]p-value[/C][C](0.3927)[/C][C](0.0376)[/C][C](0.0524)[/C][/ROW]
[/TABLE]
Source: https://freestatistics.org/blog/index.php?pk=310748&T=2

Globally Unique Identifier (entire table): ba.freestatistics.org/blog/index.php?pk=310748&T=2

As an alternative you can also use a QR Code:  

The GUIDs for individual cells are displayed in the table below:

Correlations for all pairs of data series with p-values
pairPearson rSpearman rhoKendall tau
Salary;Salbegin0.91230.85160.6898
p-value(0)(0)(0)
Salary;Prevexp-0.03530.04690.0278
p-value(0.7028)(0.6124)(0.6558)
Salbegin;Prevexp0.07910.19090.1228
p-value(0.3927)(0.0376)(0.0524)


Meta Analysis of Correlation Tests
Number of significant by total number of Correlations
Type I errorPearson rSpearman rhoKendall tau
0.010.330.330.33
0.020.330.330.33
0.030.330.330.33
0.040.330.670.33
0.050.330.670.33
0.060.330.670.67
0.070.330.670.67
0.080.330.670.67
0.090.330.670.67
0.10.330.670.67

\begin{tabular}{lllllllll}
\hline
Meta Analysis of Correlation Tests \tabularnewline
Number of significant by total number of Correlations \tabularnewline
Type I error & Pearson r & Spearman rho & Kendall tau \tabularnewline
0.01 & 0.33 & 0.33 & 0.33 \tabularnewline
0.02 & 0.33 & 0.33 & 0.33 \tabularnewline
0.03 & 0.33 & 0.33 & 0.33 \tabularnewline
0.04 & 0.33 & 0.67 & 0.33 \tabularnewline
0.05 & 0.33 & 0.67 & 0.33 \tabularnewline
0.06 & 0.33 & 0.67 & 0.67 \tabularnewline
0.07 & 0.33 & 0.67 & 0.67 \tabularnewline
0.08 & 0.33 & 0.67 & 0.67 \tabularnewline
0.09 & 0.33 & 0.67 & 0.67 \tabularnewline
0.1 & 0.33 & 0.67 & 0.67 \tabularnewline
\hline
\end{tabular}
%Source: https://freestatistics.org/blog/index.php?pk=310748&T=3

[TABLE]
[ROW][C]Meta Analysis of Correlation Tests[/C][/ROW]
[ROW][C]Number of significant by total number of Correlations[/C][/ROW]
[ROW][C]Type I error[/C][C]Pearson r[/C][C]Spearman rho[/C][C]Kendall tau[/C][/ROW]
[ROW][C]0.01[/C][C]0.33[/C][C]0.33[/C][C]0.33[/C][/ROW]
[ROW][C]0.02[/C][C]0.33[/C][C]0.33[/C][C]0.33[/C][/ROW]
[ROW][C]0.03[/C][C]0.33[/C][C]0.33[/C][C]0.33[/C][/ROW]
[ROW][C]0.04[/C][C]0.33[/C][C]0.67[/C][C]0.33[/C][/ROW]
[ROW][C]0.05[/C][C]0.33[/C][C]0.67[/C][C]0.33[/C][/ROW]
[ROW][C]0.06[/C][C]0.33[/C][C]0.67[/C][C]0.67[/C][/ROW]
[ROW][C]0.07[/C][C]0.33[/C][C]0.67[/C][C]0.67[/C][/ROW]
[ROW][C]0.08[/C][C]0.33[/C][C]0.67[/C][C]0.67[/C][/ROW]
[ROW][C]0.09[/C][C]0.33[/C][C]0.67[/C][C]0.67[/C][/ROW]
[ROW][C]0.1[/C][C]0.33[/C][C]0.67[/C][C]0.67[/C][/ROW]
[/TABLE]
Source: https://freestatistics.org/blog/index.php?pk=310748&T=3

Globally Unique Identifier (entire table): ba.freestatistics.org/blog/index.php?pk=310748&T=3

As an alternative you can also use a QR Code:  

The GUIDs for individual cells are displayed in the table below:

Meta Analysis of Correlation Tests
Number of significant by total number of Correlations
Type I errorPearson rSpearman rhoKendall tau
0.010.330.330.33
0.020.330.330.33
0.030.330.330.33
0.040.330.670.33
0.050.330.670.33
0.060.330.670.67
0.070.330.670.67
0.080.330.670.67
0.090.330.670.67
0.10.330.670.67


Parameters (Session):
par1 = pearson ;
Parameters (R input):
par1 = pearson ;
R code (references can be found in the software module):
par1 <- 'pearson'
panel.tau <- function(x, y, digits=2, prefix='', cex.cor)
{
usr <- par('usr'); on.exit(par(usr))
par(usr = c(0, 1, 0, 1))
rr <- cor.test(x, y, method=par1)
r <- round(rr$p.value,2)
txt <- format(c(r, 0.123456789), digits=digits)[1]
txt <- paste(prefix, txt, sep='')
if(missing(cex.cor)) cex <- 0.5/strwidth(txt)
text(0.5, 0.5, txt, cex = cex)
}
panel.hist <- function(x, ...)
{
usr <- par('usr'); on.exit(par(usr))
par(usr = c(usr[1:2], 0, 1.5) )
h <- hist(x, plot = FALSE)
breaks <- h$breaks; nB <- length(breaks)
y <- h$counts; y <- y/max(y)
rect(breaks[-nB], 0, breaks[-1], y, col='grey', ...)
}
x <- na.omit(x)
y <- t(na.omit(t(y)))
bitmap(file='test1.png')
pairs(t(y),diag.panel=panel.hist, upper.panel=panel.smooth, lower.panel=panel.tau, main=main)
dev.off()
load(file='createtable')
n <- length(y[,1])
print(n)
a<-table.start()
a<-table.row.start(a)
a<-table.element(a,paste('Correlations for all pairs of data series (method=',par1,')',sep=''),n+1,TRUE)
a<-table.row.end(a)
a<-table.row.start(a)
a<-table.element(a,' ',header=TRUE)
for (i in 1:n) {
a<-table.element(a,dimnames(t(x))[[2]][i],header=TRUE)
}
a<-table.row.end(a)
for (i in 1:n) {
a<-table.row.start(a)
a<-table.element(a,dimnames(t(x))[[2]][i],header=TRUE)
for (j in 1:n) {
r <- cor.test(y[i,],y[j,],method=par1)
a<-table.element(a,round(r$estimate,3))
}
a<-table.row.end(a)
}
a<-table.end(a)
table.save(a,file='mytable.tab')
ncorrs <- (n*n -n)/2
mycorrs <- array(0, dim=c(10,3))
a<-table.start()
a<-table.row.start(a)
a<-table.element(a,'Correlations for all pairs of data series with p-values',4,TRUE)
a<-table.row.end(a)
a<-table.row.start(a)
a<-table.element(a,'pair',1,TRUE)
a<-table.element(a,'Pearson r',1,TRUE)
a<-table.element(a,'Spearman rho',1,TRUE)
a<-table.element(a,'Kendall tau',1,TRUE)
a<-table.row.end(a)
cor.test(y[1,],y[2,],method=par1)
for (i in 1:(n-1))
{
for (j in (i+1):n)
{
a<-table.row.start(a)
dum <- paste(dimnames(t(x))[[2]][i],';',dimnames(t(x))[[2]][j],sep='')
a<-table.element(a,dum,header=TRUE)
rp <- cor.test(y[i,],y[j,],method='pearson')
a<-table.element(a,round(rp$estimate,4))
rs <- cor.test(y[i,],y[j,],method='spearman')
a<-table.element(a,round(rs$estimate,4))
rk <- cor.test(y[i,],y[j,],method='kendall')
a<-table.element(a,round(rk$estimate,4))
a<-table.row.end(a)
a<-table.row.start(a)
a<-table.element(a,'p-value',header=T)
a<-table.element(a,paste('(',round(rp$p.value,4),')',sep=''))
a<-table.element(a,paste('(',round(rs$p.value,4),')',sep=''))
a<-table.element(a,paste('(',round(rk$p.value,4),')',sep=''))
a<-table.row.end(a)
for (iii in 1:10) {
iiid100 <- iii / 100
if (rp$p.value < iiid100) mycorrs[iii, 1] = mycorrs[iii, 1] + 1
if (rs$p.value < iiid100) mycorrs[iii, 2] = mycorrs[iii, 2] + 1
if (rk$p.value < iiid100) mycorrs[iii, 3] = mycorrs[iii, 3] + 1
}
}
}
a<-table.end(a)
table.save(a,file='mytable1.tab')
a<-table.start()
a<-table.row.start(a)
a<-table.element(a,'Meta Analysis of Correlation Tests',4,TRUE)
a<-table.row.end(a)
a<-table.row.start(a)
a<-table.element(a,'Number of significant by total number of Correlations',4,TRUE)
a<-table.row.end(a)
a<-table.row.start(a)
a<-table.element(a,'Type I error',1,TRUE)
a<-table.element(a,'Pearson r',1,TRUE)
a<-table.element(a,'Spearman rho',1,TRUE)
a<-table.element(a,'Kendall tau',1,TRUE)
a<-table.row.end(a)
for (iii in 1:10) {
iiid100 <- iii / 100
a<-table.row.start(a)
a<-table.element(a,round(iiid100,2),header=T)
a<-table.element(a,round(mycorrs[iii,1]/ncorrs,2))
a<-table.element(a,round(mycorrs[iii,2]/ncorrs,2))
a<-table.element(a,round(mycorrs[iii,3]/ncorrs,2))
a<-table.row.end(a)
}
a<-table.end(a)
table.save(a,file='mytable2.tab')