Free Statistics

of Irreproducible Research!

Author's title

Author*The author of this computation has been verified*
R Software Modulerwasp_smp.wasp
Title produced by softwareStandard Deviation-Mean Plot
Date of computationThu, 21 Dec 2017 21:43:05 +0100
Cite this page as followsStatistical Computations at FreeStatistics.org, Office for Research Development and Education, URL https://freestatistics.org/blog/index.php?v=date/2017/Dec/21/t1513891191jiabol5qaynhkke.htm/, Retrieved Tue, 14 May 2024 22:11:50 +0000
Statistical Computations at FreeStatistics.org, Office for Research Development and Education, URL https://freestatistics.org/blog/index.php?pk=310738, Retrieved Tue, 14 May 2024 22:11:50 +0000
QR Codes:

Original text written by user:
IsPrivate?No (this computation is public)
User-defined keywords
Estimated Impact53
Family? (F = Feedback message, R = changed R code, M = changed R Module, P = changed Parameters, D = changed Data)
-       [Standard Deviation-Mean Plot] [] [2017-12-21 20:43:05] [1ea4e9c673228daef4af35aa2d91fd76] [Current]
Feedback Forum

Post a new message
Dataseries X:
243836
257746
282288
282328
251825
168312
204667
223920
262182
301730
296503
304713
279145
250741
295096
268932
268981
265981
229982
264843
272224
309369
318043
299894
278301
258269
262026
307885
295543
295981
203061
215695
208775
275455
313261
296510
306666
252448
246205
296648
317326
257613
242173
263258
279163
266079
303713
295573
289052
261659
238411
276257
316809
264071
242814
246754
256553
306709
322067
300515
279725


Summary of computational transaction
Raw Input view raw input (R code)
Raw Outputview raw output of R engine
Computing time1 seconds
R ServerBig Analytics Cloud Computing Center

\begin{tabular}{lllllllll}
\hline
Summary of computational transaction \tabularnewline
Raw Input view raw input (R code)  \tabularnewline
Raw Outputview raw output of R engine  \tabularnewline
Computing time1 seconds \tabularnewline
R ServerBig Analytics Cloud Computing Center \tabularnewline
\hline
\end{tabular}
%Source: https://freestatistics.org/blog/index.php?pk=310738&T=0

[TABLE]
[ROW]
Summary of computational transaction[/C][/ROW] [ROW]Raw Input[/C] view raw input (R code) [/C][/ROW] [ROW]Raw Output[/C]view raw output of R engine [/C][/ROW] [ROW]Computing time[/C]1 seconds[/C][/ROW] [ROW]R Server[/C]Big Analytics Cloud Computing Center[/C][/ROW] [/TABLE] Source: https://freestatistics.org/blog/index.php?pk=310738&T=0

Globally Unique Identifier (entire table): ba.freestatistics.org/blog/index.php?pk=310738&T=0

As an alternative you can also use a QR Code:  

The GUIDs for individual cells are displayed in the table below:

Summary of computational transaction
Raw Input view raw input (R code)
Raw Outputview raw output of R engine
Computing time1 seconds
R ServerBig Analytics Cloud Computing Center


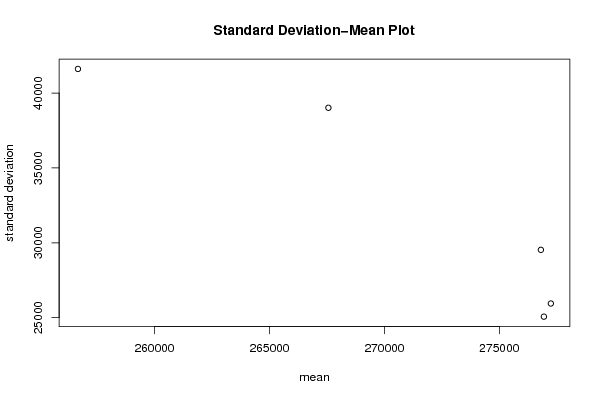
Standard Deviation-Mean Plot
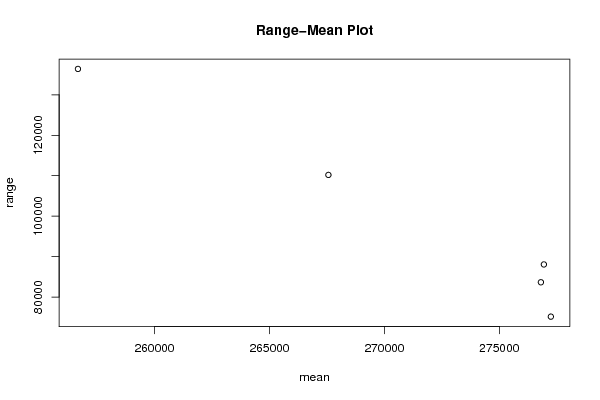
SectionMeanStandard DeviationRange
1256670.83333333341608.0765670087136401
2276935.91666666725063.696641877588061
3267563.539015.1652367966110200
4277238.7525941.991611092675153
5276805.91666666729526.445423654783656

\begin{tabular}{lllllllll}
\hline
Standard Deviation-Mean Plot \tabularnewline
Section & Mean & Standard Deviation & Range \tabularnewline
1 & 256670.833333333 & 41608.0765670087 & 136401 \tabularnewline
2 & 276935.916666667 & 25063.6966418775 & 88061 \tabularnewline
3 & 267563.5 & 39015.1652367966 & 110200 \tabularnewline
4 & 277238.75 & 25941.9916110926 & 75153 \tabularnewline
5 & 276805.916666667 & 29526.4454236547 & 83656 \tabularnewline
\hline
\end{tabular}
%Source: https://freestatistics.org/blog/index.php?pk=310738&T=1

[TABLE]
[ROW][C]Standard Deviation-Mean Plot[/C][/ROW]
[ROW][C]Section[/C][C]Mean[/C][C]Standard Deviation[/C][C]Range[/C][/ROW]
[ROW][C]1[/C][C]256670.833333333[/C][C]41608.0765670087[/C][C]136401[/C][/ROW]
[ROW][C]2[/C][C]276935.916666667[/C][C]25063.6966418775[/C][C]88061[/C][/ROW]
[ROW][C]3[/C][C]267563.5[/C][C]39015.1652367966[/C][C]110200[/C][/ROW]
[ROW][C]4[/C][C]277238.75[/C][C]25941.9916110926[/C][C]75153[/C][/ROW]
[ROW][C]5[/C][C]276805.916666667[/C][C]29526.4454236547[/C][C]83656[/C][/ROW]
[/TABLE]
Source: https://freestatistics.org/blog/index.php?pk=310738&T=1

Globally Unique Identifier (entire table): ba.freestatistics.org/blog/index.php?pk=310738&T=1

As an alternative you can also use a QR Code:  

The GUIDs for individual cells are displayed in the table below:

Standard Deviation-Mean Plot
SectionMeanStandard DeviationRange
1256670.83333333341608.0765670087136401
2276935.91666666725063.696641877588061
3267563.539015.1652367966110200
4277238.7525941.991611092675153
5276805.91666666729526.445423654783656


Regression: S.E.(k) = alpha + beta * Mean(k)
alpha245036.491075603
beta-0.785135307184118
S.D.0.180753799944834
T-STAT-4.34367248391869
p-value0.022525402908652

\begin{tabular}{lllllllll}
\hline
Regression: S.E.(k) = alpha + beta * Mean(k) \tabularnewline
alpha & 245036.491075603 \tabularnewline
beta & -0.785135307184118 \tabularnewline
S.D. & 0.180753799944834 \tabularnewline
T-STAT & -4.34367248391869 \tabularnewline
p-value & 0.022525402908652 \tabularnewline
\hline
\end{tabular}
%Source: https://freestatistics.org/blog/index.php?pk=310738&T=2

[TABLE]
[ROW][C]Regression: S.E.(k) = alpha + beta * Mean(k)[/C][/ROW]
[ROW][C]alpha[/C][C]245036.491075603[/C][/ROW]
[ROW][C]beta[/C][C]-0.785135307184118[/C][/ROW]
[ROW][C]S.D.[/C][C]0.180753799944834[/C][/ROW]
[ROW][C]T-STAT[/C][C]-4.34367248391869[/C][/ROW]
[ROW][C]p-value[/C][C]0.022525402908652[/C][/ROW]
[/TABLE]
Source: https://freestatistics.org/blog/index.php?pk=310738&T=2

Globally Unique Identifier (entire table): ba.freestatistics.org/blog/index.php?pk=310738&T=2

As an alternative you can also use a QR Code:  

The GUIDs for individual cells are displayed in the table below:

Regression: S.E.(k) = alpha + beta * Mean(k)
alpha245036.491075603
beta-0.785135307184118
S.D.0.180753799944834
T-STAT-4.34367248391869
p-value0.022525402908652


Regression: ln S.E.(k) = alpha + beta * ln Mean(k)
alpha88.9563177894017
beta-6.28299172441353
S.D.1.6620668294815
T-STAT-3.78022809490372
p-value0.0324383986812331
Lambda7.28299172441353

\begin{tabular}{lllllllll}
\hline
Regression: ln S.E.(k) = alpha + beta * ln Mean(k) \tabularnewline
alpha & 88.9563177894017 \tabularnewline
beta & -6.28299172441353 \tabularnewline
S.D. & 1.6620668294815 \tabularnewline
T-STAT & -3.78022809490372 \tabularnewline
p-value & 0.0324383986812331 \tabularnewline
Lambda & 7.28299172441353 \tabularnewline
\hline
\end{tabular}
%Source: https://freestatistics.org/blog/index.php?pk=310738&T=3

[TABLE]
[ROW][C]Regression: ln S.E.(k) = alpha + beta * ln Mean(k)[/C][/ROW]
[ROW][C]alpha[/C][C]88.9563177894017[/C][/ROW]
[ROW][C]beta[/C][C]-6.28299172441353[/C][/ROW]
[ROW][C]S.D.[/C][C]1.6620668294815[/C][/ROW]
[ROW][C]T-STAT[/C][C]-3.78022809490372[/C][/ROW]
[ROW][C]p-value[/C][C]0.0324383986812331[/C][/ROW]
[ROW][C]Lambda[/C][C]7.28299172441353[/C][/ROW]
[/TABLE]
Source: https://freestatistics.org/blog/index.php?pk=310738&T=3

Globally Unique Identifier (entire table): ba.freestatistics.org/blog/index.php?pk=310738&T=3

As an alternative you can also use a QR Code:  

The GUIDs for individual cells are displayed in the table below:

Regression: ln S.E.(k) = alpha + beta * ln Mean(k)
alpha88.9563177894017
beta-6.28299172441353
S.D.1.6620668294815
T-STAT-3.78022809490372
p-value0.0324383986812331
Lambda7.28299172441353


Parameters (Session):
par1 = 12 ;
Parameters (R input):
par1 = 12 ;
R code (references can be found in the software module):
par1 <- as.numeric(par1)
(n <- length(x))
(np <- floor(n / par1))
arr <- array(NA,dim=c(par1,np))
j <- 0
k <- 1
for (i in 1:(np*par1))
{
j = j + 1
arr[j,k] <- x[i]
if (j == par1) {
j = 0
k=k+1
}
}
arr
arr.mean <- array(NA,dim=np)
arr.sd <- array(NA,dim=np)
arr.range <- array(NA,dim=np)
for (j in 1:np)
{
arr.mean[j] <- mean(arr[,j],na.rm=TRUE)
arr.sd[j] <- sd(arr[,j],na.rm=TRUE)
arr.range[j] <- max(arr[,j],na.rm=TRUE) - min(arr[,j],na.rm=TRUE)
}
arr.mean
arr.sd
arr.range
(lm1 <- lm(arr.sd~arr.mean))
(lnlm1 <- lm(log(arr.sd)~log(arr.mean)))
(lm2 <- lm(arr.range~arr.mean))
bitmap(file='test1.png')
plot(arr.mean,arr.sd,main='Standard Deviation-Mean Plot',xlab='mean',ylab='standard deviation')
dev.off()
bitmap(file='test2.png')
plot(arr.mean,arr.range,main='Range-Mean Plot',xlab='mean',ylab='range')
dev.off()
load(file='createtable')
a<-table.start()
a<-table.row.start(a)
a<-table.element(a,'Standard Deviation-Mean Plot',4,TRUE)
a<-table.row.end(a)
a<-table.row.start(a)
a<-table.element(a,'Section',header=TRUE)
a<-table.element(a,'Mean',header=TRUE)
a<-table.element(a,'Standard Deviation',header=TRUE)
a<-table.element(a,'Range',header=TRUE)
a<-table.row.end(a)
for (j in 1:np) {
a<-table.row.start(a)
a<-table.element(a,j,header=TRUE)
a<-table.element(a,arr.mean[j])
a<-table.element(a,arr.sd[j] )
a<-table.element(a,arr.range[j] )
a<-table.row.end(a)
}
a<-table.end(a)
table.save(a,file='mytable.tab')
a<-table.start()
a<-table.row.start(a)
a<-table.element(a,'Regression: S.E.(k) = alpha + beta * Mean(k)',2,TRUE)
a<-table.row.end(a)
a<-table.row.start(a)
a<-table.element(a,'alpha',header=TRUE)
a<-table.element(a,lm1$coefficients[[1]])
a<-table.row.end(a)
a<-table.row.start(a)
a<-table.element(a,'beta',header=TRUE)
a<-table.element(a,lm1$coefficients[[2]])
a<-table.row.end(a)
a<-table.row.start(a)
a<-table.element(a,'S.D.',header=TRUE)
a<-table.element(a,summary(lm1)$coefficients[2,2])
a<-table.row.end(a)
a<-table.row.start(a)
a<-table.element(a,'T-STAT',header=TRUE)
a<-table.element(a,summary(lm1)$coefficients[2,3])
a<-table.row.end(a)
a<-table.row.start(a)
a<-table.element(a,'p-value',header=TRUE)
a<-table.element(a,summary(lm1)$coefficients[2,4])
a<-table.row.end(a)
a<-table.end(a)
table.save(a,file='mytable1.tab')
a<-table.start()
a<-table.row.start(a)
a<-table.element(a,'Regression: ln S.E.(k) = alpha + beta * ln Mean(k)',2,TRUE)
a<-table.row.end(a)
a<-table.row.start(a)
a<-table.element(a,'alpha',header=TRUE)
a<-table.element(a,lnlm1$coefficients[[1]])
a<-table.row.end(a)
a<-table.row.start(a)
a<-table.element(a,'beta',header=TRUE)
a<-table.element(a,lnlm1$coefficients[[2]])
a<-table.row.end(a)
a<-table.row.start(a)
a<-table.element(a,'S.D.',header=TRUE)
a<-table.element(a,summary(lnlm1)$coefficients[2,2])
a<-table.row.end(a)
a<-table.row.start(a)
a<-table.element(a,'T-STAT',header=TRUE)
a<-table.element(a,summary(lnlm1)$coefficients[2,3])
a<-table.row.end(a)
a<-table.row.start(a)
a<-table.element(a,'p-value',header=TRUE)
a<-table.element(a,summary(lnlm1)$coefficients[2,4])
a<-table.row.end(a)
a<-table.row.start(a)
a<-table.element(a,'Lambda',header=TRUE)
a<-table.element(a,1-lnlm1$coefficients[[2]])
a<-table.row.end(a)
a<-table.end(a)
table.save(a,file='mytable2.tab')