\begin{tabular}{lllllllll}
\hline
Summary of computational transaction \tabularnewline
Raw Input view raw input (R code)  \tabularnewline
Raw Outputview raw output of R engine  \tabularnewline
Computing time9 seconds \tabularnewline
R ServerBig Analytics Cloud Computing Center \tabularnewline
\hline
\end{tabular}
%Source: https://freestatistics.org/blog/index.php?pk=310704&T=0
[TABLE]
[ROW]| Summary of computational transaction[/C][/ROW]
[ROW] | Raw Input[/C] | view raw input (R code) [/C][/ROW]
[ROW] | Raw Output[/C] | view raw output of R engine [/C][/ROW]
[ROW] | Computing time[/C] | 9 seconds[/C][/ROW]
[ROW] | R Server[/C] | Big Analytics Cloud Computing Center[/C][/ROW]
[/TABLE]
Source: https://freestatistics.org/blog/index.php?pk=310704&T=0 |
If you paste this QR Code into your document, anyone with a smartphone or tablet will be able to scan it and view this table in a browser.
If you paste this QR Code into your document, anyone with a smartphone or tablet will be able to scan it and view this table in a browser.
If you paste this QR Code into your document, anyone with a smartphone or tablet will be able to scan it and view this table in a browser.
If you paste this QR Code into your document, anyone with a smartphone or tablet will be able to scan it and view this table in a browser.
If you paste this QR Code into your document, anyone with a smartphone or tablet will be able to scan it and view this table in a browser.
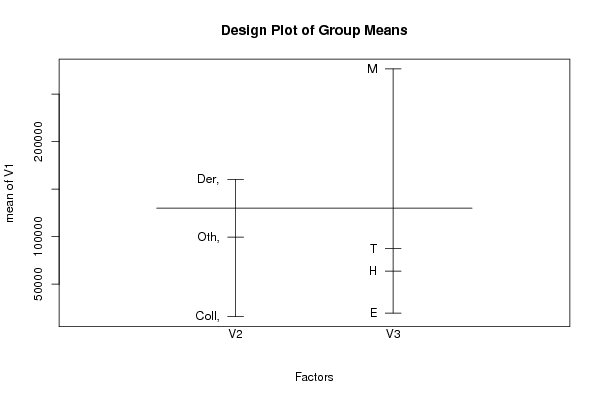
| ANOVA Model | | Response ~ Treatment_A * Treatment_B | | means | -59550.5 | 92673.5 | 72559.5 | 75419.5 | 134294.667 | 15458 | -86893.357 | NA | 302879.708 | NA | 42081.5 | NA |
\begin{tabular}{lllllllll}
\hline
ANOVA Model \tabularnewline
Response ~ Treatment_A * Treatment_B \tabularnewline
means & -59550.5 & 92673.5 & 72559.5 & 75419.5 & 134294.667 & 15458 & -86893.357 & NA & 302879.708 & NA & 42081.5 & NA \tabularnewline
\hline
\end{tabular}
%Source: https://freestatistics.org/blog/index.php?pk=310704&T=1
[TABLE]
[ROW][C]ANOVA Model[/C][/ROW]
[ROW][C]Response ~ Treatment_A * Treatment_B[/C][/ROW]
[ROW][C]means[/C][C]-59550.5[/C][C]92673.5[/C][C]72559.5[/C][C]75419.5[/C][C]134294.667[/C][C]15458[/C][C]-86893.357[/C][C]NA[/C][C]302879.708[/C][C]NA[/C][C]42081.5[/C][C]NA[/C][/ROW]
[/TABLE]
Source: https://freestatistics.org/blog/index.php?pk=310704&T=1
Globally Unique Identifier (entire table): ba.freestatistics.org/blog/index.php?pk=310704&T=1
As an alternative you can also use a QR Code:
The GUIDs for individual cells are displayed in the table below:
| ANOVA Model | | Response ~ Treatment_A * Treatment_B | | means | -59550.5 | 92673.5 | 72559.5 | 75419.5 | 134294.667 | 15458 | -86893.357 | NA | 302879.708 | NA | 42081.5 | NA |
If you paste this QR Code into your document, anyone with a smartphone or tablet will be able to scan it and view this table in a browser.
If you paste this QR Code into your document, anyone with a smartphone or tablet will be able to scan it and view this table in a browser.
If you paste this QR Code into your document, anyone with a smartphone or tablet will be able to scan it and view this table in a browser.
If you paste this QR Code into your document, anyone with a smartphone or tablet will be able to scan it and view this table in a browser.
If you paste this QR Code into your document, anyone with a smartphone or tablet will be able to scan it and view this table in a browser.
| ANOVA Statistics | | | Df | Sum Sq | Mean Sq | F value | Pr(>F) | | 2 | | | | | | Treatment_A | 2 | 73992883555.38 | 36996441777.69 | 0.162 | 0.85 | | Treatment_B | 2 | 710653821676.975 | 236884607225.658 | 1.04 | 0.382 | | Treatment_A:Treatment_B | 2 | 376445103207.022 | 125481701069.007 | 0.551 | 0.649 | | Residuals | 58 | 13205402765599.4 | 227679358027.576 | | |
\begin{tabular}{lllllllll}
\hline
ANOVA Statistics \tabularnewline
  & Df & Sum Sq & Mean Sq & F value & Pr(>F) \tabularnewline
 & 2 &  &  &  &  \tabularnewline
Treatment_A & 2 & 73992883555.38 & 36996441777.69 & 0.162 & 0.85 \tabularnewline
Treatment_B & 2 & 710653821676.975 & 236884607225.658 & 1.04 & 0.382 \tabularnewline
Treatment_A:Treatment_B & 2 & 376445103207.022 & 125481701069.007 & 0.551 & 0.649 \tabularnewline
Residuals & 58 & 13205402765599.4 & 227679358027.576 &   &   \tabularnewline
\hline
\end{tabular}
%Source: https://freestatistics.org/blog/index.php?pk=310704&T=2
[TABLE]
[ROW][C]ANOVA Statistics[/C][/ROW]
[ROW][C] [/C][C]Df[/C][C]Sum Sq[/C][C]Mean Sq[/C][C]F value[/C][C]Pr(>F)[/C][/ROW]
[ROW][C][/C][C]2[/C][C][/C][C][/C][C][/C][C][/C][/ROW]
[ROW][C]Treatment_A[/C][C]2[/C][C]73992883555.38[/C][C]36996441777.69[/C][C]0.162[/C][C]0.85[/C][/ROW]
[ROW][C]Treatment_B[/C][C]2[/C][C]710653821676.975[/C][C]236884607225.658[/C][C]1.04[/C][C]0.382[/C][/ROW]
[ROW][C]Treatment_A:Treatment_B[/C][C]2[/C][C]376445103207.022[/C][C]125481701069.007[/C][C]0.551[/C][C]0.649[/C][/ROW]
[ROW][C]Residuals[/C][C]58[/C][C]13205402765599.4[/C][C]227679358027.576[/C][C] [/C][C] [/C][/ROW]
[/TABLE]
Source: https://freestatistics.org/blog/index.php?pk=310704&T=2
Globally Unique Identifier (entire table): ba.freestatistics.org/blog/index.php?pk=310704&T=2
As an alternative you can also use a QR Code:
The GUIDs for individual cells are displayed in the table below:
| ANOVA Statistics | | | Df | Sum Sq | Mean Sq | F value | Pr(>F) | | 2 | | | | | | Treatment_A | 2 | 73992883555.38 | 36996441777.69 | 0.162 | 0.85 | | Treatment_B | 2 | 710653821676.975 | 236884607225.658 | 1.04 | 0.382 | | Treatment_A:Treatment_B | 2 | 376445103207.022 | 125481701069.007 | 0.551 | 0.649 | | Residuals | 58 | 13205402765599.4 | 227679358027.576 | | |
If you paste this QR Code into your document, anyone with a smartphone or tablet will be able to scan it and view this table in a browser.
If you paste this QR Code into your document, anyone with a smartphone or tablet will be able to scan it and view this table in a browser.
If you paste this QR Code into your document, anyone with a smartphone or tablet will be able to scan it and view this table in a browser.
If you paste this QR Code into your document, anyone with a smartphone or tablet will be able to scan it and view this table in a browser.
If you paste this QR Code into your document, anyone with a smartphone or tablet will be able to scan it and view this table in a browser.
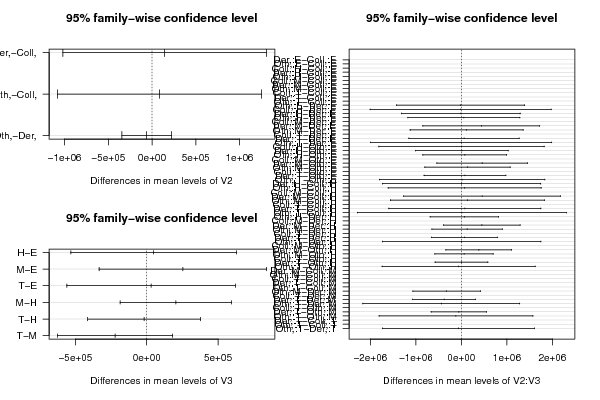
| Tukey Honest Significant Difference Comparisons | | | diff | lwr | upr | p adj | | Der,-Coll, | 144476.543 | -1019517.377 | 1308470.463 | 0.952 | | Oth,-Coll, | 83684.097 | -1082393.968 | 1249762.162 | 0.984 | | Oth,-Der, | -60792.446 | -343860.32 | 222275.427 | 0.864 | | H-E | 48893.617 | -532402.703 | 630189.937 | 0.996 | | M-E | 252734.654 | -334756.829 | 840226.136 | 0.668 | | T-E | 30346.691 | -560701.786 | 621395.168 | 0.999 | | M-H | 203841.036 | -186104.39 | 593786.463 | 0.515 | | T-H | -18546.926 | -413830.995 | 376737.143 | 0.999 | | T-M | -222387.963 | -626727.332 | 181951.406 | 0.471 | | Der,:E-Coll,:E | NA | NA | NA | NA | | Oth,:E-Coll,:E | NA | NA | NA | NA | | Coll,:H-Coll,:E | NA | NA | NA | NA | | Der,:H-Coll,:E | NA | NA | NA | NA | | Oth,:H-Coll,:E | NA | NA | NA | NA | | Coll,:M-Coll,:E | NA | NA | NA | NA | | Der,:M-Coll,:E | NA | NA | NA | NA | | Oth,:M-Coll,:E | NA | NA | NA | NA | | Coll,:T-Coll,:E | NA | NA | NA | NA | | Der,:T-Coll,:E | NA | NA | NA | NA | | Oth,:T-Coll,:E | NA | NA | NA | NA | | Oth,:E-Der,:E | -20114 | -1427052.553 | 1386824.553 | 1 | | Coll,:H-Der,:E | -17254 | -2006965.584 | 1972457.584 | 1 | | Der,:H-Der,:E | -11473.857 | -1314045.849 | 1291098.135 | 1 | | Oth,:H-Der,:E | 55305.5 | -1172771.151 | 1283382.151 | 1 | | Coll,:M-Der,:E | NA | NA | NA | NA | | Der,:M-Der,:E | 437174.375 | -847178.93 | 1721527.68 | 0.99 | | Oth,:M-Der,:E | 114180.667 | -1126622.507 | 1354983.841 | 1 | | Coll,:T-Der,:E | NA | NA | NA | NA | | Der,:T-Der,:E | 57539.5 | -1153360.408 | 1268439.408 | 1 | | Oth,:T-Der,:E | -4656 | -1994367.584 | 1985055.584 | 1 | | Coll,:H-Oth,:E | 2860 | -1813489.862 | 1819209.862 | 1 | | Der,:H-Oth,:E | 8640.143 | -1009627.224 | 1026907.509 | 1 | | Oth,:H-Oth,:E | 75419.5 | -845637.988 | 996476.988 | 1 | | Coll,:M-Oth,:E | NA | NA | NA | NA | | Der,:M-Oth,:E | 457288.375 | -537567.417 | 1452144.167 | 0.914 | | Oth,:M-Oth,:E | 134294.667 | -803664.369 | 1072253.702 | 1 | | Coll,:T-Oth,:E | NA | NA | NA | NA | | Der,:T-Oth,:E | 77653.5 | -820373.907 | 975680.907 | 1 | | Oth,:T-Oth,:E | 15458 | -1800891.862 | 1831807.862 | 1 | | Der,:H-Coll,:H | 5780.143 | -1730982.513 | 1742542.799 | 1 | | Oth,:H-Coll,:H | 72559.5 | -1609053.711 | 1754172.711 | 1 | | Coll,:M-Coll,:H | NA | NA | NA | NA | | Der,:M-Coll,:H | 454428.375 | -1268712.403 | 2177569.153 | 0.999 | | Oth,:M-Coll,:H | 131434.667 | -1559495.032 | 1822364.365 | 1 | | Coll,:T-Coll,:H | NA | NA | NA | NA | | Der,:T-Coll,:H | 74793.5 | -1594316.837 | 1743903.837 | 1 | | Oth,:T-Coll,:H | 12598 | -2284923.037 | 2310119.037 | 1 | | Oth,:H-Der,:H | 66779.357 | -685260.933 | 818819.647 | 1 | | Coll,:M-Der,:H | NA | NA | NA | NA | | Der,:M-Der,:H | 448648.232 | -392158.373 | 1289454.837 | 0.802 | | Oth,:M-Der,:H | 125654.524 | -646993.425 | 898302.473 | 1 | | Coll,:T-Der,:H | NA | NA | NA | NA | | Der,:T-Der,:H | 69013.357 | -654637.749 | 792664.464 | 1 | | Oth,:T-Der,:H | 6817.857 | -1729944.799 | 1743580.513 | 1 | | Coll,:M-Oth,:H | NA | NA | NA | NA | | Der,:M-Oth,:H | 381868.875 | -338154.885 | 1101892.635 | 0.808 | | Oth,:M-Oth,:H | 58875.167 | -580236.186 | 697986.519 | 1 | | Coll,:T-Oth,:H | NA | NA | NA | NA | | Der,:T-Oth,:H | 2234 | -576686.885 | 581154.885 | 1 | | Oth,:T-Oth,:H | -59961.5 | -1741574.711 | 1621651.711 | 1 | | Der,:M-Coll,:M | NA | NA | NA | NA | | Oth,:M-Coll,:M | NA | NA | NA | NA | | Coll,:T-Coll,:M | NA | NA | NA | NA | | Der,:T-Coll,:M | NA | NA | NA | NA | | Oth,:T-Coll,:M | NA | NA | NA | NA | | Oth,:M-Der,:M | -322993.708 | -1064515.434 | 418528.018 | 0.939 | | Coll,:T-Der,:M | NA | NA | NA | NA | | Der,:T-Der,:M | -379634.875 | -1069954.034 | 310684.284 | 0.771 | | Oth,:T-Der,:M | -441830.375 | -2164971.153 | 1281310.403 | 0.999 | | Coll,:T-Oth,:M | NA | NA | NA | NA | | Der,:T-Oth,:M | -56641.167 | -662091.121 | 548808.787 | 1 | | Oth,:T-Oth,:M | -118836.667 | -1809766.365 | 1572093.032 | 1 | | Der,:T-Coll,:T | NA | NA | NA | NA | | Oth,:T-Coll,:T | NA | NA | NA | NA | | Oth,:T-Der,:T | -62195.5 | -1731305.837 | 1606914.837 | 1 |
\begin{tabular}{lllllllll}
\hline
Tukey Honest Significant Difference Comparisons \tabularnewline
  & diff & lwr & upr & p adj \tabularnewline
Der,-Coll, & 144476.543 & -1019517.377 & 1308470.463 & 0.952 \tabularnewline
Oth,-Coll, & 83684.097 & -1082393.968 & 1249762.162 & 0.984 \tabularnewline
Oth,-Der, & -60792.446 & -343860.32 & 222275.427 & 0.864 \tabularnewline
H-E & 48893.617 & -532402.703 & 630189.937 & 0.996 \tabularnewline
M-E & 252734.654 & -334756.829 & 840226.136 & 0.668 \tabularnewline
T-E & 30346.691 & -560701.786 & 621395.168 & 0.999 \tabularnewline
M-H & 203841.036 & -186104.39 & 593786.463 & 0.515 \tabularnewline
T-H & -18546.926 & -413830.995 & 376737.143 & 0.999 \tabularnewline
T-M & -222387.963 & -626727.332 & 181951.406 & 0.471 \tabularnewline
Der,:E-Coll,:E & NA & NA & NA & NA \tabularnewline
Oth,:E-Coll,:E & NA & NA & NA & NA \tabularnewline
Coll,:H-Coll,:E & NA & NA & NA & NA \tabularnewline
Der,:H-Coll,:E & NA & NA & NA & NA \tabularnewline
Oth,:H-Coll,:E & NA & NA & NA & NA \tabularnewline
Coll,:M-Coll,:E & NA & NA & NA & NA \tabularnewline
Der,:M-Coll,:E & NA & NA & NA & NA \tabularnewline
Oth,:M-Coll,:E & NA & NA & NA & NA \tabularnewline
Coll,:T-Coll,:E & NA & NA & NA & NA \tabularnewline
Der,:T-Coll,:E & NA & NA & NA & NA \tabularnewline
Oth,:T-Coll,:E & NA & NA & NA & NA \tabularnewline
Oth,:E-Der,:E & -20114 & -1427052.553 & 1386824.553 & 1 \tabularnewline
Coll,:H-Der,:E & -17254 & -2006965.584 & 1972457.584 & 1 \tabularnewline
Der,:H-Der,:E & -11473.857 & -1314045.849 & 1291098.135 & 1 \tabularnewline
Oth,:H-Der,:E & 55305.5 & -1172771.151 & 1283382.151 & 1 \tabularnewline
Coll,:M-Der,:E & NA & NA & NA & NA \tabularnewline
Der,:M-Der,:E & 437174.375 & -847178.93 & 1721527.68 & 0.99 \tabularnewline
Oth,:M-Der,:E & 114180.667 & -1126622.507 & 1354983.841 & 1 \tabularnewline
Coll,:T-Der,:E & NA & NA & NA & NA \tabularnewline
Der,:T-Der,:E & 57539.5 & -1153360.408 & 1268439.408 & 1 \tabularnewline
Oth,:T-Der,:E & -4656 & -1994367.584 & 1985055.584 & 1 \tabularnewline
Coll,:H-Oth,:E & 2860 & -1813489.862 & 1819209.862 & 1 \tabularnewline
Der,:H-Oth,:E & 8640.143 & -1009627.224 & 1026907.509 & 1 \tabularnewline
Oth,:H-Oth,:E & 75419.5 & -845637.988 & 996476.988 & 1 \tabularnewline
Coll,:M-Oth,:E & NA & NA & NA & NA \tabularnewline
Der,:M-Oth,:E & 457288.375 & -537567.417 & 1452144.167 & 0.914 \tabularnewline
Oth,:M-Oth,:E & 134294.667 & -803664.369 & 1072253.702 & 1 \tabularnewline
Coll,:T-Oth,:E & NA & NA & NA & NA \tabularnewline
Der,:T-Oth,:E & 77653.5 & -820373.907 & 975680.907 & 1 \tabularnewline
Oth,:T-Oth,:E & 15458 & -1800891.862 & 1831807.862 & 1 \tabularnewline
Der,:H-Coll,:H & 5780.143 & -1730982.513 & 1742542.799 & 1 \tabularnewline
Oth,:H-Coll,:H & 72559.5 & -1609053.711 & 1754172.711 & 1 \tabularnewline
Coll,:M-Coll,:H & NA & NA & NA & NA \tabularnewline
Der,:M-Coll,:H & 454428.375 & -1268712.403 & 2177569.153 & 0.999 \tabularnewline
Oth,:M-Coll,:H & 131434.667 & -1559495.032 & 1822364.365 & 1 \tabularnewline
Coll,:T-Coll,:H & NA & NA & NA & NA \tabularnewline
Der,:T-Coll,:H & 74793.5 & -1594316.837 & 1743903.837 & 1 \tabularnewline
Oth,:T-Coll,:H & 12598 & -2284923.037 & 2310119.037 & 1 \tabularnewline
Oth,:H-Der,:H & 66779.357 & -685260.933 & 818819.647 & 1 \tabularnewline
Coll,:M-Der,:H & NA & NA & NA & NA \tabularnewline
Der,:M-Der,:H & 448648.232 & -392158.373 & 1289454.837 & 0.802 \tabularnewline
Oth,:M-Der,:H & 125654.524 & -646993.425 & 898302.473 & 1 \tabularnewline
Coll,:T-Der,:H & NA & NA & NA & NA \tabularnewline
Der,:T-Der,:H & 69013.357 & -654637.749 & 792664.464 & 1 \tabularnewline
Oth,:T-Der,:H & 6817.857 & -1729944.799 & 1743580.513 & 1 \tabularnewline
Coll,:M-Oth,:H & NA & NA & NA & NA \tabularnewline
Der,:M-Oth,:H & 381868.875 & -338154.885 & 1101892.635 & 0.808 \tabularnewline
Oth,:M-Oth,:H & 58875.167 & -580236.186 & 697986.519 & 1 \tabularnewline
Coll,:T-Oth,:H & NA & NA & NA & NA \tabularnewline
Der,:T-Oth,:H & 2234 & -576686.885 & 581154.885 & 1 \tabularnewline
Oth,:T-Oth,:H & -59961.5 & -1741574.711 & 1621651.711 & 1 \tabularnewline
Der,:M-Coll,:M & NA & NA & NA & NA \tabularnewline
Oth,:M-Coll,:M & NA & NA & NA & NA \tabularnewline
Coll,:T-Coll,:M & NA & NA & NA & NA \tabularnewline
Der,:T-Coll,:M & NA & NA & NA & NA \tabularnewline
Oth,:T-Coll,:M & NA & NA & NA & NA \tabularnewline
Oth,:M-Der,:M & -322993.708 & -1064515.434 & 418528.018 & 0.939 \tabularnewline
Coll,:T-Der,:M & NA & NA & NA & NA \tabularnewline
Der,:T-Der,:M & -379634.875 & -1069954.034 & 310684.284 & 0.771 \tabularnewline
Oth,:T-Der,:M & -441830.375 & -2164971.153 & 1281310.403 & 0.999 \tabularnewline
Coll,:T-Oth,:M & NA & NA & NA & NA \tabularnewline
Der,:T-Oth,:M & -56641.167 & -662091.121 & 548808.787 & 1 \tabularnewline
Oth,:T-Oth,:M & -118836.667 & -1809766.365 & 1572093.032 & 1 \tabularnewline
Der,:T-Coll,:T & NA & NA & NA & NA \tabularnewline
Oth,:T-Coll,:T & NA & NA & NA & NA \tabularnewline
Oth,:T-Der,:T & -62195.5 & -1731305.837 & 1606914.837 & 1 \tabularnewline
\hline
\end{tabular}
%Source: https://freestatistics.org/blog/index.php?pk=310704&T=3
[TABLE]
[ROW][C]Tukey Honest Significant Difference Comparisons[/C][/ROW]
[ROW][C] [/C][C]diff[/C][C]lwr[/C][C]upr[/C][C]p adj[/C][/ROW]
[ROW][C]Der,-Coll,[/C][C]144476.543[/C][C]-1019517.377[/C][C]1308470.463[/C][C]0.952[/C][/ROW]
[ROW][C]Oth,-Coll,[/C][C]83684.097[/C][C]-1082393.968[/C][C]1249762.162[/C][C]0.984[/C][/ROW]
[ROW][C]Oth,-Der,[/C][C]-60792.446[/C][C]-343860.32[/C][C]222275.427[/C][C]0.864[/C][/ROW]
[ROW][C]H-E[/C][C]48893.617[/C][C]-532402.703[/C][C]630189.937[/C][C]0.996[/C][/ROW]
[ROW][C]M-E[/C][C]252734.654[/C][C]-334756.829[/C][C]840226.136[/C][C]0.668[/C][/ROW]
[ROW][C]T-E[/C][C]30346.691[/C][C]-560701.786[/C][C]621395.168[/C][C]0.999[/C][/ROW]
[ROW][C]M-H[/C][C]203841.036[/C][C]-186104.39[/C][C]593786.463[/C][C]0.515[/C][/ROW]
[ROW][C]T-H[/C][C]-18546.926[/C][C]-413830.995[/C][C]376737.143[/C][C]0.999[/C][/ROW]
[ROW][C]T-M[/C][C]-222387.963[/C][C]-626727.332[/C][C]181951.406[/C][C]0.471[/C][/ROW]
[ROW][C]Der,:E-Coll,:E[/C][C]NA[/C][C]NA[/C][C]NA[/C][C]NA[/C][/ROW]
[ROW][C]Oth,:E-Coll,:E[/C][C]NA[/C][C]NA[/C][C]NA[/C][C]NA[/C][/ROW]
[ROW][C]Coll,:H-Coll,:E[/C][C]NA[/C][C]NA[/C][C]NA[/C][C]NA[/C][/ROW]
[ROW][C]Der,:H-Coll,:E[/C][C]NA[/C][C]NA[/C][C]NA[/C][C]NA[/C][/ROW]
[ROW][C]Oth,:H-Coll,:E[/C][C]NA[/C][C]NA[/C][C]NA[/C][C]NA[/C][/ROW]
[ROW][C]Coll,:M-Coll,:E[/C][C]NA[/C][C]NA[/C][C]NA[/C][C]NA[/C][/ROW]
[ROW][C]Der,:M-Coll,:E[/C][C]NA[/C][C]NA[/C][C]NA[/C][C]NA[/C][/ROW]
[ROW][C]Oth,:M-Coll,:E[/C][C]NA[/C][C]NA[/C][C]NA[/C][C]NA[/C][/ROW]
[ROW][C]Coll,:T-Coll,:E[/C][C]NA[/C][C]NA[/C][C]NA[/C][C]NA[/C][/ROW]
[ROW][C]Der,:T-Coll,:E[/C][C]NA[/C][C]NA[/C][C]NA[/C][C]NA[/C][/ROW]
[ROW][C]Oth,:T-Coll,:E[/C][C]NA[/C][C]NA[/C][C]NA[/C][C]NA[/C][/ROW]
[ROW][C]Oth,:E-Der,:E[/C][C]-20114[/C][C]-1427052.553[/C][C]1386824.553[/C][C]1[/C][/ROW]
[ROW][C]Coll,:H-Der,:E[/C][C]-17254[/C][C]-2006965.584[/C][C]1972457.584[/C][C]1[/C][/ROW]
[ROW][C]Der,:H-Der,:E[/C][C]-11473.857[/C][C]-1314045.849[/C][C]1291098.135[/C][C]1[/C][/ROW]
[ROW][C]Oth,:H-Der,:E[/C][C]55305.5[/C][C]-1172771.151[/C][C]1283382.151[/C][C]1[/C][/ROW]
[ROW][C]Coll,:M-Der,:E[/C][C]NA[/C][C]NA[/C][C]NA[/C][C]NA[/C][/ROW]
[ROW][C]Der,:M-Der,:E[/C][C]437174.375[/C][C]-847178.93[/C][C]1721527.68[/C][C]0.99[/C][/ROW]
[ROW][C]Oth,:M-Der,:E[/C][C]114180.667[/C][C]-1126622.507[/C][C]1354983.841[/C][C]1[/C][/ROW]
[ROW][C]Coll,:T-Der,:E[/C][C]NA[/C][C]NA[/C][C]NA[/C][C]NA[/C][/ROW]
[ROW][C]Der,:T-Der,:E[/C][C]57539.5[/C][C]-1153360.408[/C][C]1268439.408[/C][C]1[/C][/ROW]
[ROW][C]Oth,:T-Der,:E[/C][C]-4656[/C][C]-1994367.584[/C][C]1985055.584[/C][C]1[/C][/ROW]
[ROW][C]Coll,:H-Oth,:E[/C][C]2860[/C][C]-1813489.862[/C][C]1819209.862[/C][C]1[/C][/ROW]
[ROW][C]Der,:H-Oth,:E[/C][C]8640.143[/C][C]-1009627.224[/C][C]1026907.509[/C][C]1[/C][/ROW]
[ROW][C]Oth,:H-Oth,:E[/C][C]75419.5[/C][C]-845637.988[/C][C]996476.988[/C][C]1[/C][/ROW]
[ROW][C]Coll,:M-Oth,:E[/C][C]NA[/C][C]NA[/C][C]NA[/C][C]NA[/C][/ROW]
[ROW][C]Der,:M-Oth,:E[/C][C]457288.375[/C][C]-537567.417[/C][C]1452144.167[/C][C]0.914[/C][/ROW]
[ROW][C]Oth,:M-Oth,:E[/C][C]134294.667[/C][C]-803664.369[/C][C]1072253.702[/C][C]1[/C][/ROW]
[ROW][C]Coll,:T-Oth,:E[/C][C]NA[/C][C]NA[/C][C]NA[/C][C]NA[/C][/ROW]
[ROW][C]Der,:T-Oth,:E[/C][C]77653.5[/C][C]-820373.907[/C][C]975680.907[/C][C]1[/C][/ROW]
[ROW][C]Oth,:T-Oth,:E[/C][C]15458[/C][C]-1800891.862[/C][C]1831807.862[/C][C]1[/C][/ROW]
[ROW][C]Der,:H-Coll,:H[/C][C]5780.143[/C][C]-1730982.513[/C][C]1742542.799[/C][C]1[/C][/ROW]
[ROW][C]Oth,:H-Coll,:H[/C][C]72559.5[/C][C]-1609053.711[/C][C]1754172.711[/C][C]1[/C][/ROW]
[ROW][C]Coll,:M-Coll,:H[/C][C]NA[/C][C]NA[/C][C]NA[/C][C]NA[/C][/ROW]
[ROW][C]Der,:M-Coll,:H[/C][C]454428.375[/C][C]-1268712.403[/C][C]2177569.153[/C][C]0.999[/C][/ROW]
[ROW][C]Oth,:M-Coll,:H[/C][C]131434.667[/C][C]-1559495.032[/C][C]1822364.365[/C][C]1[/C][/ROW]
[ROW][C]Coll,:T-Coll,:H[/C][C]NA[/C][C]NA[/C][C]NA[/C][C]NA[/C][/ROW]
[ROW][C]Der,:T-Coll,:H[/C][C]74793.5[/C][C]-1594316.837[/C][C]1743903.837[/C][C]1[/C][/ROW]
[ROW][C]Oth,:T-Coll,:H[/C][C]12598[/C][C]-2284923.037[/C][C]2310119.037[/C][C]1[/C][/ROW]
[ROW][C]Oth,:H-Der,:H[/C][C]66779.357[/C][C]-685260.933[/C][C]818819.647[/C][C]1[/C][/ROW]
[ROW][C]Coll,:M-Der,:H[/C][C]NA[/C][C]NA[/C][C]NA[/C][C]NA[/C][/ROW]
[ROW][C]Der,:M-Der,:H[/C][C]448648.232[/C][C]-392158.373[/C][C]1289454.837[/C][C]0.802[/C][/ROW]
[ROW][C]Oth,:M-Der,:H[/C][C]125654.524[/C][C]-646993.425[/C][C]898302.473[/C][C]1[/C][/ROW]
[ROW][C]Coll,:T-Der,:H[/C][C]NA[/C][C]NA[/C][C]NA[/C][C]NA[/C][/ROW]
[ROW][C]Der,:T-Der,:H[/C][C]69013.357[/C][C]-654637.749[/C][C]792664.464[/C][C]1[/C][/ROW]
[ROW][C]Oth,:T-Der,:H[/C][C]6817.857[/C][C]-1729944.799[/C][C]1743580.513[/C][C]1[/C][/ROW]
[ROW][C]Coll,:M-Oth,:H[/C][C]NA[/C][C]NA[/C][C]NA[/C][C]NA[/C][/ROW]
[ROW][C]Der,:M-Oth,:H[/C][C]381868.875[/C][C]-338154.885[/C][C]1101892.635[/C][C]0.808[/C][/ROW]
[ROW][C]Oth,:M-Oth,:H[/C][C]58875.167[/C][C]-580236.186[/C][C]697986.519[/C][C]1[/C][/ROW]
[ROW][C]Coll,:T-Oth,:H[/C][C]NA[/C][C]NA[/C][C]NA[/C][C]NA[/C][/ROW]
[ROW][C]Der,:T-Oth,:H[/C][C]2234[/C][C]-576686.885[/C][C]581154.885[/C][C]1[/C][/ROW]
[ROW][C]Oth,:T-Oth,:H[/C][C]-59961.5[/C][C]-1741574.711[/C][C]1621651.711[/C][C]1[/C][/ROW]
[ROW][C]Der,:M-Coll,:M[/C][C]NA[/C][C]NA[/C][C]NA[/C][C]NA[/C][/ROW]
[ROW][C]Oth,:M-Coll,:M[/C][C]NA[/C][C]NA[/C][C]NA[/C][C]NA[/C][/ROW]
[ROW][C]Coll,:T-Coll,:M[/C][C]NA[/C][C]NA[/C][C]NA[/C][C]NA[/C][/ROW]
[ROW][C]Der,:T-Coll,:M[/C][C]NA[/C][C]NA[/C][C]NA[/C][C]NA[/C][/ROW]
[ROW][C]Oth,:T-Coll,:M[/C][C]NA[/C][C]NA[/C][C]NA[/C][C]NA[/C][/ROW]
[ROW][C]Oth,:M-Der,:M[/C][C]-322993.708[/C][C]-1064515.434[/C][C]418528.018[/C][C]0.939[/C][/ROW]
[ROW][C]Coll,:T-Der,:M[/C][C]NA[/C][C]NA[/C][C]NA[/C][C]NA[/C][/ROW]
[ROW][C]Der,:T-Der,:M[/C][C]-379634.875[/C][C]-1069954.034[/C][C]310684.284[/C][C]0.771[/C][/ROW]
[ROW][C]Oth,:T-Der,:M[/C][C]-441830.375[/C][C]-2164971.153[/C][C]1281310.403[/C][C]0.999[/C][/ROW]
[ROW][C]Coll,:T-Oth,:M[/C][C]NA[/C][C]NA[/C][C]NA[/C][C]NA[/C][/ROW]
[ROW][C]Der,:T-Oth,:M[/C][C]-56641.167[/C][C]-662091.121[/C][C]548808.787[/C][C]1[/C][/ROW]
[ROW][C]Oth,:T-Oth,:M[/C][C]-118836.667[/C][C]-1809766.365[/C][C]1572093.032[/C][C]1[/C][/ROW]
[ROW][C]Der,:T-Coll,:T[/C][C]NA[/C][C]NA[/C][C]NA[/C][C]NA[/C][/ROW]
[ROW][C]Oth,:T-Coll,:T[/C][C]NA[/C][C]NA[/C][C]NA[/C][C]NA[/C][/ROW]
[ROW][C]Oth,:T-Der,:T[/C][C]-62195.5[/C][C]-1731305.837[/C][C]1606914.837[/C][C]1[/C][/ROW]
[/TABLE]
Source: https://freestatistics.org/blog/index.php?pk=310704&T=3
Globally Unique Identifier (entire table): ba.freestatistics.org/blog/index.php?pk=310704&T=3
As an alternative you can also use a QR Code:
The GUIDs for individual cells are displayed in the table below:
| Tukey Honest Significant Difference Comparisons | | | diff | lwr | upr | p adj | | Der,-Coll, | 144476.543 | -1019517.377 | 1308470.463 | 0.952 | | Oth,-Coll, | 83684.097 | -1082393.968 | 1249762.162 | 0.984 | | Oth,-Der, | -60792.446 | -343860.32 | 222275.427 | 0.864 | | H-E | 48893.617 | -532402.703 | 630189.937 | 0.996 | | M-E | 252734.654 | -334756.829 | 840226.136 | 0.668 | | T-E | 30346.691 | -560701.786 | 621395.168 | 0.999 | | M-H | 203841.036 | -186104.39 | 593786.463 | 0.515 | | T-H | -18546.926 | -413830.995 | 376737.143 | 0.999 | | T-M | -222387.963 | -626727.332 | 181951.406 | 0.471 | | Der,:E-Coll,:E | NA | NA | NA | NA | | Oth,:E-Coll,:E | NA | NA | NA | NA | | Coll,:H-Coll,:E | NA | NA | NA | NA | | Der,:H-Coll,:E | NA | NA | NA | NA | | Oth,:H-Coll,:E | NA | NA | NA | NA | | Coll,:M-Coll,:E | NA | NA | NA | NA | | Der,:M-Coll,:E | NA | NA | NA | NA | | Oth,:M-Coll,:E | NA | NA | NA | NA | | Coll,:T-Coll,:E | NA | NA | NA | NA | | Der,:T-Coll,:E | NA | NA | NA | NA | | Oth,:T-Coll,:E | NA | NA | NA | NA | | Oth,:E-Der,:E | -20114 | -1427052.553 | 1386824.553 | 1 | | Coll,:H-Der,:E | -17254 | -2006965.584 | 1972457.584 | 1 | | Der,:H-Der,:E | -11473.857 | -1314045.849 | 1291098.135 | 1 | | Oth,:H-Der,:E | 55305.5 | -1172771.151 | 1283382.151 | 1 | | Coll,:M-Der,:E | NA | NA | NA | NA | | Der,:M-Der,:E | 437174.375 | -847178.93 | 1721527.68 | 0.99 | | Oth,:M-Der,:E | 114180.667 | -1126622.507 | 1354983.841 | 1 | | Coll,:T-Der,:E | NA | NA | NA | NA | | Der,:T-Der,:E | 57539.5 | -1153360.408 | 1268439.408 | 1 | | Oth,:T-Der,:E | -4656 | -1994367.584 | 1985055.584 | 1 | | Coll,:H-Oth,:E | 2860 | -1813489.862 | 1819209.862 | 1 | | Der,:H-Oth,:E | 8640.143 | -1009627.224 | 1026907.509 | 1 | | Oth,:H-Oth,:E | 75419.5 | -845637.988 | 996476.988 | 1 | | Coll,:M-Oth,:E | NA | NA | NA | NA | | Der,:M-Oth,:E | 457288.375 | -537567.417 | 1452144.167 | 0.914 | | Oth,:M-Oth,:E | 134294.667 | -803664.369 | 1072253.702 | 1 | | Coll,:T-Oth,:E | NA | NA | NA | NA | | Der,:T-Oth,:E | 77653.5 | -820373.907 | 975680.907 | 1 | | Oth,:T-Oth,:E | 15458 | -1800891.862 | 1831807.862 | 1 | | Der,:H-Coll,:H | 5780.143 | -1730982.513 | 1742542.799 | 1 | | Oth,:H-Coll,:H | 72559.5 | -1609053.711 | 1754172.711 | 1 | | Coll,:M-Coll,:H | NA | NA | NA | NA | | Der,:M-Coll,:H | 454428.375 | -1268712.403 | 2177569.153 | 0.999 | | Oth,:M-Coll,:H | 131434.667 | -1559495.032 | 1822364.365 | 1 | | Coll,:T-Coll,:H | NA | NA | NA | NA | | Der,:T-Coll,:H | 74793.5 | -1594316.837 | 1743903.837 | 1 | | Oth,:T-Coll,:H | 12598 | -2284923.037 | 2310119.037 | 1 | | Oth,:H-Der,:H | 66779.357 | -685260.933 | 818819.647 | 1 | | Coll,:M-Der,:H | NA | NA | NA | NA | | Der,:M-Der,:H | 448648.232 | -392158.373 | 1289454.837 | 0.802 | | Oth,:M-Der,:H | 125654.524 | -646993.425 | 898302.473 | 1 | | Coll,:T-Der,:H | NA | NA | NA | NA | | Der,:T-Der,:H | 69013.357 | -654637.749 | 792664.464 | 1 | | Oth,:T-Der,:H | 6817.857 | -1729944.799 | 1743580.513 | 1 | | Coll,:M-Oth,:H | NA | NA | NA | NA | | Der,:M-Oth,:H | 381868.875 | -338154.885 | 1101892.635 | 0.808 | | Oth,:M-Oth,:H | 58875.167 | -580236.186 | 697986.519 | 1 | | Coll,:T-Oth,:H | NA | NA | NA | NA | | Der,:T-Oth,:H | 2234 | -576686.885 | 581154.885 | 1 | | Oth,:T-Oth,:H | -59961.5 | -1741574.711 | 1621651.711 | 1 | | Der,:M-Coll,:M | NA | NA | NA | NA | | Oth,:M-Coll,:M | NA | NA | NA | NA | | Coll,:T-Coll,:M | NA | NA | NA | NA | | Der,:T-Coll,:M | NA | NA | NA | NA | | Oth,:T-Coll,:M | NA | NA | NA | NA | | Oth,:M-Der,:M | -322993.708 | -1064515.434 | 418528.018 | 0.939 | | Coll,:T-Der,:M | NA | NA | NA | NA | | Der,:T-Der,:M | -379634.875 | -1069954.034 | 310684.284 | 0.771 | | Oth,:T-Der,:M | -441830.375 | -2164971.153 | 1281310.403 | 0.999 | | Coll,:T-Oth,:M | NA | NA | NA | NA | | Der,:T-Oth,:M | -56641.167 | -662091.121 | 548808.787 | 1 | | Oth,:T-Oth,:M | -118836.667 | -1809766.365 | 1572093.032 | 1 | | Der,:T-Coll,:T | NA | NA | NA | NA | | Oth,:T-Coll,:T | NA | NA | NA | NA | | Oth,:T-Der,:T | -62195.5 | -1731305.837 | 1606914.837 | 1 |
If you paste this QR Code into your document, anyone with a smartphone or tablet will be able to scan it and view this table in a browser.
If you paste this QR Code into your document, anyone with a smartphone or tablet will be able to scan it and view this table in a browser.
If you paste this QR Code into your document, anyone with a smartphone or tablet will be able to scan it and view this table in a browser.
If you paste this QR Code into your document, anyone with a smartphone or tablet will be able to scan it and view this table in a browser.
If you paste this QR Code into your document, anyone with a smartphone or tablet will be able to scan it and view this table in a browser.
| Levenes Test for Homogeneity of Variance | | | Df | F value | Pr(>F) | | Group | 8 | 0.594 | 0.779 | | | 58 | | |
\begin{tabular}{lllllllll}
\hline
Levenes Test for Homogeneity of Variance \tabularnewline
  & Df & F value & Pr(>F) \tabularnewline
Group & 8 & 0.594 & 0.779 \tabularnewline
  & 58 &   &   \tabularnewline
\hline
\end{tabular}
%Source: https://freestatistics.org/blog/index.php?pk=310704&T=4
[TABLE]
[ROW][C]Levenes Test for Homogeneity of Variance[/C][/ROW]
[ROW][C] [/C][C]Df[/C][C]F value[/C][C]Pr(>F)[/C][/ROW]
[ROW][C]Group[/C][C]8[/C][C]0.594[/C][C]0.779[/C][/ROW]
[ROW][C] [/C][C]58[/C][C] [/C][C] [/C][/ROW]
[/TABLE]
Source: https://freestatistics.org/blog/index.php?pk=310704&T=4
Globally Unique Identifier (entire table): ba.freestatistics.org/blog/index.php?pk=310704&T=4
As an alternative you can also use a QR Code:
The GUIDs for individual cells are displayed in the table below:
| Levenes Test for Homogeneity of Variance | | | Df | F value | Pr(>F) | | Group | 8 | 0.594 | 0.779 | | | 58 | | |
If you paste this QR Code into your document, anyone with a smartphone or tablet will be able to scan it and view this table in a browser.
If you paste this QR Code into your document, anyone with a smartphone or tablet will be able to scan it and view this table in a browser.
If you paste this QR Code into your document, anyone with a smartphone or tablet will be able to scan it and view this table in a browser.
If you paste this QR Code into your document, anyone with a smartphone or tablet will be able to scan it and view this table in a browser.
If you paste this QR Code into your document, anyone with a smartphone or tablet will be able to scan it and view this table in a browser.
|