Free Statistics

of Irreproducible Research!

Author's title

Author*The author of this computation has been verified*
R Software Modulerwasp_Simple Regression Y ~ X.wasp
Title produced by softwareSimple Linear Regression
Date of computationThu, 21 Dec 2017 20:45:45 +0100
Cite this page as followsStatistical Computations at FreeStatistics.org, Office for Research Development and Education, URL https://freestatistics.org/blog/index.php?v=date/2017/Dec/21/t15138856556zu9dxncr0ncqqf.htm/, Retrieved Tue, 14 May 2024 23:52:17 +0000
Statistical Computations at FreeStatistics.org, Office for Research Development and Education, URL https://freestatistics.org/blog/index.php?pk=310703, Retrieved Tue, 14 May 2024 23:52:17 +0000
QR Codes:

Original text written by user:
IsPrivate?No (this computation is public)
User-defined keywordsDataset2
Estimated Impact70
Family? (F = Feedback message, R = changed R code, M = changed R Module, P = changed Parameters, D = changed Data)
-       [Simple Linear Regression] [Simple Regression] [2017-12-21 19:45:45] [02e100d22760f9e09756a00c2eb0ef89] [Current]
Feedback Forum

Post a new message
Dataseries X:
16778	4.7601339
37455	40.952621
23342	25.8886442
32921	28.4854246
13231	4.7239915
17853	10.0468284
15488	9.6564885
17893	19.8357549
31080	24.0897389
22235	11.3879004
19146	1.3547237
11157	1.4117647
10987	26.719057
12741	2.6600166
20254	18.2923381
36099	50.5309505
20623	14.2857143
37922	34.5549738
16615	10.3820598
14048	2.9233871
30391	63.8549618
30625	32.8571429
16616	6.088993
32602	44.1001565
28375	16.8509509
22005	10.2691511
25563	34.5857854
27384	34.9884906
22719	7.0931245
22968	14.0077821
22085	26.8161872
21769	17.2743574
16558	5.7256583
18843	17.0362358
22105	17.5059952
35827	38.0767739
25130	16.5820137
27031	35.8902001
14746	10.6990014
22409	19.8029891
14816	25.940902
21264	67.4125874
21667	20.0720072
38593	42.3807081
16218	10.933759
22833	16.084788
21474	25.8240183
30491	26.7043669
25286	14.7312269
17194	5.0132928
33954	40.3954214
15523	10.2955195
25949	20.380117
25043	9.0437601
41676	55.2548489
18376	7.1504237
21610	12.5731679
23926	15.356292
14995	18.2336182
32142	56.5535024
15373	10.0675676
20248	19.2909897
17225	3.5338785
19978	6.139805
18995	2.2668394
14256	12.9396985
86023	82.8070175
14560	8.3226633
28125	22.6443265
20407	15.1658768
28556	21.4598953
11805	6.1581248
14678	11.1402359
26916	10.0328947
25998	56.8033429
23205	38.05374
17695	16.94018
22441	17.9372197
19599	11.7980072
27813	17.1770432
20428	21.1139241
16689	7.8923358
22080	21.3943194
21845	19.5180723
21626	14.2030276
24749	20.1200343
39122	39.2834891
12109	9.1324201
20610	20.7425343
29488	21.2507778
18370	20.2991453
24348	14.1363636
19598	16.5626027
18257	10.8970831
19031	19.7846568
21858	10.559723
51186	52.7176781
20027	22.6814777
29881	42.4964937
34698	42.2256775
21868	17.2319475
26667	20.5354678
21170	16.2601626
42931	66.2311147
35788	51.0619469
31274	52.0915354
14177	6.5584416
33294	38.8998035
22472	20.2439778
25799	38.0490588
21344	10.9860116
21109	26.1888814
18438	13.2780083
30061	52.6623377
23883	14.7076372
23944	14.025974
15656	10.2324177
26928	38.5287202
31009	31.5638907
35008	34.819491


Summary of computational transaction
Raw Input view raw input (R code)
Raw Outputview raw output of R engine
Computing time7 seconds
R ServerBig Analytics Cloud Computing Center

\begin{tabular}{lllllllll}
\hline
Summary of computational transaction \tabularnewline
Raw Input view raw input (R code)  \tabularnewline
Raw Outputview raw output of R engine  \tabularnewline
Computing time7 seconds \tabularnewline
R ServerBig Analytics Cloud Computing Center \tabularnewline
\hline
\end{tabular}
%Source: https://freestatistics.org/blog/index.php?pk=310703&T=0

[TABLE]
[ROW]
Summary of computational transaction[/C][/ROW] [ROW]Raw Input[/C] view raw input (R code) [/C][/ROW] [ROW]Raw Output[/C]view raw output of R engine [/C][/ROW] [ROW]Computing time[/C]7 seconds[/C][/ROW] [ROW]R Server[/C]Big Analytics Cloud Computing Center[/C][/ROW] [/TABLE] Source: https://freestatistics.org/blog/index.php?pk=310703&T=0

Globally Unique Identifier (entire table): ba.freestatistics.org/blog/index.php?pk=310703&T=0

As an alternative you can also use a QR Code:  

The GUIDs for individual cells are displayed in the table below:

Summary of computational transaction
Raw Input view raw input (R code)
Raw Outputview raw output of R engine
Computing time7 seconds
R ServerBig Analytics Cloud Computing Center


Linear Regression Model
Y ~ X
coefficients:
EstimateStd. Errort valuePr(>|t|)
(Intercept)13848.272943.57614.6760
X446.77833.82113.210
- - -
Residual Std. Err. 6003.666 on 118 df
Multiple R-sq. 0.597
95% CI Multiple R-sq. [0.402, 0.704]
Adjusted R-sq. 0.593

\begin{tabular}{lllllllll}
\hline
Linear Regression Model \tabularnewline
Y ~ X \tabularnewline
coefficients: &   \tabularnewline
  & Estimate & Std. Error & t value & Pr(>|t|) \tabularnewline
(Intercept) & 13848.272 & 943.576 & 14.676 & 0 \tabularnewline
X & 446.778 & 33.821 & 13.21 & 0 \tabularnewline
- - -  &   \tabularnewline
Residual Std. Err.  & 6003.666  on  118 df \tabularnewline
Multiple R-sq.  & 0.597 \tabularnewline
95% CI Multiple R-sq.  & [0.402, 0.704] \tabularnewline
Adjusted R-sq.  & 0.593 \tabularnewline
\hline
\end{tabular}
%Source: https://freestatistics.org/blog/index.php?pk=310703&T=1

[TABLE]
[ROW][C]Linear Regression Model[/C][/ROW]
[ROW][C]Y ~ X[/C][/ROW]
[ROW][C]coefficients:[/C][C] [/C][/ROW]
[ROW][C] [/C][C]Estimate[/C][C]Std. Error[/C][C]t value[/C][C]Pr(>|t|)[/C][/ROW]
[C](Intercept)[/C][C]13848.272[/C][C]943.576[/C][C]14.676[/C][C]0[/C][/ROW]
[C]X[/C][C]446.778[/C][C]33.821[/C][C]13.21[/C][C]0[/C][/ROW]
[ROW][C]- - - [/C][C] [/C][/ROW]
[ROW][C]Residual Std. Err. [/C][C]6003.666  on  118 df[/C][/ROW]
[ROW][C]Multiple R-sq. [/C][C]0.597[/C][/ROW]
[ROW][C]95% CI Multiple R-sq. [/C][C][0.402, 0.704][/C][/ROW]
[ROW][C]Adjusted R-sq. [/C][C]0.593[/C][/ROW]
[/TABLE]
Source: https://freestatistics.org/blog/index.php?pk=310703&T=1

Globally Unique Identifier (entire table): ba.freestatistics.org/blog/index.php?pk=310703&T=1

As an alternative you can also use a QR Code:  

The GUIDs for individual cells are displayed in the table below:

Linear Regression Model
Y ~ X
coefficients:
EstimateStd. Errort valuePr(>|t|)
(Intercept)13848.272943.57614.6760
X446.77833.82113.210
- - -
Residual Std. Err. 6003.666 on 118 df
Multiple R-sq. 0.597
95% CI Multiple R-sq. [0.402, 0.704]
Adjusted R-sq. 0.593


ANOVA Statistics
DfSum SqMean SqF valuePr(>F)
College(%)16289721315.6566289721315.656174.5010
Residuals1184253192657.13636044005.569

\begin{tabular}{lllllllll}
\hline
ANOVA Statistics \tabularnewline
  & Df & Sum Sq & Mean Sq & F value & Pr(>F) \tabularnewline
College(%) & 1 & 6289721315.656 & 6289721315.656 & 174.501 & 0 \tabularnewline
Residuals & 118 & 4253192657.136 & 36044005.569 &   &   \tabularnewline
\hline
\end{tabular}
%Source: https://freestatistics.org/blog/index.php?pk=310703&T=2

[TABLE]
[ROW][C]ANOVA Statistics[/C][/ROW]
[ROW][C] [/C][C]Df[/C][C]Sum Sq[/C][C]Mean Sq[/C][C]F value[/C][C]Pr(>F)[/C][/ROW]
[ROW][C]College(%)[/C][C]1[/C][C]6289721315.656[/C][C]6289721315.656[/C][C]174.501[/C][C]0[/C][/ROW]
[ROW][C]Residuals[/C][C]118[/C][C]4253192657.136[/C][C]36044005.569[/C][C] [/C][C] [/C][/ROW]
[/TABLE]
Source: https://freestatistics.org/blog/index.php?pk=310703&T=2

Globally Unique Identifier (entire table): ba.freestatistics.org/blog/index.php?pk=310703&T=2

As an alternative you can also use a QR Code:  

The GUIDs for individual cells are displayed in the table below:

ANOVA Statistics
DfSum SqMean SqF valuePr(>F)
College(%)16289721315.6566289721315.656174.5010
Residuals1184253192657.13636044005.569


Parameters (Session):
par1 = 1 ; par2 = 2 ; par3 = TRUE ;
Parameters (R input):
par1 = 1 ; par2 = 2 ; par3 = TRUE ;
R code (references can be found in the software module):
library(boot)
cat1 <- as.numeric(par1)
cat2<- as.numeric(par2)
intercept<-as.logical(par3)
x <- na.omit(t(x))
rsq <- function(formula, data, indices) {
d <- data[indices,] # allows boot to select sample
fit <- lm(formula, data=d)
return(summary(fit)$r.square)
}
xdf<-data.frame(na.omit(t(y)))
(V1<-dimnames(y)[[1]][cat1])
(V2<-dimnames(y)[[1]][cat2])
xdf <- data.frame(xdf[[cat1]], xdf[[cat2]])
names(xdf)<-c('Y', 'X')
if(intercept == FALSE) (lmxdf<-lm(Y~ X - 1, data = xdf) ) else (lmxdf<-lm(Y~ X, data = xdf) )
(results <- boot(data=xdf, statistic=rsq, R=1000, formula=Y~X))
sumlmxdf<-summary(lmxdf)
(aov.xdf<-aov(lmxdf) )
(anova.xdf<-anova(lmxdf) )
load(file='createtable')
a<-table.start()
nc <- ncol(sumlmxdf$'coefficients')
nr <- nrow(sumlmxdf$'coefficients')
a<-table.row.start(a)
a<-table.element(a,'Linear Regression Model', nc+1,TRUE)
a<-table.row.end(a)
a<-table.row.start(a)
a<-table.element(a, lmxdf$call['formula'],nc+1)
a<-table.row.end(a)
a<-table.row.start(a)
a<-table.element(a, 'coefficients:',1,TRUE)
a<-table.element(a, ' ',nc,TRUE)
a<-table.row.end(a)
a<-table.row.start(a)
a<-table.element(a, ' ',1,TRUE)
for(i in 1 : nc){
a<-table.element(a, dimnames(sumlmxdf$'coefficients')[[2]][i],1,TRUE)
}#end header
a<-table.row.end(a)
for(i in 1: nr){
a<-table.element(a,dimnames(sumlmxdf$'coefficients')[[1]][i] ,1,TRUE)
for(j in 1 : nc){
a<-table.element(a, round(sumlmxdf$coefficients[i, j], digits=3), 1 ,FALSE)
}
a<-table.row.end(a)
}
a<-table.row.start(a)
a<-table.element(a, '- - - ',1,TRUE)
a<-table.element(a, ' ',nc,FALSE)
a<-table.row.end(a)
a<-table.row.start(a)
a<-table.element(a, 'Residual Std. Err. ',1,TRUE)
a<-table.element(a, paste(round(sumlmxdf$'sigma', digits=3), ' on ', sumlmxdf$'df'[2], 'df') ,nc, FALSE)
a<-table.row.end(a)
a<-table.row.start(a)
a<-table.element(a, 'Multiple R-sq. ',1,TRUE)
a<-table.element(a, round(sumlmxdf$'r.squared', digits=3) ,nc, FALSE)
a<-table.row.end(a)
a<-table.row.start(a)
a<-table.element(a, '95% CI Multiple R-sq. ',1,TRUE)
a<-table.element(a, paste('[',round(boot.ci(results,type='bca')$bca[1,4], digits=3),', ', round(boot.ci(results,type='bca')$bca[1,5], digits=3), ']',sep='') ,nc, FALSE)
a<-table.row.end(a)
a<-table.row.start(a)
a<-table.element(a, 'Adjusted R-sq. ',1,TRUE)
a<-table.element(a, round(sumlmxdf$'adj.r.squared', digits=3) ,nc, FALSE)
a<-table.row.end(a)
a<-table.end(a)
table.save(a,file='mytable.tab')
a<-table.start()
a<-table.row.start(a)
a<-table.element(a,'ANOVA Statistics', 5+1,TRUE)
a<-table.row.end(a)
a<-table.row.start(a)
a<-table.element(a, ' ',1,TRUE)
a<-table.element(a, 'Df',1,TRUE)
a<-table.element(a, 'Sum Sq',1,TRUE)
a<-table.element(a, 'Mean Sq',1,TRUE)
a<-table.element(a, 'F value',1,TRUE)
a<-table.element(a, 'Pr(>F)',1,TRUE)
a<-table.row.end(a)
a<-table.row.start(a)
a<-table.element(a, V2,1,TRUE)
a<-table.element(a, anova.xdf$Df[1])
a<-table.element(a, round(anova.xdf$'Sum Sq'[1], digits=3))
a<-table.element(a, round(anova.xdf$'Mean Sq'[1], digits=3))
a<-table.element(a, round(anova.xdf$'F value'[1], digits=3))
a<-table.element(a, round(anova.xdf$'Pr(>F)'[1], digits=3))
a<-table.row.end(a)
a<-table.row.start(a)
a<-table.element(a, 'Residuals',1,TRUE)
a<-table.element(a, anova.xdf$Df[2])
a<-table.element(a, round(anova.xdf$'Sum Sq'[2], digits=3))
a<-table.element(a, round(anova.xdf$'Mean Sq'[2], digits=3))
a<-table.element(a, ' ')
a<-table.row.end(a)
a<-table.end(a)
table.save(a,file='mytable1.tab')
bitmap(file='regressionplot.png')
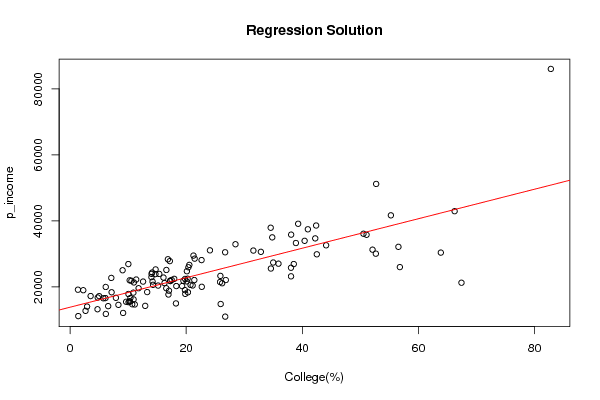
plot(Y~ X, data=xdf, xlab=V2, ylab=V1, main='Regression Solution')
if(intercept == TRUE) abline(coef(lmxdf), col='red')
if(intercept == FALSE) abline(0.0, coef(lmxdf), col='red')
dev.off()
library(car)
bitmap(file='residualsQQplot.png')
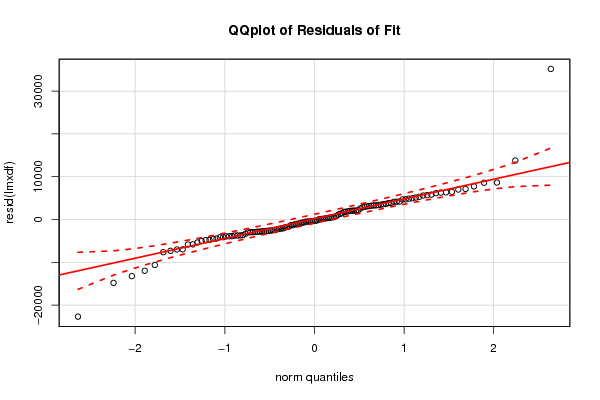
qqPlot(resid(lmxdf), main='QQplot of Residuals of Fit')
dev.off()
bitmap(file='residualsplot.png')
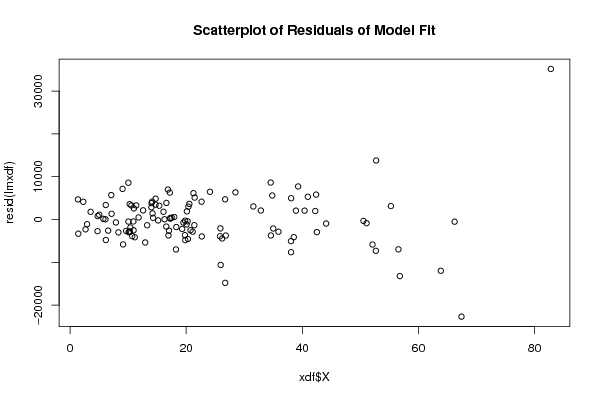
plot(xdf$X, resid(lmxdf), main='Scatterplot of Residuals of Model Fit')
dev.off()
bitmap(file='cooksDistanceLmplot.png')
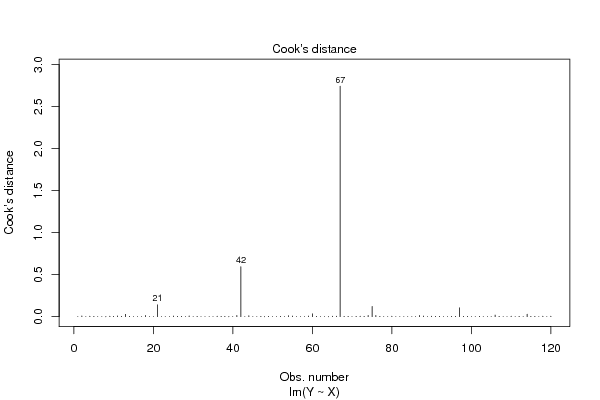
plot(lmxdf, which=4)
dev.off()