Free Statistics

of Irreproducible Research!

Author's title

Author*The author of this computation has been verified*
R Software Modulerwasp_twosampletests_mean.wasp
Title produced by softwarePaired and Unpaired Two Samples Tests about the Mean
Date of computationThu, 21 Dec 2017 19:13:45 +0100
Cite this page as followsStatistical Computations at FreeStatistics.org, Office for Research Development and Education, URL https://freestatistics.org/blog/index.php?v=date/2017/Dec/21/t1513880114ijsu72pqxwxjexa.htm/, Retrieved Tue, 14 May 2024 21:31:42 +0000
Statistical Computations at FreeStatistics.org, Office for Research Development and Education, URL https://freestatistics.org/blog/index.php?pk=310687, Retrieved Tue, 14 May 2024 21:31:42 +0000
QR Codes:

Original text written by user:
IsPrivate?No (this computation is public)
User-defined keywords
Estimated Impact57
Family? (F = Feedback message, R = changed R code, M = changed R Module, P = changed Parameters, D = changed Data)
-       [Paired and Unpaired Two Samples Tests about the Mean] [] [2017-12-21 18:13:45] [66c86581683e2f00c73209c38d9c4200] [Current]
Feedback Forum

Post a new message
Dataseries X:
12456	6269
100	-40
7683	3462
102	64
219	51
149	41
277	119
272	252
224	257
194	177
113	85
45	11
165	154
196	5
197	79
87	-40
289	37
142	100
159	125
127	-57
59	98
142	82
297	210
189	-17
82	294
123	194
230	231
106	75
160	93
208	28
120	99
3479	3071
94	182
112	122
163	90
160	10
374	306
333	339
1177	1142
205	42
117	152
156	185
78	86
206	72
304	343
4329	2554
131	119
29	32
211	188
188	78
91	107
373	335
85	33
218	72
65	39
96	-83
224	117
95	73
147	170
128	2
86	94
90	-16
348	117
152	139
112	140
175	75
110	88
134	56
501	502
87	1
117	70
205	-17
131	23
6584	5013
410	304
212	247
19	9
403	574
80	32
86	26
415	288
441	391
52	-25
119	189
121	79
72	12
139	184
193	111
212	371
170	183
187	17
146	148
255	65
44	-15
327	246
108	20
154	142
579	636
396	351
219	172
110	127
74	85
115	-56
35	-30
161	60
201	71
131	-51
75	0
123	50
4759	3143
253	125
80	-54
51	17
99	104
88	64
114	90
89	46
224	74
56	67
131	146
220	159
63	16
84	-15
91	19
74	-124
69	-15
181	265
139	-25
1172	1003
131	64
109	122
147	185
203	339
325	180
123	23
64	82
79	68
166	91
94	6
40	21
2333	800
144	102
147	252
1024	134
115	38
101	82
225	157
169	17
211	75
15	57
182	-114
545	220
174	168
117	-9
79	-17
141	67
34	11
1016	76
314	55
13	-5
189	-20
188	160
115	-62
72	-43
82	8
43	-17
2964	1352
127	-44
104	89
129	-23
293	147
804	230
126	79
48	22
339	235
372	265
344	166
256	177
22	9
1365	798
176	225
118	170
149	5
112	-76
641	394
90	46
79	34
1527	1045
92	-9
99	0
276	40
84	77
92	72
108	66
660	658
116	141
936	231
70	4
97	23
88	77
73	-21
75	32
219	142
86	48
136	-51
92	-23
435	182
60	33
80	104
108	20
68	-28
119	53
2665	1700
869	530
210	148
268	68
173	145
148	55
141	50
355	395
80	61
260	238
161	10
1942	1059
131	27
121	64
451	216
268	65
115	5
196	223
100	13
243	260
100	55
217	131
753	540
107	52
205	147
53	60
206	98
45	-30
137	213
5818	3589
187	78
316	239
76	131
152	115
336	307
103	91
3209	2054
65	50
175	103
63	2
121	132
223	264
55	31
95	-82
113	39
120	-41
45	-16
83	10
59	5
59	-42
163	119
1155	322
58	-79
284	-18
287	167
81	-5
120	10
59	2
67	73
15	28
56	13
52	72
76	59
2677	2255
442	373
163	48
500	431
170	48
900	820
166	214
336	321
4075	2203
88	46
521	462
179	180
622	295
63	17
97	-55
691	439
103	86
166	168
150	59
67	76
105	21
338	11
171	114
206	-7
75	31
102	115
331	145
2311	898
123	32
173	126
95	-32
331	39
242	100
164	159
153	299
159	115
128	71
138	-18
310	9
120	-25
175	23
1868	887
88	39
302	322
94	89
65	20
0	0
73	66
65	0
243	7
159	20
291	145
53	32
406	117


Summary of computational transaction
Raw Input view raw input (R code)
Raw Outputview raw output of R engine
Computing time1 seconds
R ServerBig Analytics Cloud Computing Center

\begin{tabular}{lllllllll}
\hline
Summary of computational transaction \tabularnewline
Raw Input view raw input (R code)  \tabularnewline
Raw Outputview raw output of R engine  \tabularnewline
Computing time1 seconds \tabularnewline
R ServerBig Analytics Cloud Computing Center \tabularnewline
\hline
\end{tabular}
%Source: https://freestatistics.org/blog/index.php?pk=310687&T=0

[TABLE]
[ROW]
Summary of computational transaction[/C][/ROW] [ROW]Raw Input[/C] view raw input (R code) [/C][/ROW] [ROW]Raw Output[/C]view raw output of R engine [/C][/ROW] [ROW]Computing time[/C]1 seconds[/C][/ROW] [ROW]R Server[/C]Big Analytics Cloud Computing Center[/C][/ROW] [/TABLE] Source: https://freestatistics.org/blog/index.php?pk=310687&T=0

Globally Unique Identifier (entire table): ba.freestatistics.org/blog/index.php?pk=310687&T=0

As an alternative you can also use a QR Code:  

The GUIDs for individual cells are displayed in the table below:

Summary of computational transaction
Raw Input view raw input (R code)
Raw Outputview raw output of R engine
Computing time1 seconds
R ServerBig Analytics Cloud Computing Center


Two Sample t-test (unpaired)
Mean of Sample 1401.079027355623
Mean of Sample 2232.170212765957
t-stat2.43586094820758
df656
p-value0.0151215655507526
H0 value0
Alternativetwo.sided
CI Level0.95
CI[32.7486933489141,305.068935830417]
F-test to compare two variances
F-stat2.91922443496084
df328
p-value0
H0 value1
Alternativetwo.sided
CI Level0.95
CI[2.35019781860225,3.62602298164873]

\begin{tabular}{lllllllll}
\hline
Two Sample t-test (unpaired) \tabularnewline
Mean of Sample 1 & 401.079027355623 \tabularnewline
Mean of Sample 2 & 232.170212765957 \tabularnewline
t-stat & 2.43586094820758 \tabularnewline
df & 656 \tabularnewline
p-value & 0.0151215655507526 \tabularnewline
H0 value & 0 \tabularnewline
Alternative & two.sided \tabularnewline
CI Level & 0.95 \tabularnewline
CI & [32.7486933489141,305.068935830417] \tabularnewline
F-test to compare two variances \tabularnewline
F-stat & 2.91922443496084 \tabularnewline
df & 328 \tabularnewline
p-value & 0 \tabularnewline
H0 value & 1 \tabularnewline
Alternative & two.sided \tabularnewline
CI Level & 0.95 \tabularnewline
CI & [2.35019781860225,3.62602298164873] \tabularnewline
\hline
\end{tabular}
%Source: https://freestatistics.org/blog/index.php?pk=310687&T=1

[TABLE]
[ROW][C]Two Sample t-test (unpaired)[/C][/ROW]
[ROW][C]Mean of Sample 1[/C][C]401.079027355623[/C][/ROW]
[ROW][C]Mean of Sample 2[/C][C]232.170212765957[/C][/ROW]
[ROW][C]t-stat[/C][C]2.43586094820758[/C][/ROW]
[ROW][C]df[/C][C]656[/C][/ROW]
[ROW][C]p-value[/C][C]0.0151215655507526[/C][/ROW]
[ROW][C]H0 value[/C][C]0[/C][/ROW]
[ROW][C]Alternative[/C][C]two.sided[/C][/ROW]
[ROW][C]CI Level[/C][C]0.95[/C][/ROW]
[ROW][C]CI[/C][C][32.7486933489141,305.068935830417][/C][/ROW]
[ROW][C]F-test to compare two variances[/C][/ROW]
[ROW][C]F-stat[/C][C]2.91922443496084[/C][/ROW]
[ROW][C]df[/C][C]328[/C][/ROW]
[ROW][C]p-value[/C][C]0[/C][/ROW]
[ROW][C]H0 value[/C][C]1[/C][/ROW]
[ROW][C]Alternative[/C][C]two.sided[/C][/ROW]
[ROW][C]CI Level[/C][C]0.95[/C][/ROW]
[ROW][C]CI[/C][C][2.35019781860225,3.62602298164873][/C][/ROW]
[/TABLE]
Source: https://freestatistics.org/blog/index.php?pk=310687&T=1

Globally Unique Identifier (entire table): ba.freestatistics.org/blog/index.php?pk=310687&T=1

As an alternative you can also use a QR Code:  

The GUIDs for individual cells are displayed in the table below:

Two Sample t-test (unpaired)
Mean of Sample 1401.079027355623
Mean of Sample 2232.170212765957
t-stat2.43586094820758
df656
p-value0.0151215655507526
H0 value0
Alternativetwo.sided
CI Level0.95
CI[32.7486933489141,305.068935830417]
F-test to compare two variances
F-stat2.91922443496084
df328
p-value0
H0 value1
Alternativetwo.sided
CI Level0.95
CI[2.35019781860225,3.62602298164873]


Welch Two Sample t-test (unpaired)
Mean of Sample 1401.079027355623
Mean of Sample 2232.170212765957
t-stat2.43586094820758
df529.117109091566
p-value0.0151854022000364
H0 value0
Alternativetwo.sided
CI Level0.95
CI[32.6883156784254,305.129313500906]

\begin{tabular}{lllllllll}
\hline
Welch Two Sample t-test (unpaired) \tabularnewline
Mean of Sample 1 & 401.079027355623 \tabularnewline
Mean of Sample 2 & 232.170212765957 \tabularnewline
t-stat & 2.43586094820758 \tabularnewline
df & 529.117109091566 \tabularnewline
p-value & 0.0151854022000364 \tabularnewline
H0 value & 0 \tabularnewline
Alternative & two.sided \tabularnewline
CI Level & 0.95 \tabularnewline
CI & [32.6883156784254,305.129313500906] \tabularnewline
\hline
\end{tabular}
%Source: https://freestatistics.org/blog/index.php?pk=310687&T=2

[TABLE]
[ROW][C]Welch Two Sample t-test (unpaired)[/C][/ROW]
[ROW][C]Mean of Sample 1[/C][C]401.079027355623[/C][/ROW]
[ROW][C]Mean of Sample 2[/C][C]232.170212765957[/C][/ROW]
[ROW][C]t-stat[/C][C]2.43586094820758[/C][/ROW]
[ROW][C]df[/C][C]529.117109091566[/C][/ROW]
[ROW][C]p-value[/C][C]0.0151854022000364[/C][/ROW]
[ROW][C]H0 value[/C][C]0[/C][/ROW]
[ROW][C]Alternative[/C][C]two.sided[/C][/ROW]
[ROW][C]CI Level[/C][C]0.95[/C][/ROW]
[ROW][C]CI[/C][C][32.6883156784254,305.129313500906][/C][/ROW]
[/TABLE]
Source: https://freestatistics.org/blog/index.php?pk=310687&T=2

Globally Unique Identifier (entire table): ba.freestatistics.org/blog/index.php?pk=310687&T=2

As an alternative you can also use a QR Code:  

The GUIDs for individual cells are displayed in the table below:

Welch Two Sample t-test (unpaired)
Mean of Sample 1401.079027355623
Mean of Sample 2232.170212765957
t-stat2.43586094820758
df529.117109091566
p-value0.0151854022000364
H0 value0
Alternativetwo.sided
CI Level0.95
CI[32.6883156784254,305.129313500906]


Wilcoxon Rank-Sum Test (Mann–Whitney U test) with continuity correction (unpaired)
W73598
p-value1.36316902725661e-15
H0 value0
Alternativetwo.sided
Kolmogorov-Smirnov Test to compare Distributions of two Samples
KS Statistic0.343465045592705
p-value0
Kolmogorov-Smirnov Test to compare Distributional Shape of two Samples
KS Statistic0.449848024316109
p-value0

\begin{tabular}{lllllllll}
\hline
Wilcoxon Rank-Sum Test (Mann–Whitney U test) with continuity correction (unpaired) \tabularnewline
W & 73598 \tabularnewline
p-value & 1.36316902725661e-15 \tabularnewline
H0 value & 0 \tabularnewline
Alternative & two.sided \tabularnewline
Kolmogorov-Smirnov Test to compare Distributions of two Samples \tabularnewline
KS Statistic & 0.343465045592705 \tabularnewline
p-value & 0 \tabularnewline
Kolmogorov-Smirnov Test to compare Distributional Shape of two Samples \tabularnewline
KS Statistic & 0.449848024316109 \tabularnewline
p-value & 0 \tabularnewline
\hline
\end{tabular}
%Source: https://freestatistics.org/blog/index.php?pk=310687&T=3

[TABLE]
[ROW][C]Wilcoxon Rank-Sum Test (Mann–Whitney U test) with continuity correction (unpaired)[/C][/ROW]
[ROW][C]W[/C][C]73598[/C][/ROW]
[ROW][C]p-value[/C][C]1.36316902725661e-15[/C][/ROW]
[ROW][C]H0 value[/C][C]0[/C][/ROW]
[ROW][C]Alternative[/C][C]two.sided[/C][/ROW]
[ROW][C]Kolmogorov-Smirnov Test to compare Distributions of two Samples[/C][/ROW]
[ROW][C]KS Statistic[/C][C]0.343465045592705[/C][/ROW]
[ROW][C]p-value[/C][C]0[/C][/ROW]
[ROW][C]Kolmogorov-Smirnov Test to compare Distributional Shape of two Samples[/C][/ROW]
[ROW][C]KS Statistic[/C][C]0.449848024316109[/C][/ROW]
[ROW][C]p-value[/C][C]0[/C][/ROW]
[/TABLE]
Source: https://freestatistics.org/blog/index.php?pk=310687&T=3

Globally Unique Identifier (entire table): ba.freestatistics.org/blog/index.php?pk=310687&T=3

As an alternative you can also use a QR Code:  

The GUIDs for individual cells are displayed in the table below:

Wilcoxon Rank-Sum Test (Mann–Whitney U test) with continuity correction (unpaired)
W73598
p-value1.36316902725661e-15
H0 value0
Alternativetwo.sided
Kolmogorov-Smirnov Test to compare Distributions of two Samples
KS Statistic0.343465045592705
p-value0
Kolmogorov-Smirnov Test to compare Distributional Shape of two Samples
KS Statistic0.449848024316109
p-value0


Parameters (Session):
par1 = 1 ; par2 = 2 ; par3 = 0.95 ; par4 = two.sided ; par5 = unpaired ; par6 = 0.0 ;
Parameters (R input):
par1 = 1 ; par2 = 2 ; par3 = 0.95 ; par4 = two.sided ; par5 = unpaired ; par6 = 0.0 ;
R code (references can be found in the software module):
par1 <- as.numeric(par1) #column number of first sample
par2 <- as.numeric(par2) #column number of second sample
par3 <- as.numeric(par3) #confidence (= 1 - alpha)
if (par5 == 'unpaired') paired <- FALSE else paired <- TRUE
par6 <- as.numeric(par6) #H0
z <- t(y)
if (par1 == par2) stop('Please, select two different column numbers')
if (par1 < 1) stop('Please, select a column number greater than zero for the first sample')
if (par2 < 1) stop('Please, select a column number greater than zero for the second sample')
if (par1 > length(z[1,])) stop('The column number for the first sample should be smaller')
if (par2 > length(z[1,])) stop('The column number for the second sample should be smaller')
if (par3 <= 0) stop('The confidence level should be larger than zero')
if (par3 >= 1) stop('The confidence level should be smaller than zero')
(r.t <- t.test(z[,par1],z[,par2],var.equal=TRUE,alternative=par4,paired=paired,mu=par6,conf.level=par3))
(v.t <- var.test(z[,par1],z[,par2],conf.level=par3))
(r.w <- t.test(z[,par1],z[,par2],var.equal=FALSE,alternative=par4,paired=paired,mu=par6,conf.level=par3))
(w.t <- wilcox.test(z[,par1],z[,par2],alternative=par4,paired=paired,mu=par6,conf.level=par3))
(ks.t <- ks.test(z[,par1],z[,par2],alternative=par4))
m1 <- mean(z[,par1],na.rm=T)
m2 <- mean(z[,par2],na.rm=T)
mdiff <- m1 - m2
newsam1 <- z[!is.na(z[,par1]),par1]
newsam2 <- z[,par2]+mdiff
newsam2 <- newsam2[!is.na(newsam2)]
(ks1.t <- ks.test(newsam1,newsam2,alternative=par4))
mydf <- data.frame(cbind(z[,par1],z[,par2]))
colnames(mydf) <- c('Variable 1','Variable 2')
bitmap(file='test1.png')
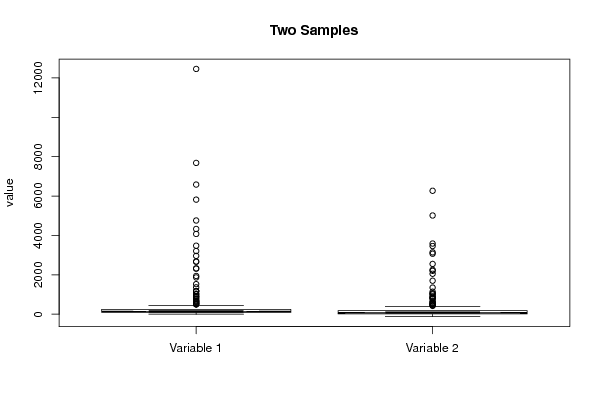
boxplot(mydf, notch=TRUE, ylab='value',main=main)
dev.off()
bitmap(file='test2.png')
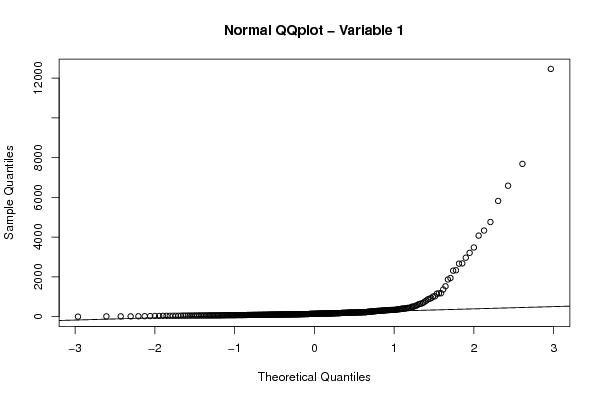
qqnorm(z[,par1],main='Normal QQplot - Variable 1')
qqline(z[,par1])
dev.off()
bitmap(file='test3.png')
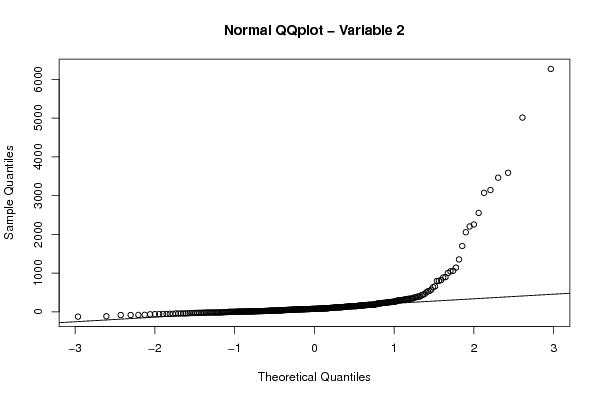
qqnorm(z[,par2],main='Normal QQplot - Variable 2')
qqline(z[,par2])
dev.off()
load(file='createtable')
a<-table.start()
a<-table.row.start(a)
a<-table.element(a,paste('Two Sample t-test (',par5,')',sep=''),2,TRUE)
a<-table.row.end(a)
if(!paired){
a<-table.row.start(a)
a<-table.element(a,'Mean of Sample 1',header=TRUE)
a<-table.element(a,r.t$estimate[[1]])
a<-table.row.end(a)
a<-table.row.start(a)
a<-table.element(a,'Mean of Sample 2',header=TRUE)
a<-table.element(a,r.t$estimate[[2]])
a<-table.row.end(a)
} else {
a<-table.row.start(a)
a<-table.element(a,'Difference: Mean1 - Mean2',header=TRUE)
a<-table.element(a,r.t$estimate)
a<-table.row.end(a)
}
a<-table.row.start(a)
a<-table.element(a,'t-stat',header=TRUE)
a<-table.element(a,r.t$statistic[[1]])
a<-table.row.end(a)
a<-table.row.start(a)
a<-table.element(a,'df',header=TRUE)
a<-table.element(a,r.t$parameter[[1]])
a<-table.row.end(a)
a<-table.row.start(a)
a<-table.element(a,'p-value',header=TRUE)
a<-table.element(a,r.t$p.value)
a<-table.row.end(a)
a<-table.row.start(a)
a<-table.element(a,'H0 value',header=TRUE)
a<-table.element(a,r.t$null.value[[1]])
a<-table.row.end(a)
a<-table.row.start(a)
a<-table.element(a,'Alternative',header=TRUE)
a<-table.element(a,r.t$alternative)
a<-table.row.end(a)
a<-table.row.start(a)
a<-table.element(a,'CI Level',header=TRUE)
a<-table.element(a,attr(r.t$conf.int,'conf.level'))
a<-table.row.end(a)
a<-table.row.start(a)
a<-table.element(a,'CI',header=TRUE)
a<-table.element(a,paste('[',r.t$conf.int[1],',',r.t$conf.int[2],']',sep=''))
a<-table.row.end(a)
a<-table.row.start(a)
a<-table.element(a,'F-test to compare two variances',2,TRUE)
a<-table.row.end(a)
a<-table.row.start(a)
a<-table.element(a,'F-stat',header=TRUE)
a<-table.element(a,v.t$statistic[[1]])
a<-table.row.end(a)
a<-table.row.start(a)
a<-table.element(a,'df',header=TRUE)
a<-table.element(a,v.t$parameter[[1]])
a<-table.row.end(a)
a<-table.row.start(a)
a<-table.element(a,'p-value',header=TRUE)
a<-table.element(a,v.t$p.value)
a<-table.row.end(a)
a<-table.row.start(a)
a<-table.element(a,'H0 value',header=TRUE)
a<-table.element(a,v.t$null.value[[1]])
a<-table.row.end(a)
a<-table.row.start(a)
a<-table.element(a,'Alternative',header=TRUE)
a<-table.element(a,v.t$alternative)
a<-table.row.end(a)
a<-table.row.start(a)
a<-table.element(a,'CI Level',header=TRUE)
a<-table.element(a,attr(v.t$conf.int,'conf.level'))
a<-table.row.end(a)
a<-table.row.start(a)
a<-table.element(a,'CI',header=TRUE)
a<-table.element(a,paste('[',v.t$conf.int[1],',',v.t$conf.int[2],']',sep=''))
a<-table.row.end(a)
a<-table.end(a)
table.save(a,file='mytable.tab')
a<-table.start()
a<-table.row.start(a)
a<-table.element(a,paste('Welch Two Sample t-test (',par5,')',sep=''),2,TRUE)
a<-table.row.end(a)
if(!paired){
a<-table.row.start(a)
a<-table.element(a,'Mean of Sample 1',header=TRUE)
a<-table.element(a,r.w$estimate[[1]])
a<-table.row.end(a)
a<-table.row.start(a)
a<-table.element(a,'Mean of Sample 2',header=TRUE)
a<-table.element(a,r.w$estimate[[2]])
a<-table.row.end(a)
} else {
a<-table.row.start(a)
a<-table.element(a,'Difference: Mean1 - Mean2',header=TRUE)
a<-table.element(a,r.w$estimate)
a<-table.row.end(a)
}
a<-table.row.start(a)
a<-table.element(a,'t-stat',header=TRUE)
a<-table.element(a,r.w$statistic[[1]])
a<-table.row.end(a)
a<-table.row.start(a)
a<-table.element(a,'df',header=TRUE)
a<-table.element(a,r.w$parameter[[1]])
a<-table.row.end(a)
a<-table.row.start(a)
a<-table.element(a,'p-value',header=TRUE)
a<-table.element(a,r.w$p.value)
a<-table.row.end(a)
a<-table.row.start(a)
a<-table.element(a,'H0 value',header=TRUE)
a<-table.element(a,r.w$null.value[[1]])
a<-table.row.end(a)
a<-table.row.start(a)
a<-table.element(a,'Alternative',header=TRUE)
a<-table.element(a,r.w$alternative)
a<-table.row.end(a)
a<-table.row.start(a)
a<-table.element(a,'CI Level',header=TRUE)
a<-table.element(a,attr(r.w$conf.int,'conf.level'))
a<-table.row.end(a)
a<-table.row.start(a)
a<-table.element(a,'CI',header=TRUE)
a<-table.element(a,paste('[',r.w$conf.int[1],',',r.w$conf.int[2],']',sep=''))
a<-table.row.end(a)
a<-table.end(a)
table.save(a,file='mytable1.tab')
a<-table.start()
a<-table.row.start(a)
myWlabel <- 'Wilcoxon Signed-Rank Test'
if (par5=='unpaired') myWlabel = 'Wilcoxon Rank-Sum Test (Mann–Whitney U test)'
a<-table.element(a,paste(myWlabel,' with continuity correction (',par5,')',sep=''),2,TRUE)
a<-table.row.end(a)
a<-table.row.start(a)
a<-table.element(a,'W',header=TRUE)
a<-table.element(a,w.t$statistic[[1]])
a<-table.row.end(a)
a<-table.row.start(a)
a<-table.element(a,'p-value',header=TRUE)
a<-table.element(a,w.t$p.value)
a<-table.row.end(a)
a<-table.row.start(a)
a<-table.element(a,'H0 value',header=TRUE)
a<-table.element(a,w.t$null.value[[1]])
a<-table.row.end(a)
a<-table.row.start(a)
a<-table.element(a,'Alternative',header=TRUE)
a<-table.element(a,w.t$alternative)
a<-table.row.end(a)
a<-table.row.start(a)
a<-table.element(a,'Kolmogorov-Smirnov Test to compare Distributions of two Samples',2,TRUE)
a<-table.row.end(a)
a<-table.row.start(a)
a<-table.element(a,'KS Statistic',header=TRUE)
a<-table.element(a,ks.t$statistic[[1]])
a<-table.row.end(a)
a<-table.row.start(a)
a<-table.element(a,'p-value',header=TRUE)
a<-table.element(a,ks.t$p.value)
a<-table.row.end(a)
a<-table.row.start(a)
a<-table.element(a,'Kolmogorov-Smirnov Test to compare Distributional Shape of two Samples',2,TRUE)
a<-table.row.end(a)
a<-table.row.start(a)
a<-table.element(a,'KS Statistic',header=TRUE)
a<-table.element(a,ks1.t$statistic[[1]])
a<-table.row.end(a)
a<-table.row.start(a)
a<-table.element(a,'p-value',header=TRUE)
a<-table.element(a,ks1.t$p.value)
a<-table.row.end(a)
a<-table.end(a)
table.save(a,file='mytable2.tab')