Free Statistics

of Irreproducible Research!

Author's title

Author*The author of this computation has been verified*
R Software Modulerwasp_autocorrelation.wasp
Title produced by software(Partial) Autocorrelation Function
Date of computationThu, 21 Dec 2017 18:31:52 +0100
Cite this page as followsStatistical Computations at FreeStatistics.org, Office for Research Development and Education, URL https://freestatistics.org/blog/index.php?v=date/2017/Dec/21/t1513877536s1llxshelr940m7.htm/, Retrieved Mon, 13 May 2024 20:47:10 +0000
Statistical Computations at FreeStatistics.org, Office for Research Development and Education, URL https://freestatistics.org/blog/index.php?pk=310680, Retrieved Mon, 13 May 2024 20:47:10 +0000
QR Codes:

Original text written by user:
IsPrivate?No (this computation is public)
User-defined keywords
Estimated Impact63
Family? (F = Feedback message, R = changed R code, M = changed R Module, P = changed Parameters, D = changed Data)
-       [(Partial) Autocorrelation Function] [] [2017-12-21 17:31:52] [8829069b4432872c842806a35f4fa8df] [Current]
Feedback Forum

Post a new message
Dataseries X:
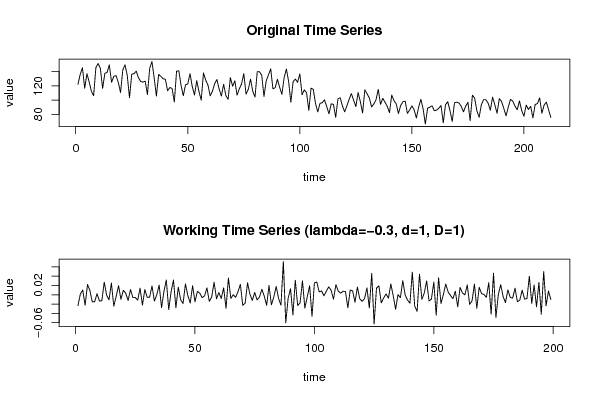
122.2
136.1
145.5
116.7
137.1
125.5
112.4
106.3
145.7
151.5
144.6
116.4
137.7
138.8
149.5
125
133.4
134.4
124.8
110.6
142.4
149.6
134.6
103.3
136.5
137.1
140.7
131.4
126.2
125.3
126.6
107.7
144.5
154.2
131.4
105.7
136.2
133.3
130
129.3
113.1
117.7
116.3
97.3
140.6
141.2
120.8
106.2
121.5
122.6
137.2
118.9
107.2
127.4
111.8
100
138.3
128
121.2
105.9
112.5
123.1
129
115.5
105.7
122.3
106.4
101.1
131.6
119.5
127
106.9
115.9
122.7
137.2
108.5
115.2
129.4
112.3
104.3
140
139.9
134.9
105.1
127
135.5
143.9
115.8
117.5
129.3
117.9
108.1
131.7
143.7
126.2
96.9
125.8
129.6
124.9
136.8
107.5
114.3
110.3
85.5
116.8
115.1
95.2
83.4
95.4
96.3
100.5
90.9
80.6
94.8
93.9
75.9
101.6
103.3
91.8
83.5
92
101.2
109.1
99.8
90.8
110.6
97.8
81.9
114.4
108.8
103.1
90.4
94.4
100.5
115.1
93.9
102.5
97.1
91.2
82.3
107.1
99.2
94.8
81.1
92.5
97.7
98.5
81.2
86.2
92
86.3
74.8
90
101.1
87.8
66.3
88.6
90
92
85.1
85.9
88.5
92.3
68
93.6
97.7
85.1
69.9
96.1
97
95.9
91.3
83.5
91.4
96.8
71
106.9
102.7
84.9
75.8
93.6
100.7
100.5
95.9
85.7
104.1
93.5
81.5
102.1
98.2
88.4
77.8
90.1
101
98.6
91.5
86.4
98.9
85.2
77.3
93
86.8
91.3
74.9
93.9
95
103.1
81.4
93.1
97.2
86.4
75.5


Summary of computational transaction
Raw Input view raw input (R code)
Raw Outputview raw output of R engine
Computing time2 seconds
R ServerBig Analytics Cloud Computing Center

\begin{tabular}{lllllllll}
\hline
Summary of computational transaction \tabularnewline
Raw Input view raw input (R code)  \tabularnewline
Raw Outputview raw output of R engine  \tabularnewline
Computing time2 seconds \tabularnewline
R ServerBig Analytics Cloud Computing Center \tabularnewline
\hline
\end{tabular}
%Source: https://freestatistics.org/blog/index.php?pk=310680&T=0

[TABLE]
[ROW]
Summary of computational transaction[/C][/ROW] [ROW]Raw Input[/C] view raw input (R code) [/C][/ROW] [ROW]Raw Output[/C]view raw output of R engine [/C][/ROW] [ROW]Computing time[/C]2 seconds[/C][/ROW] [ROW]R Server[/C]Big Analytics Cloud Computing Center[/C][/ROW] [/TABLE] Source: https://freestatistics.org/blog/index.php?pk=310680&T=0

Globally Unique Identifier (entire table): ba.freestatistics.org/blog/index.php?pk=310680&T=0

As an alternative you can also use a QR Code:  

The GUIDs for individual cells are displayed in the table below:

Summary of computational transaction
Raw Input view raw input (R code)
Raw Outputview raw output of R engine
Computing time2 seconds
R ServerBig Analytics Cloud Computing Center


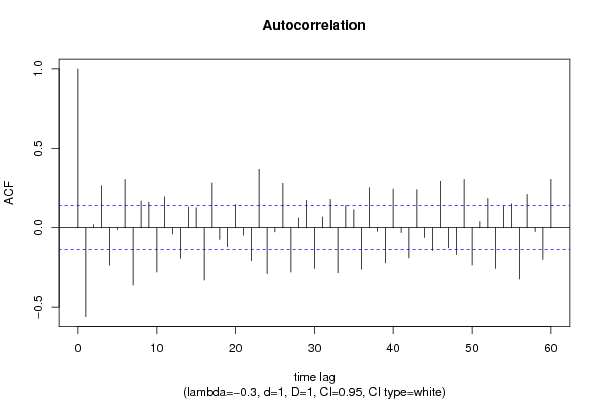
Autocorrelation Function
Time lag kACF(k)T-STATP-value
1-0.560485-7.90660
20.0189540.26740.394728
30.2641523.72630.000127
4-0.235836-3.32690.000523
5-0.011665-0.16460.434731
60.3041094.291.4e-05
7-0.361657-5.10180
80.1673622.36090.009598
90.1604472.26340.012345
10-0.279782-3.94685.5e-05
110.1940382.73720.003378
12-0.039202-0.5530.29044
13-0.192465-2.71510.003604
140.1309211.84690.033125
150.1254111.76910.039201
16-0.329811-4.65263e-06
170.2811763.96655.1e-05
18-0.073595-1.03820.150223
19-0.120228-1.6960.045722
200.1451612.04770.020949
21-0.046839-0.66080.254768
22-0.208685-2.94390.001813
230.3673135.18160
24-0.288423-4.06873.4e-05
25-0.026222-0.36990.355925
260.2797933.9475.5e-05
27-0.279628-3.94465.5e-05
280.0615720.86860.193062
290.1732992.44470.007684
30-0.2562-3.61410.000191
310.0675310.95260.170963
320.1781552.51320.006379
33-0.28345-3.99864.5e-05
340.13941.96650.025317
350.1131391.5960.056036
36-0.262342-3.70080.000139
370.2515783.54890.000241
38-0.023157-0.32670.372128
39-0.220769-3.11430.001058
400.2427853.42490.000373
41-0.030472-0.42990.33388
42-0.190083-2.68150.003973
430.2387333.36770.000455
44-0.061518-0.86780.193268
45-0.143053-2.0180.022467
460.292214.12212.8e-05
47-0.12604-1.7780.038464
48-0.168989-2.38390.009036
490.3031894.2771.5e-05
50-0.234827-3.31260.000549
510.0384430.54230.294107
520.1835252.58890.005169
53-0.257408-3.63120.000179
540.1351461.90650.029015
550.1502372.11940.01765
56-0.322616-4.55115e-06
570.2088862.94670.001798
58-0.024108-0.34010.367073
59-0.199871-2.81950.002648
600.304314.29281.4e-05

\begin{tabular}{lllllllll}
\hline
Autocorrelation Function \tabularnewline
Time lag k & ACF(k) & T-STAT & P-value \tabularnewline
1 & -0.560485 & -7.9066 & 0 \tabularnewline
2 & 0.018954 & 0.2674 & 0.394728 \tabularnewline
3 & 0.264152 & 3.7263 & 0.000127 \tabularnewline
4 & -0.235836 & -3.3269 & 0.000523 \tabularnewline
5 & -0.011665 & -0.1646 & 0.434731 \tabularnewline
6 & 0.304109 & 4.29 & 1.4e-05 \tabularnewline
7 & -0.361657 & -5.1018 & 0 \tabularnewline
8 & 0.167362 & 2.3609 & 0.009598 \tabularnewline
9 & 0.160447 & 2.2634 & 0.012345 \tabularnewline
10 & -0.279782 & -3.9468 & 5.5e-05 \tabularnewline
11 & 0.194038 & 2.7372 & 0.003378 \tabularnewline
12 & -0.039202 & -0.553 & 0.29044 \tabularnewline
13 & -0.192465 & -2.7151 & 0.003604 \tabularnewline
14 & 0.130921 & 1.8469 & 0.033125 \tabularnewline
15 & 0.125411 & 1.7691 & 0.039201 \tabularnewline
16 & -0.329811 & -4.6526 & 3e-06 \tabularnewline
17 & 0.281176 & 3.9665 & 5.1e-05 \tabularnewline
18 & -0.073595 & -1.0382 & 0.150223 \tabularnewline
19 & -0.120228 & -1.696 & 0.045722 \tabularnewline
20 & 0.145161 & 2.0477 & 0.020949 \tabularnewline
21 & -0.046839 & -0.6608 & 0.254768 \tabularnewline
22 & -0.208685 & -2.9439 & 0.001813 \tabularnewline
23 & 0.367313 & 5.1816 & 0 \tabularnewline
24 & -0.288423 & -4.0687 & 3.4e-05 \tabularnewline
25 & -0.026222 & -0.3699 & 0.355925 \tabularnewline
26 & 0.279793 & 3.947 & 5.5e-05 \tabularnewline
27 & -0.279628 & -3.9446 & 5.5e-05 \tabularnewline
28 & 0.061572 & 0.8686 & 0.193062 \tabularnewline
29 & 0.173299 & 2.4447 & 0.007684 \tabularnewline
30 & -0.2562 & -3.6141 & 0.000191 \tabularnewline
31 & 0.067531 & 0.9526 & 0.170963 \tabularnewline
32 & 0.178155 & 2.5132 & 0.006379 \tabularnewline
33 & -0.28345 & -3.9986 & 4.5e-05 \tabularnewline
34 & 0.1394 & 1.9665 & 0.025317 \tabularnewline
35 & 0.113139 & 1.596 & 0.056036 \tabularnewline
36 & -0.262342 & -3.7008 & 0.000139 \tabularnewline
37 & 0.251578 & 3.5489 & 0.000241 \tabularnewline
38 & -0.023157 & -0.3267 & 0.372128 \tabularnewline
39 & -0.220769 & -3.1143 & 0.001058 \tabularnewline
40 & 0.242785 & 3.4249 & 0.000373 \tabularnewline
41 & -0.030472 & -0.4299 & 0.33388 \tabularnewline
42 & -0.190083 & -2.6815 & 0.003973 \tabularnewline
43 & 0.238733 & 3.3677 & 0.000455 \tabularnewline
44 & -0.061518 & -0.8678 & 0.193268 \tabularnewline
45 & -0.143053 & -2.018 & 0.022467 \tabularnewline
46 & 0.29221 & 4.1221 & 2.8e-05 \tabularnewline
47 & -0.12604 & -1.778 & 0.038464 \tabularnewline
48 & -0.168989 & -2.3839 & 0.009036 \tabularnewline
49 & 0.303189 & 4.277 & 1.5e-05 \tabularnewline
50 & -0.234827 & -3.3126 & 0.000549 \tabularnewline
51 & 0.038443 & 0.5423 & 0.294107 \tabularnewline
52 & 0.183525 & 2.5889 & 0.005169 \tabularnewline
53 & -0.257408 & -3.6312 & 0.000179 \tabularnewline
54 & 0.135146 & 1.9065 & 0.029015 \tabularnewline
55 & 0.150237 & 2.1194 & 0.01765 \tabularnewline
56 & -0.322616 & -4.5511 & 5e-06 \tabularnewline
57 & 0.208886 & 2.9467 & 0.001798 \tabularnewline
58 & -0.024108 & -0.3401 & 0.367073 \tabularnewline
59 & -0.199871 & -2.8195 & 0.002648 \tabularnewline
60 & 0.30431 & 4.2928 & 1.4e-05 \tabularnewline
\hline
\end{tabular}
%Source: https://freestatistics.org/blog/index.php?pk=310680&T=1

[TABLE]
[ROW][C]Autocorrelation Function[/C][/ROW]
[ROW][C]Time lag k[/C][C]ACF(k)[/C][C]T-STAT[/C][C]P-value[/C][/ROW]
[ROW][C]1[/C][C]-0.560485[/C][C]-7.9066[/C][C]0[/C][/ROW]
[ROW][C]2[/C][C]0.018954[/C][C]0.2674[/C][C]0.394728[/C][/ROW]
[ROW][C]3[/C][C]0.264152[/C][C]3.7263[/C][C]0.000127[/C][/ROW]
[ROW][C]4[/C][C]-0.235836[/C][C]-3.3269[/C][C]0.000523[/C][/ROW]
[ROW][C]5[/C][C]-0.011665[/C][C]-0.1646[/C][C]0.434731[/C][/ROW]
[ROW][C]6[/C][C]0.304109[/C][C]4.29[/C][C]1.4e-05[/C][/ROW]
[ROW][C]7[/C][C]-0.361657[/C][C]-5.1018[/C][C]0[/C][/ROW]
[ROW][C]8[/C][C]0.167362[/C][C]2.3609[/C][C]0.009598[/C][/ROW]
[ROW][C]9[/C][C]0.160447[/C][C]2.2634[/C][C]0.012345[/C][/ROW]
[ROW][C]10[/C][C]-0.279782[/C][C]-3.9468[/C][C]5.5e-05[/C][/ROW]
[ROW][C]11[/C][C]0.194038[/C][C]2.7372[/C][C]0.003378[/C][/ROW]
[ROW][C]12[/C][C]-0.039202[/C][C]-0.553[/C][C]0.29044[/C][/ROW]
[ROW][C]13[/C][C]-0.192465[/C][C]-2.7151[/C][C]0.003604[/C][/ROW]
[ROW][C]14[/C][C]0.130921[/C][C]1.8469[/C][C]0.033125[/C][/ROW]
[ROW][C]15[/C][C]0.125411[/C][C]1.7691[/C][C]0.039201[/C][/ROW]
[ROW][C]16[/C][C]-0.329811[/C][C]-4.6526[/C][C]3e-06[/C][/ROW]
[ROW][C]17[/C][C]0.281176[/C][C]3.9665[/C][C]5.1e-05[/C][/ROW]
[ROW][C]18[/C][C]-0.073595[/C][C]-1.0382[/C][C]0.150223[/C][/ROW]
[ROW][C]19[/C][C]-0.120228[/C][C]-1.696[/C][C]0.045722[/C][/ROW]
[ROW][C]20[/C][C]0.145161[/C][C]2.0477[/C][C]0.020949[/C][/ROW]
[ROW][C]21[/C][C]-0.046839[/C][C]-0.6608[/C][C]0.254768[/C][/ROW]
[ROW][C]22[/C][C]-0.208685[/C][C]-2.9439[/C][C]0.001813[/C][/ROW]
[ROW][C]23[/C][C]0.367313[/C][C]5.1816[/C][C]0[/C][/ROW]
[ROW][C]24[/C][C]-0.288423[/C][C]-4.0687[/C][C]3.4e-05[/C][/ROW]
[ROW][C]25[/C][C]-0.026222[/C][C]-0.3699[/C][C]0.355925[/C][/ROW]
[ROW][C]26[/C][C]0.279793[/C][C]3.947[/C][C]5.5e-05[/C][/ROW]
[ROW][C]27[/C][C]-0.279628[/C][C]-3.9446[/C][C]5.5e-05[/C][/ROW]
[ROW][C]28[/C][C]0.061572[/C][C]0.8686[/C][C]0.193062[/C][/ROW]
[ROW][C]29[/C][C]0.173299[/C][C]2.4447[/C][C]0.007684[/C][/ROW]
[ROW][C]30[/C][C]-0.2562[/C][C]-3.6141[/C][C]0.000191[/C][/ROW]
[ROW][C]31[/C][C]0.067531[/C][C]0.9526[/C][C]0.170963[/C][/ROW]
[ROW][C]32[/C][C]0.178155[/C][C]2.5132[/C][C]0.006379[/C][/ROW]
[ROW][C]33[/C][C]-0.28345[/C][C]-3.9986[/C][C]4.5e-05[/C][/ROW]
[ROW][C]34[/C][C]0.1394[/C][C]1.9665[/C][C]0.025317[/C][/ROW]
[ROW][C]35[/C][C]0.113139[/C][C]1.596[/C][C]0.056036[/C][/ROW]
[ROW][C]36[/C][C]-0.262342[/C][C]-3.7008[/C][C]0.000139[/C][/ROW]
[ROW][C]37[/C][C]0.251578[/C][C]3.5489[/C][C]0.000241[/C][/ROW]
[ROW][C]38[/C][C]-0.023157[/C][C]-0.3267[/C][C]0.372128[/C][/ROW]
[ROW][C]39[/C][C]-0.220769[/C][C]-3.1143[/C][C]0.001058[/C][/ROW]
[ROW][C]40[/C][C]0.242785[/C][C]3.4249[/C][C]0.000373[/C][/ROW]
[ROW][C]41[/C][C]-0.030472[/C][C]-0.4299[/C][C]0.33388[/C][/ROW]
[ROW][C]42[/C][C]-0.190083[/C][C]-2.6815[/C][C]0.003973[/C][/ROW]
[ROW][C]43[/C][C]0.238733[/C][C]3.3677[/C][C]0.000455[/C][/ROW]
[ROW][C]44[/C][C]-0.061518[/C][C]-0.8678[/C][C]0.193268[/C][/ROW]
[ROW][C]45[/C][C]-0.143053[/C][C]-2.018[/C][C]0.022467[/C][/ROW]
[ROW][C]46[/C][C]0.29221[/C][C]4.1221[/C][C]2.8e-05[/C][/ROW]
[ROW][C]47[/C][C]-0.12604[/C][C]-1.778[/C][C]0.038464[/C][/ROW]
[ROW][C]48[/C][C]-0.168989[/C][C]-2.3839[/C][C]0.009036[/C][/ROW]
[ROW][C]49[/C][C]0.303189[/C][C]4.277[/C][C]1.5e-05[/C][/ROW]
[ROW][C]50[/C][C]-0.234827[/C][C]-3.3126[/C][C]0.000549[/C][/ROW]
[ROW][C]51[/C][C]0.038443[/C][C]0.5423[/C][C]0.294107[/C][/ROW]
[ROW][C]52[/C][C]0.183525[/C][C]2.5889[/C][C]0.005169[/C][/ROW]
[ROW][C]53[/C][C]-0.257408[/C][C]-3.6312[/C][C]0.000179[/C][/ROW]
[ROW][C]54[/C][C]0.135146[/C][C]1.9065[/C][C]0.029015[/C][/ROW]
[ROW][C]55[/C][C]0.150237[/C][C]2.1194[/C][C]0.01765[/C][/ROW]
[ROW][C]56[/C][C]-0.322616[/C][C]-4.5511[/C][C]5e-06[/C][/ROW]
[ROW][C]57[/C][C]0.208886[/C][C]2.9467[/C][C]0.001798[/C][/ROW]
[ROW][C]58[/C][C]-0.024108[/C][C]-0.3401[/C][C]0.367073[/C][/ROW]
[ROW][C]59[/C][C]-0.199871[/C][C]-2.8195[/C][C]0.002648[/C][/ROW]
[ROW][C]60[/C][C]0.30431[/C][C]4.2928[/C][C]1.4e-05[/C][/ROW]
[/TABLE]
Source: https://freestatistics.org/blog/index.php?pk=310680&T=1

Globally Unique Identifier (entire table): ba.freestatistics.org/blog/index.php?pk=310680&T=1

As an alternative you can also use a QR Code:  

The GUIDs for individual cells are displayed in the table below:

Autocorrelation Function
Time lag kACF(k)T-STATP-value
1-0.560485-7.90660
20.0189540.26740.394728
30.2641523.72630.000127
4-0.235836-3.32690.000523
5-0.011665-0.16460.434731
60.3041094.291.4e-05
7-0.361657-5.10180
80.1673622.36090.009598
90.1604472.26340.012345
10-0.279782-3.94685.5e-05
110.1940382.73720.003378
12-0.039202-0.5530.29044
13-0.192465-2.71510.003604
140.1309211.84690.033125
150.1254111.76910.039201
16-0.329811-4.65263e-06
170.2811763.96655.1e-05
18-0.073595-1.03820.150223
19-0.120228-1.6960.045722
200.1451612.04770.020949
21-0.046839-0.66080.254768
22-0.208685-2.94390.001813
230.3673135.18160
24-0.288423-4.06873.4e-05
25-0.026222-0.36990.355925
260.2797933.9475.5e-05
27-0.279628-3.94465.5e-05
280.0615720.86860.193062
290.1732992.44470.007684
30-0.2562-3.61410.000191
310.0675310.95260.170963
320.1781552.51320.006379
33-0.28345-3.99864.5e-05
340.13941.96650.025317
350.1131391.5960.056036
36-0.262342-3.70080.000139
370.2515783.54890.000241
38-0.023157-0.32670.372128
39-0.220769-3.11430.001058
400.2427853.42490.000373
41-0.030472-0.42990.33388
42-0.190083-2.68150.003973
430.2387333.36770.000455
44-0.061518-0.86780.193268
45-0.143053-2.0180.022467
460.292214.12212.8e-05
47-0.12604-1.7780.038464
48-0.168989-2.38390.009036
490.3031894.2771.5e-05
50-0.234827-3.31260.000549
510.0384430.54230.294107
520.1835252.58890.005169
53-0.257408-3.63120.000179
540.1351461.90650.029015
550.1502372.11940.01765
56-0.322616-4.55115e-06
570.2088862.94670.001798
58-0.024108-0.34010.367073
59-0.199871-2.81950.002648
600.304314.29281.4e-05


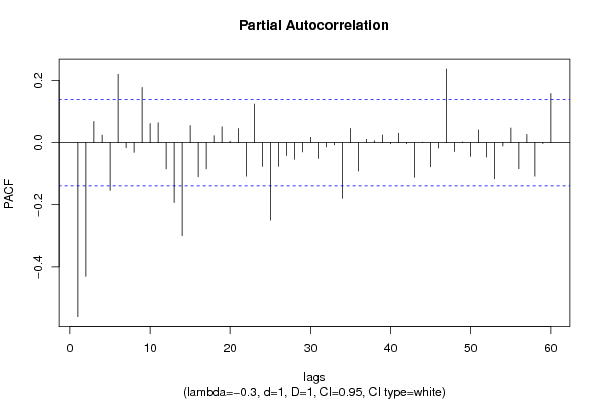
Partial Autocorrelation Function
Time lag kPACF(k)T-STATP-value
1-0.560485-7.90660
2-0.430396-6.07150
30.0682120.96230.168545
40.0243380.34330.365856
5-0.153604-2.16690.015717
60.2200143.10370.001095
7-0.016362-0.23080.408849
8-0.031289-0.44140.329708
90.1775342.50440.006534
100.0612110.86350.194455
110.0641610.90510.183252
12-0.084499-1.1920.117338
13-0.192775-2.71940.003559
14-0.299817-4.22941.8e-05
150.0547640.77250.220357
16-0.109946-1.5510.061248
17-0.084447-1.19130.117484
180.0223040.31460.376684
190.0508430.71720.237035
200.004130.05830.4768
210.0452760.63870.261875
22-0.107979-1.52320.064644
230.1240521.750.040832
24-0.076431-1.07820.141128
25-0.249549-3.52030.000267
26-0.075969-1.07170.142582
27-0.041298-0.58260.280417
28-0.053736-0.7580.224663
29-0.029698-0.41890.337854
300.0169090.23850.405856
31-0.050674-0.71480.237771
32-0.013642-0.19240.423794
33-0.006745-0.09520.462145
34-0.179371-2.53030.006085
350.0454640.64130.261017
36-0.091444-1.290.099277
370.0104950.1480.441228
380.0061610.08690.465416
390.0244340.34470.365346
40-0.003799-0.05360.478658
410.0304230.42920.33413
42-0.003396-0.04790.480921
43-0.11171-1.57590.058322
440.0011990.01690.493261
45-0.077567-1.09420.137591
46-0.01744-0.2460.402962
470.2373393.34810.000487
48-0.028302-0.39930.345067
490.0019770.02790.488891
50-0.044264-0.62440.266532
510.0406580.57360.283459
52-0.046146-0.6510.257909
53-0.116413-1.64220.051064
54-0.01111-0.15670.437808
550.0474160.66890.252174
56-0.083685-1.18050.119601
570.0264150.37260.354913
58-0.108019-1.52380.064573
59-0.002916-0.04110.483614
600.1580572.22970.013443

\begin{tabular}{lllllllll}
\hline
Partial Autocorrelation Function \tabularnewline
Time lag k & PACF(k) & T-STAT & P-value \tabularnewline
1 & -0.560485 & -7.9066 & 0 \tabularnewline
2 & -0.430396 & -6.0715 & 0 \tabularnewline
3 & 0.068212 & 0.9623 & 0.168545 \tabularnewline
4 & 0.024338 & 0.3433 & 0.365856 \tabularnewline
5 & -0.153604 & -2.1669 & 0.015717 \tabularnewline
6 & 0.220014 & 3.1037 & 0.001095 \tabularnewline
7 & -0.016362 & -0.2308 & 0.408849 \tabularnewline
8 & -0.031289 & -0.4414 & 0.329708 \tabularnewline
9 & 0.177534 & 2.5044 & 0.006534 \tabularnewline
10 & 0.061211 & 0.8635 & 0.194455 \tabularnewline
11 & 0.064161 & 0.9051 & 0.183252 \tabularnewline
12 & -0.084499 & -1.192 & 0.117338 \tabularnewline
13 & -0.192775 & -2.7194 & 0.003559 \tabularnewline
14 & -0.299817 & -4.2294 & 1.8e-05 \tabularnewline
15 & 0.054764 & 0.7725 & 0.220357 \tabularnewline
16 & -0.109946 & -1.551 & 0.061248 \tabularnewline
17 & -0.084447 & -1.1913 & 0.117484 \tabularnewline
18 & 0.022304 & 0.3146 & 0.376684 \tabularnewline
19 & 0.050843 & 0.7172 & 0.237035 \tabularnewline
20 & 0.00413 & 0.0583 & 0.4768 \tabularnewline
21 & 0.045276 & 0.6387 & 0.261875 \tabularnewline
22 & -0.107979 & -1.5232 & 0.064644 \tabularnewline
23 & 0.124052 & 1.75 & 0.040832 \tabularnewline
24 & -0.076431 & -1.0782 & 0.141128 \tabularnewline
25 & -0.249549 & -3.5203 & 0.000267 \tabularnewline
26 & -0.075969 & -1.0717 & 0.142582 \tabularnewline
27 & -0.041298 & -0.5826 & 0.280417 \tabularnewline
28 & -0.053736 & -0.758 & 0.224663 \tabularnewline
29 & -0.029698 & -0.4189 & 0.337854 \tabularnewline
30 & 0.016909 & 0.2385 & 0.405856 \tabularnewline
31 & -0.050674 & -0.7148 & 0.237771 \tabularnewline
32 & -0.013642 & -0.1924 & 0.423794 \tabularnewline
33 & -0.006745 & -0.0952 & 0.462145 \tabularnewline
34 & -0.179371 & -2.5303 & 0.006085 \tabularnewline
35 & 0.045464 & 0.6413 & 0.261017 \tabularnewline
36 & -0.091444 & -1.29 & 0.099277 \tabularnewline
37 & 0.010495 & 0.148 & 0.441228 \tabularnewline
38 & 0.006161 & 0.0869 & 0.465416 \tabularnewline
39 & 0.024434 & 0.3447 & 0.365346 \tabularnewline
40 & -0.003799 & -0.0536 & 0.478658 \tabularnewline
41 & 0.030423 & 0.4292 & 0.33413 \tabularnewline
42 & -0.003396 & -0.0479 & 0.480921 \tabularnewline
43 & -0.11171 & -1.5759 & 0.058322 \tabularnewline
44 & 0.001199 & 0.0169 & 0.493261 \tabularnewline
45 & -0.077567 & -1.0942 & 0.137591 \tabularnewline
46 & -0.01744 & -0.246 & 0.402962 \tabularnewline
47 & 0.237339 & 3.3481 & 0.000487 \tabularnewline
48 & -0.028302 & -0.3993 & 0.345067 \tabularnewline
49 & 0.001977 & 0.0279 & 0.488891 \tabularnewline
50 & -0.044264 & -0.6244 & 0.266532 \tabularnewline
51 & 0.040658 & 0.5736 & 0.283459 \tabularnewline
52 & -0.046146 & -0.651 & 0.257909 \tabularnewline
53 & -0.116413 & -1.6422 & 0.051064 \tabularnewline
54 & -0.01111 & -0.1567 & 0.437808 \tabularnewline
55 & 0.047416 & 0.6689 & 0.252174 \tabularnewline
56 & -0.083685 & -1.1805 & 0.119601 \tabularnewline
57 & 0.026415 & 0.3726 & 0.354913 \tabularnewline
58 & -0.108019 & -1.5238 & 0.064573 \tabularnewline
59 & -0.002916 & -0.0411 & 0.483614 \tabularnewline
60 & 0.158057 & 2.2297 & 0.013443 \tabularnewline
\hline
\end{tabular}
%Source: https://freestatistics.org/blog/index.php?pk=310680&T=2

[TABLE]
[ROW][C]Partial Autocorrelation Function[/C][/ROW]
[ROW][C]Time lag k[/C][C]PACF(k)[/C][C]T-STAT[/C][C]P-value[/C][/ROW]
[ROW][C]1[/C][C]-0.560485[/C][C]-7.9066[/C][C]0[/C][/ROW]
[ROW][C]2[/C][C]-0.430396[/C][C]-6.0715[/C][C]0[/C][/ROW]
[ROW][C]3[/C][C]0.068212[/C][C]0.9623[/C][C]0.168545[/C][/ROW]
[ROW][C]4[/C][C]0.024338[/C][C]0.3433[/C][C]0.365856[/C][/ROW]
[ROW][C]5[/C][C]-0.153604[/C][C]-2.1669[/C][C]0.015717[/C][/ROW]
[ROW][C]6[/C][C]0.220014[/C][C]3.1037[/C][C]0.001095[/C][/ROW]
[ROW][C]7[/C][C]-0.016362[/C][C]-0.2308[/C][C]0.408849[/C][/ROW]
[ROW][C]8[/C][C]-0.031289[/C][C]-0.4414[/C][C]0.329708[/C][/ROW]
[ROW][C]9[/C][C]0.177534[/C][C]2.5044[/C][C]0.006534[/C][/ROW]
[ROW][C]10[/C][C]0.061211[/C][C]0.8635[/C][C]0.194455[/C][/ROW]
[ROW][C]11[/C][C]0.064161[/C][C]0.9051[/C][C]0.183252[/C][/ROW]
[ROW][C]12[/C][C]-0.084499[/C][C]-1.192[/C][C]0.117338[/C][/ROW]
[ROW][C]13[/C][C]-0.192775[/C][C]-2.7194[/C][C]0.003559[/C][/ROW]
[ROW][C]14[/C][C]-0.299817[/C][C]-4.2294[/C][C]1.8e-05[/C][/ROW]
[ROW][C]15[/C][C]0.054764[/C][C]0.7725[/C][C]0.220357[/C][/ROW]
[ROW][C]16[/C][C]-0.109946[/C][C]-1.551[/C][C]0.061248[/C][/ROW]
[ROW][C]17[/C][C]-0.084447[/C][C]-1.1913[/C][C]0.117484[/C][/ROW]
[ROW][C]18[/C][C]0.022304[/C][C]0.3146[/C][C]0.376684[/C][/ROW]
[ROW][C]19[/C][C]0.050843[/C][C]0.7172[/C][C]0.237035[/C][/ROW]
[ROW][C]20[/C][C]0.00413[/C][C]0.0583[/C][C]0.4768[/C][/ROW]
[ROW][C]21[/C][C]0.045276[/C][C]0.6387[/C][C]0.261875[/C][/ROW]
[ROW][C]22[/C][C]-0.107979[/C][C]-1.5232[/C][C]0.064644[/C][/ROW]
[ROW][C]23[/C][C]0.124052[/C][C]1.75[/C][C]0.040832[/C][/ROW]
[ROW][C]24[/C][C]-0.076431[/C][C]-1.0782[/C][C]0.141128[/C][/ROW]
[ROW][C]25[/C][C]-0.249549[/C][C]-3.5203[/C][C]0.000267[/C][/ROW]
[ROW][C]26[/C][C]-0.075969[/C][C]-1.0717[/C][C]0.142582[/C][/ROW]
[ROW][C]27[/C][C]-0.041298[/C][C]-0.5826[/C][C]0.280417[/C][/ROW]
[ROW][C]28[/C][C]-0.053736[/C][C]-0.758[/C][C]0.224663[/C][/ROW]
[ROW][C]29[/C][C]-0.029698[/C][C]-0.4189[/C][C]0.337854[/C][/ROW]
[ROW][C]30[/C][C]0.016909[/C][C]0.2385[/C][C]0.405856[/C][/ROW]
[ROW][C]31[/C][C]-0.050674[/C][C]-0.7148[/C][C]0.237771[/C][/ROW]
[ROW][C]32[/C][C]-0.013642[/C][C]-0.1924[/C][C]0.423794[/C][/ROW]
[ROW][C]33[/C][C]-0.006745[/C][C]-0.0952[/C][C]0.462145[/C][/ROW]
[ROW][C]34[/C][C]-0.179371[/C][C]-2.5303[/C][C]0.006085[/C][/ROW]
[ROW][C]35[/C][C]0.045464[/C][C]0.6413[/C][C]0.261017[/C][/ROW]
[ROW][C]36[/C][C]-0.091444[/C][C]-1.29[/C][C]0.099277[/C][/ROW]
[ROW][C]37[/C][C]0.010495[/C][C]0.148[/C][C]0.441228[/C][/ROW]
[ROW][C]38[/C][C]0.006161[/C][C]0.0869[/C][C]0.465416[/C][/ROW]
[ROW][C]39[/C][C]0.024434[/C][C]0.3447[/C][C]0.365346[/C][/ROW]
[ROW][C]40[/C][C]-0.003799[/C][C]-0.0536[/C][C]0.478658[/C][/ROW]
[ROW][C]41[/C][C]0.030423[/C][C]0.4292[/C][C]0.33413[/C][/ROW]
[ROW][C]42[/C][C]-0.003396[/C][C]-0.0479[/C][C]0.480921[/C][/ROW]
[ROW][C]43[/C][C]-0.11171[/C][C]-1.5759[/C][C]0.058322[/C][/ROW]
[ROW][C]44[/C][C]0.001199[/C][C]0.0169[/C][C]0.493261[/C][/ROW]
[ROW][C]45[/C][C]-0.077567[/C][C]-1.0942[/C][C]0.137591[/C][/ROW]
[ROW][C]46[/C][C]-0.01744[/C][C]-0.246[/C][C]0.402962[/C][/ROW]
[ROW][C]47[/C][C]0.237339[/C][C]3.3481[/C][C]0.000487[/C][/ROW]
[ROW][C]48[/C][C]-0.028302[/C][C]-0.3993[/C][C]0.345067[/C][/ROW]
[ROW][C]49[/C][C]0.001977[/C][C]0.0279[/C][C]0.488891[/C][/ROW]
[ROW][C]50[/C][C]-0.044264[/C][C]-0.6244[/C][C]0.266532[/C][/ROW]
[ROW][C]51[/C][C]0.040658[/C][C]0.5736[/C][C]0.283459[/C][/ROW]
[ROW][C]52[/C][C]-0.046146[/C][C]-0.651[/C][C]0.257909[/C][/ROW]
[ROW][C]53[/C][C]-0.116413[/C][C]-1.6422[/C][C]0.051064[/C][/ROW]
[ROW][C]54[/C][C]-0.01111[/C][C]-0.1567[/C][C]0.437808[/C][/ROW]
[ROW][C]55[/C][C]0.047416[/C][C]0.6689[/C][C]0.252174[/C][/ROW]
[ROW][C]56[/C][C]-0.083685[/C][C]-1.1805[/C][C]0.119601[/C][/ROW]
[ROW][C]57[/C][C]0.026415[/C][C]0.3726[/C][C]0.354913[/C][/ROW]
[ROW][C]58[/C][C]-0.108019[/C][C]-1.5238[/C][C]0.064573[/C][/ROW]
[ROW][C]59[/C][C]-0.002916[/C][C]-0.0411[/C][C]0.483614[/C][/ROW]
[ROW][C]60[/C][C]0.158057[/C][C]2.2297[/C][C]0.013443[/C][/ROW]
[/TABLE]
Source: https://freestatistics.org/blog/index.php?pk=310680&T=2

Globally Unique Identifier (entire table): ba.freestatistics.org/blog/index.php?pk=310680&T=2

As an alternative you can also use a QR Code:  

The GUIDs for individual cells are displayed in the table below:

Partial Autocorrelation Function
Time lag kPACF(k)T-STATP-value
1-0.560485-7.90660
2-0.430396-6.07150
30.0682120.96230.168545
40.0243380.34330.365856
5-0.153604-2.16690.015717
60.2200143.10370.001095
7-0.016362-0.23080.408849
8-0.031289-0.44140.329708
90.1775342.50440.006534
100.0612110.86350.194455
110.0641610.90510.183252
12-0.084499-1.1920.117338
13-0.192775-2.71940.003559
14-0.299817-4.22941.8e-05
150.0547640.77250.220357
16-0.109946-1.5510.061248
17-0.084447-1.19130.117484
180.0223040.31460.376684
190.0508430.71720.237035
200.004130.05830.4768
210.0452760.63870.261875
22-0.107979-1.52320.064644
230.1240521.750.040832
24-0.076431-1.07820.141128
25-0.249549-3.52030.000267
26-0.075969-1.07170.142582
27-0.041298-0.58260.280417
28-0.053736-0.7580.224663
29-0.029698-0.41890.337854
300.0169090.23850.405856
31-0.050674-0.71480.237771
32-0.013642-0.19240.423794
33-0.006745-0.09520.462145
34-0.179371-2.53030.006085
350.0454640.64130.261017
36-0.091444-1.290.099277
370.0104950.1480.441228
380.0061610.08690.465416
390.0244340.34470.365346
40-0.003799-0.05360.478658
410.0304230.42920.33413
42-0.003396-0.04790.480921
43-0.11171-1.57590.058322
440.0011990.01690.493261
45-0.077567-1.09420.137591
46-0.01744-0.2460.402962
470.2373393.34810.000487
48-0.028302-0.39930.345067
490.0019770.02790.488891
50-0.044264-0.62440.266532
510.0406580.57360.283459
52-0.046146-0.6510.257909
53-0.116413-1.64220.051064
54-0.01111-0.15670.437808
550.0474160.66890.252174
56-0.083685-1.18050.119601
570.0264150.37260.354913
58-0.108019-1.52380.064573
59-0.002916-0.04110.483614
600.1580572.22970.013443


Parameters (Session):
par1 = 60 ; par2 = -0.3 ; par3 = 1 ; par4 = 1 ; par5 = 12 ; par6 = White Noise ; par7 = 0.95 ;
Parameters (R input):
par1 = 60 ; par2 = -0.3 ; par3 = 1 ; par4 = 1 ; par5 = 12 ; par6 = White Noise ; par7 = 0.95 ; par8 = ;
R code (references can be found in the software module):
if (par1 == 'Default') {
par1 = 10*log10(length(x))
} else {
par1 <- as.numeric(par1)
}
par2 <- as.numeric(par2)
par3 <- as.numeric(par3)
par4 <- as.numeric(par4)
par5 <- as.numeric(par5)
if (par6 == 'White Noise') par6 <- 'white' else par6 <- 'ma'
par7 <- as.numeric(par7)
if (par8 != '') par8 <- as.numeric(par8)
x <- na.omit(x)
ox <- x
if (par8 == '') {
if (par2 == 0) {
x <- log(x)
} else {
x <- (x ^ par2 - 1) / par2
}
} else {
x <- log(x,base=par8)
}
if (par3 > 0) x <- diff(x,lag=1,difference=par3)
if (par4 > 0) x <- diff(x,lag=par5,difference=par4)
bitmap(file='picts.png')
op <- par(mfrow=c(2,1))
plot(ox,type='l',main='Original Time Series',xlab='time',ylab='value')
if (par8=='') {
mytitle <- paste('Working Time Series (lambda=',par2,', d=',par3,', D=',par4,')',sep='')
mysub <- paste('(lambda=',par2,', d=',par3,', D=',par4,', CI=', par7, ', CI type=',par6,')',sep='')
} else {
mytitle <- paste('Working Time Series (base=',par8,', d=',par3,', D=',par4,')',sep='')
mysub <- paste('(base=',par8,', d=',par3,', D=',par4,', CI=', par7, ', CI type=',par6,')',sep='')
}
plot(x,type='l', main=mytitle,xlab='time',ylab='value')
par(op)
dev.off()
bitmap(file='pic1.png')
racf <- acf(x, par1, main='Autocorrelation', xlab='time lag', ylab='ACF', ci.type=par6, ci=par7, sub=mysub)
dev.off()
bitmap(file='pic2.png')
rpacf <- pacf(x,par1,main='Partial Autocorrelation',xlab='lags',ylab='PACF',sub=mysub)
dev.off()
(myacf <- c(racf$acf))
(mypacf <- c(rpacf$acf))
lengthx <- length(x)
sqrtn <- sqrt(lengthx)
load(file='createtable')
a<-table.start()
a<-table.row.start(a)
a<-table.element(a,'Autocorrelation Function',4,TRUE)
a<-table.row.end(a)
a<-table.row.start(a)
a<-table.element(a,'Time lag k',header=TRUE)
a<-table.element(a,'ACF(k)',header=TRUE)
a<-table.element(a,'T-STAT',header=TRUE)
a<-table.element(a,'P-value',header=TRUE)
a<-table.row.end(a)
for (i in 2:(par1+1)) {
a<-table.row.start(a)
a<-table.element(a,i-1,header=TRUE)
a<-table.element(a,round(myacf[i],6))
mytstat <- myacf[i]*sqrtn
a<-table.element(a,round(mytstat,4))
a<-table.element(a,round(1-pt(abs(mytstat),lengthx),6))
a<-table.row.end(a)
}
a<-table.end(a)
table.save(a,file='mytable.tab')
a<-table.start()
a<-table.row.start(a)
a<-table.element(a,'Partial Autocorrelation Function',4,TRUE)
a<-table.row.end(a)
a<-table.row.start(a)
a<-table.element(a,'Time lag k',header=TRUE)
a<-table.element(a,'PACF(k)',header=TRUE)
a<-table.element(a,'T-STAT',header=TRUE)
a<-table.element(a,'P-value',header=TRUE)
a<-table.row.end(a)
for (i in 1:par1) {
a<-table.row.start(a)
a<-table.element(a,i,header=TRUE)
a<-table.element(a,round(mypacf[i],6))
mytstat <- mypacf[i]*sqrtn
a<-table.element(a,round(mytstat,4))
a<-table.element(a,round(1-pt(abs(mytstat),lengthx),6))
a<-table.row.end(a)
}
a<-table.end(a)
table.save(a,file='mytable1.tab')