Free Statistics

of Irreproducible Research!

Author's title

Author*The author of this computation has been verified*
R Software Modulerwasp_autocorrelation.wasp
Title produced by software(Partial) Autocorrelation Function
Date of computationThu, 21 Dec 2017 18:28:57 +0100
Cite this page as followsStatistical Computations at FreeStatistics.org, Office for Research Development and Education, URL https://freestatistics.org/blog/index.php?v=date/2017/Dec/21/t1513877388hpnwbtqqxj6dnw5.htm/, Retrieved Mon, 13 May 2024 23:17:52 +0000
Statistical Computations at FreeStatistics.org, Office for Research Development and Education, URL https://freestatistics.org/blog/index.php?pk=310679, Retrieved Mon, 13 May 2024 23:17:52 +0000
QR Codes:

Original text written by user:
IsPrivate?No (this computation is public)
User-defined keywords
Estimated Impact71
Family? (F = Feedback message, R = changed R code, M = changed R Module, P = changed Parameters, D = changed Data)
-       [(Partial) Autocorrelation Function] [] [2017-12-21 17:28:57] [8829069b4432872c842806a35f4fa8df] [Current]
Feedback Forum

Post a new message
Dataseries X:
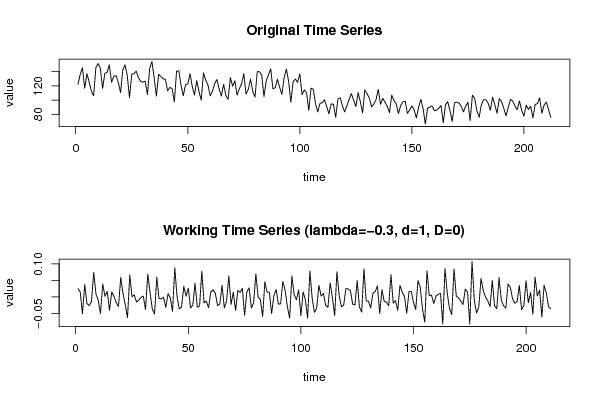
122.2
136.1
145.5
116.7
137.1
125.5
112.4
106.3
145.7
151.5
144.6
116.4
137.7
138.8
149.5
125
133.4
134.4
124.8
110.6
142.4
149.6
134.6
103.3
136.5
137.1
140.7
131.4
126.2
125.3
126.6
107.7
144.5
154.2
131.4
105.7
136.2
133.3
130
129.3
113.1
117.7
116.3
97.3
140.6
141.2
120.8
106.2
121.5
122.6
137.2
118.9
107.2
127.4
111.8
100
138.3
128
121.2
105.9
112.5
123.1
129
115.5
105.7
122.3
106.4
101.1
131.6
119.5
127
106.9
115.9
122.7
137.2
108.5
115.2
129.4
112.3
104.3
140
139.9
134.9
105.1
127
135.5
143.9
115.8
117.5
129.3
117.9
108.1
131.7
143.7
126.2
96.9
125.8
129.6
124.9
136.8
107.5
114.3
110.3
85.5
116.8
115.1
95.2
83.4
95.4
96.3
100.5
90.9
80.6
94.8
93.9
75.9
101.6
103.3
91.8
83.5
92
101.2
109.1
99.8
90.8
110.6
97.8
81.9
114.4
108.8
103.1
90.4
94.4
100.5
115.1
93.9
102.5
97.1
91.2
82.3
107.1
99.2
94.8
81.1
92.5
97.7
98.5
81.2
86.2
92
86.3
74.8
90
101.1
87.8
66.3
88.6
90
92
85.1
85.9
88.5
92.3
68
93.6
97.7
85.1
69.9
96.1
97
95.9
91.3
83.5
91.4
96.8
71
106.9
102.7
84.9
75.8
93.6
100.7
100.5
95.9
85.7
104.1
93.5
81.5
102.1
98.2
88.4
77.8
90.1
101
98.6
91.5
86.4
98.9
85.2
77.3
93
86.8
91.3
74.9
93.9
95
103.1
81.4
93.1
97.2
86.4
75.5


Summary of computational transaction
Raw Input view raw input (R code)
Raw Outputview raw output of R engine
Computing time2 seconds
R ServerBig Analytics Cloud Computing Center

\begin{tabular}{lllllllll}
\hline
Summary of computational transaction \tabularnewline
Raw Input view raw input (R code)  \tabularnewline
Raw Outputview raw output of R engine  \tabularnewline
Computing time2 seconds \tabularnewline
R ServerBig Analytics Cloud Computing Center \tabularnewline
\hline
\end{tabular}
%Source: https://freestatistics.org/blog/index.php?pk=310679&T=0

[TABLE]
[ROW]
Summary of computational transaction[/C][/ROW] [ROW]Raw Input[/C] view raw input (R code) [/C][/ROW] [ROW]Raw Output[/C]view raw output of R engine [/C][/ROW] [ROW]Computing time[/C]2 seconds[/C][/ROW] [ROW]R Server[/C]Big Analytics Cloud Computing Center[/C][/ROW] [/TABLE] Source: https://freestatistics.org/blog/index.php?pk=310679&T=0

Globally Unique Identifier (entire table): ba.freestatistics.org/blog/index.php?pk=310679&T=0

As an alternative you can also use a QR Code:  

The GUIDs for individual cells are displayed in the table below:

Summary of computational transaction
Raw Input view raw input (R code)
Raw Outputview raw output of R engine
Computing time2 seconds
R ServerBig Analytics Cloud Computing Center


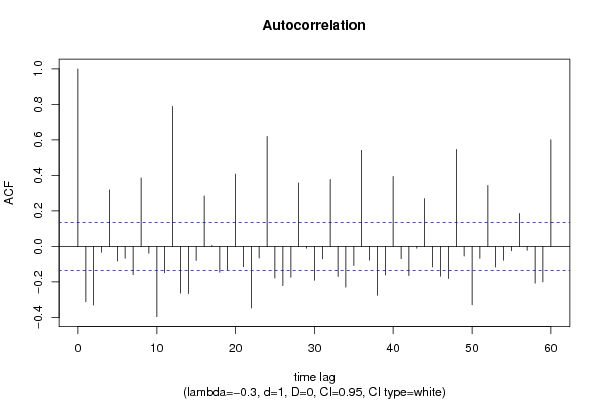
Autocorrelation Function
Time lag kACF(k)T-STATP-value
1-0.311968-4.53165e-06
2-0.329872-4.79172e-06
3-0.032872-0.47750.316751
40.3176684.61443e-06
5-0.081705-1.18680.118314
6-0.066269-0.96260.168421
7-0.158962-2.30910.010954
80.3854565.59910
9-0.038207-0.5550.289744
10-0.39547-5.74450
11-0.148106-2.15140.016292
120.78879511.45790
13-0.263021-3.82068.8e-05
14-0.264889-3.84777.9e-05
15-0.078558-1.14110.127557
160.2841254.12722.6e-05
170.0056930.08270.467088
18-0.145081-2.10740.018131
19-0.132157-1.91970.028123
200.4075045.91930
21-0.114172-1.65840.049357
22-0.346292-5.03021e-06
23-0.065273-0.94810.17207
240.6198579.00390
25-0.177519-2.57860.0053
26-0.220539-3.20350.000784
27-0.173554-2.5210.006221
280.3577745.1970
29-0.009597-0.13940.444629
30-0.190638-2.76920.00306
31-0.06886-1.00020.159169
320.377685.48610
33-0.168812-2.45210.007507
34-0.229345-3.33140.00051
35-0.107823-1.56620.059397
360.5412737.86250
37-0.077109-1.12010.131977
38-0.274901-3.99324.5e-05
39-0.160013-2.32430.010529
400.3943415.72810
41-0.069264-1.00610.157756
42-0.163382-2.37330.009265
43-0.009912-0.1440.442824
440.2695323.91526.1e-05
45-0.116271-1.68890.046355
46-0.167708-2.43610.007838
47-0.180798-2.62620.004633
480.5465487.93910
49-0.053547-0.77780.218774
50-0.328378-4.772e-06
51-0.066783-0.97010.166558
520.3433644.98771e-06
53-0.116118-1.68670.046568
54-0.077649-1.12790.130318
55-0.023995-0.34860.363886
560.1861072.70340.003712
57-0.021481-0.3120.377665
58-0.206658-3.00190.001503
59-0.1995-2.89790.002077
600.6012128.73310

\begin{tabular}{lllllllll}
\hline
Autocorrelation Function \tabularnewline
Time lag k & ACF(k) & T-STAT & P-value \tabularnewline
1 & -0.311968 & -4.5316 & 5e-06 \tabularnewline
2 & -0.329872 & -4.7917 & 2e-06 \tabularnewline
3 & -0.032872 & -0.4775 & 0.316751 \tabularnewline
4 & 0.317668 & 4.6144 & 3e-06 \tabularnewline
5 & -0.081705 & -1.1868 & 0.118314 \tabularnewline
6 & -0.066269 & -0.9626 & 0.168421 \tabularnewline
7 & -0.158962 & -2.3091 & 0.010954 \tabularnewline
8 & 0.385456 & 5.5991 & 0 \tabularnewline
9 & -0.038207 & -0.555 & 0.289744 \tabularnewline
10 & -0.39547 & -5.7445 & 0 \tabularnewline
11 & -0.148106 & -2.1514 & 0.016292 \tabularnewline
12 & 0.788795 & 11.4579 & 0 \tabularnewline
13 & -0.263021 & -3.8206 & 8.8e-05 \tabularnewline
14 & -0.264889 & -3.8477 & 7.9e-05 \tabularnewline
15 & -0.078558 & -1.1411 & 0.127557 \tabularnewline
16 & 0.284125 & 4.1272 & 2.6e-05 \tabularnewline
17 & 0.005693 & 0.0827 & 0.467088 \tabularnewline
18 & -0.145081 & -2.1074 & 0.018131 \tabularnewline
19 & -0.132157 & -1.9197 & 0.028123 \tabularnewline
20 & 0.407504 & 5.9193 & 0 \tabularnewline
21 & -0.114172 & -1.6584 & 0.049357 \tabularnewline
22 & -0.346292 & -5.0302 & 1e-06 \tabularnewline
23 & -0.065273 & -0.9481 & 0.17207 \tabularnewline
24 & 0.619857 & 9.0039 & 0 \tabularnewline
25 & -0.177519 & -2.5786 & 0.0053 \tabularnewline
26 & -0.220539 & -3.2035 & 0.000784 \tabularnewline
27 & -0.173554 & -2.521 & 0.006221 \tabularnewline
28 & 0.357774 & 5.197 & 0 \tabularnewline
29 & -0.009597 & -0.1394 & 0.444629 \tabularnewline
30 & -0.190638 & -2.7692 & 0.00306 \tabularnewline
31 & -0.06886 & -1.0002 & 0.159169 \tabularnewline
32 & 0.37768 & 5.4861 & 0 \tabularnewline
33 & -0.168812 & -2.4521 & 0.007507 \tabularnewline
34 & -0.229345 & -3.3314 & 0.00051 \tabularnewline
35 & -0.107823 & -1.5662 & 0.059397 \tabularnewline
36 & 0.541273 & 7.8625 & 0 \tabularnewline
37 & -0.077109 & -1.1201 & 0.131977 \tabularnewline
38 & -0.274901 & -3.9932 & 4.5e-05 \tabularnewline
39 & -0.160013 & -2.3243 & 0.010529 \tabularnewline
40 & 0.394341 & 5.7281 & 0 \tabularnewline
41 & -0.069264 & -1.0061 & 0.157756 \tabularnewline
42 & -0.163382 & -2.3733 & 0.009265 \tabularnewline
43 & -0.009912 & -0.144 & 0.442824 \tabularnewline
44 & 0.269532 & 3.9152 & 6.1e-05 \tabularnewline
45 & -0.116271 & -1.6889 & 0.046355 \tabularnewline
46 & -0.167708 & -2.4361 & 0.007838 \tabularnewline
47 & -0.180798 & -2.6262 & 0.004633 \tabularnewline
48 & 0.546548 & 7.9391 & 0 \tabularnewline
49 & -0.053547 & -0.7778 & 0.218774 \tabularnewline
50 & -0.328378 & -4.77 & 2e-06 \tabularnewline
51 & -0.066783 & -0.9701 & 0.166558 \tabularnewline
52 & 0.343364 & 4.9877 & 1e-06 \tabularnewline
53 & -0.116118 & -1.6867 & 0.046568 \tabularnewline
54 & -0.077649 & -1.1279 & 0.130318 \tabularnewline
55 & -0.023995 & -0.3486 & 0.363886 \tabularnewline
56 & 0.186107 & 2.7034 & 0.003712 \tabularnewline
57 & -0.021481 & -0.312 & 0.377665 \tabularnewline
58 & -0.206658 & -3.0019 & 0.001503 \tabularnewline
59 & -0.1995 & -2.8979 & 0.002077 \tabularnewline
60 & 0.601212 & 8.7331 & 0 \tabularnewline
\hline
\end{tabular}
%Source: https://freestatistics.org/blog/index.php?pk=310679&T=1

[TABLE]
[ROW][C]Autocorrelation Function[/C][/ROW]
[ROW][C]Time lag k[/C][C]ACF(k)[/C][C]T-STAT[/C][C]P-value[/C][/ROW]
[ROW][C]1[/C][C]-0.311968[/C][C]-4.5316[/C][C]5e-06[/C][/ROW]
[ROW][C]2[/C][C]-0.329872[/C][C]-4.7917[/C][C]2e-06[/C][/ROW]
[ROW][C]3[/C][C]-0.032872[/C][C]-0.4775[/C][C]0.316751[/C][/ROW]
[ROW][C]4[/C][C]0.317668[/C][C]4.6144[/C][C]3e-06[/C][/ROW]
[ROW][C]5[/C][C]-0.081705[/C][C]-1.1868[/C][C]0.118314[/C][/ROW]
[ROW][C]6[/C][C]-0.066269[/C][C]-0.9626[/C][C]0.168421[/C][/ROW]
[ROW][C]7[/C][C]-0.158962[/C][C]-2.3091[/C][C]0.010954[/C][/ROW]
[ROW][C]8[/C][C]0.385456[/C][C]5.5991[/C][C]0[/C][/ROW]
[ROW][C]9[/C][C]-0.038207[/C][C]-0.555[/C][C]0.289744[/C][/ROW]
[ROW][C]10[/C][C]-0.39547[/C][C]-5.7445[/C][C]0[/C][/ROW]
[ROW][C]11[/C][C]-0.148106[/C][C]-2.1514[/C][C]0.016292[/C][/ROW]
[ROW][C]12[/C][C]0.788795[/C][C]11.4579[/C][C]0[/C][/ROW]
[ROW][C]13[/C][C]-0.263021[/C][C]-3.8206[/C][C]8.8e-05[/C][/ROW]
[ROW][C]14[/C][C]-0.264889[/C][C]-3.8477[/C][C]7.9e-05[/C][/ROW]
[ROW][C]15[/C][C]-0.078558[/C][C]-1.1411[/C][C]0.127557[/C][/ROW]
[ROW][C]16[/C][C]0.284125[/C][C]4.1272[/C][C]2.6e-05[/C][/ROW]
[ROW][C]17[/C][C]0.005693[/C][C]0.0827[/C][C]0.467088[/C][/ROW]
[ROW][C]18[/C][C]-0.145081[/C][C]-2.1074[/C][C]0.018131[/C][/ROW]
[ROW][C]19[/C][C]-0.132157[/C][C]-1.9197[/C][C]0.028123[/C][/ROW]
[ROW][C]20[/C][C]0.407504[/C][C]5.9193[/C][C]0[/C][/ROW]
[ROW][C]21[/C][C]-0.114172[/C][C]-1.6584[/C][C]0.049357[/C][/ROW]
[ROW][C]22[/C][C]-0.346292[/C][C]-5.0302[/C][C]1e-06[/C][/ROW]
[ROW][C]23[/C][C]-0.065273[/C][C]-0.9481[/C][C]0.17207[/C][/ROW]
[ROW][C]24[/C][C]0.619857[/C][C]9.0039[/C][C]0[/C][/ROW]
[ROW][C]25[/C][C]-0.177519[/C][C]-2.5786[/C][C]0.0053[/C][/ROW]
[ROW][C]26[/C][C]-0.220539[/C][C]-3.2035[/C][C]0.000784[/C][/ROW]
[ROW][C]27[/C][C]-0.173554[/C][C]-2.521[/C][C]0.006221[/C][/ROW]
[ROW][C]28[/C][C]0.357774[/C][C]5.197[/C][C]0[/C][/ROW]
[ROW][C]29[/C][C]-0.009597[/C][C]-0.1394[/C][C]0.444629[/C][/ROW]
[ROW][C]30[/C][C]-0.190638[/C][C]-2.7692[/C][C]0.00306[/C][/ROW]
[ROW][C]31[/C][C]-0.06886[/C][C]-1.0002[/C][C]0.159169[/C][/ROW]
[ROW][C]32[/C][C]0.37768[/C][C]5.4861[/C][C]0[/C][/ROW]
[ROW][C]33[/C][C]-0.168812[/C][C]-2.4521[/C][C]0.007507[/C][/ROW]
[ROW][C]34[/C][C]-0.229345[/C][C]-3.3314[/C][C]0.00051[/C][/ROW]
[ROW][C]35[/C][C]-0.107823[/C][C]-1.5662[/C][C]0.059397[/C][/ROW]
[ROW][C]36[/C][C]0.541273[/C][C]7.8625[/C][C]0[/C][/ROW]
[ROW][C]37[/C][C]-0.077109[/C][C]-1.1201[/C][C]0.131977[/C][/ROW]
[ROW][C]38[/C][C]-0.274901[/C][C]-3.9932[/C][C]4.5e-05[/C][/ROW]
[ROW][C]39[/C][C]-0.160013[/C][C]-2.3243[/C][C]0.010529[/C][/ROW]
[ROW][C]40[/C][C]0.394341[/C][C]5.7281[/C][C]0[/C][/ROW]
[ROW][C]41[/C][C]-0.069264[/C][C]-1.0061[/C][C]0.157756[/C][/ROW]
[ROW][C]42[/C][C]-0.163382[/C][C]-2.3733[/C][C]0.009265[/C][/ROW]
[ROW][C]43[/C][C]-0.009912[/C][C]-0.144[/C][C]0.442824[/C][/ROW]
[ROW][C]44[/C][C]0.269532[/C][C]3.9152[/C][C]6.1e-05[/C][/ROW]
[ROW][C]45[/C][C]-0.116271[/C][C]-1.6889[/C][C]0.046355[/C][/ROW]
[ROW][C]46[/C][C]-0.167708[/C][C]-2.4361[/C][C]0.007838[/C][/ROW]
[ROW][C]47[/C][C]-0.180798[/C][C]-2.6262[/C][C]0.004633[/C][/ROW]
[ROW][C]48[/C][C]0.546548[/C][C]7.9391[/C][C]0[/C][/ROW]
[ROW][C]49[/C][C]-0.053547[/C][C]-0.7778[/C][C]0.218774[/C][/ROW]
[ROW][C]50[/C][C]-0.328378[/C][C]-4.77[/C][C]2e-06[/C][/ROW]
[ROW][C]51[/C][C]-0.066783[/C][C]-0.9701[/C][C]0.166558[/C][/ROW]
[ROW][C]52[/C][C]0.343364[/C][C]4.9877[/C][C]1e-06[/C][/ROW]
[ROW][C]53[/C][C]-0.116118[/C][C]-1.6867[/C][C]0.046568[/C][/ROW]
[ROW][C]54[/C][C]-0.077649[/C][C]-1.1279[/C][C]0.130318[/C][/ROW]
[ROW][C]55[/C][C]-0.023995[/C][C]-0.3486[/C][C]0.363886[/C][/ROW]
[ROW][C]56[/C][C]0.186107[/C][C]2.7034[/C][C]0.003712[/C][/ROW]
[ROW][C]57[/C][C]-0.021481[/C][C]-0.312[/C][C]0.377665[/C][/ROW]
[ROW][C]58[/C][C]-0.206658[/C][C]-3.0019[/C][C]0.001503[/C][/ROW]
[ROW][C]59[/C][C]-0.1995[/C][C]-2.8979[/C][C]0.002077[/C][/ROW]
[ROW][C]60[/C][C]0.601212[/C][C]8.7331[/C][C]0[/C][/ROW]
[/TABLE]
Source: https://freestatistics.org/blog/index.php?pk=310679&T=1

Globally Unique Identifier (entire table): ba.freestatistics.org/blog/index.php?pk=310679&T=1

As an alternative you can also use a QR Code:  

The GUIDs for individual cells are displayed in the table below:

Autocorrelation Function
Time lag kACF(k)T-STATP-value
1-0.311968-4.53165e-06
2-0.329872-4.79172e-06
3-0.032872-0.47750.316751
40.3176684.61443e-06
5-0.081705-1.18680.118314
6-0.066269-0.96260.168421
7-0.158962-2.30910.010954
80.3854565.59910
9-0.038207-0.5550.289744
10-0.39547-5.74450
11-0.148106-2.15140.016292
120.78879511.45790
13-0.263021-3.82068.8e-05
14-0.264889-3.84777.9e-05
15-0.078558-1.14110.127557
160.2841254.12722.6e-05
170.0056930.08270.467088
18-0.145081-2.10740.018131
19-0.132157-1.91970.028123
200.4075045.91930
21-0.114172-1.65840.049357
22-0.346292-5.03021e-06
23-0.065273-0.94810.17207
240.6198579.00390
25-0.177519-2.57860.0053
26-0.220539-3.20350.000784
27-0.173554-2.5210.006221
280.3577745.1970
29-0.009597-0.13940.444629
30-0.190638-2.76920.00306
31-0.06886-1.00020.159169
320.377685.48610
33-0.168812-2.45210.007507
34-0.229345-3.33140.00051
35-0.107823-1.56620.059397
360.5412737.86250
37-0.077109-1.12010.131977
38-0.274901-3.99324.5e-05
39-0.160013-2.32430.010529
400.3943415.72810
41-0.069264-1.00610.157756
42-0.163382-2.37330.009265
43-0.009912-0.1440.442824
440.2695323.91526.1e-05
45-0.116271-1.68890.046355
46-0.167708-2.43610.007838
47-0.180798-2.62620.004633
480.5465487.93910
49-0.053547-0.77780.218774
50-0.328378-4.772e-06
51-0.066783-0.97010.166558
520.3433644.98771e-06
53-0.116118-1.68670.046568
54-0.077649-1.12790.130318
55-0.023995-0.34860.363886
560.1861072.70340.003712
57-0.021481-0.3120.377665
58-0.206658-3.00190.001503
59-0.1995-2.89790.002077
600.6012128.73310


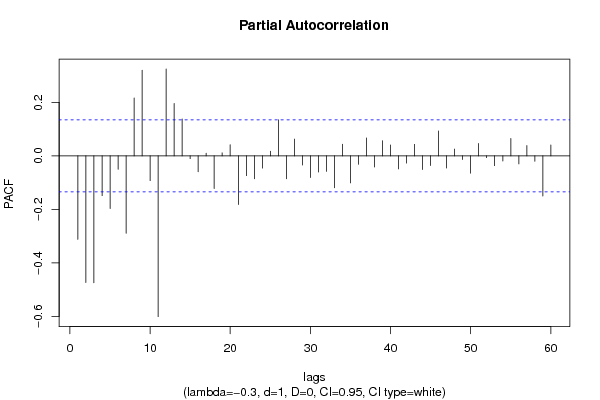
Partial Autocorrelation Function
Time lag kPACF(k)T-STATP-value
1-0.311968-4.53165e-06
2-0.473255-6.87440
3-0.474122-6.8870
4-0.148652-2.15930.015978
5-0.196685-2.8570.002352
6-0.050018-0.72660.234153
7-0.289482-4.2051.9e-05
80.2161173.13930.000968
90.3201094.64983e-06
10-0.092509-1.34380.090233
11-0.600897-8.72850
120.324974.72052e-06
130.1955712.84080.00247
140.1379382.00370.023193
15-0.010326-0.150.440457
16-0.059032-0.85750.196075
170.0102140.14840.441098
18-0.122151-1.77430.038724
190.0113160.16440.434796
200.0418860.60840.271781
21-0.181835-2.64130.004438
22-0.073721-1.07090.142727
23-0.085557-1.24280.107662
24-0.045633-0.66290.254075
250.0176690.25670.398846
260.1346141.95540.025929
27-0.085783-1.24610.107059
280.0626690.91030.181844
29-0.033846-0.49160.31174
30-0.080976-1.17620.120412
31-0.060244-0.87510.191259
32-0.058038-0.84310.200076
33-0.119167-1.7310.042457
340.043410.63060.264503
35-0.100849-1.46490.072217
36-0.031213-0.45340.325367
370.0666360.96790.167091
38-0.041628-0.60470.273021
390.0564260.81960.206676
400.0409470.59480.276312
41-0.048566-0.70550.240651
42-0.026968-0.39170.347825
430.0431030.62610.265961
44-0.051063-0.74170.229536
45-0.036129-0.52480.300133
460.0931981.35380.088627
47-0.045303-0.65810.255606
480.0254060.3690.356232
49-0.013645-0.19820.421536
50-0.06456-0.93780.174712
510.046520.67570.249972
52-0.006438-0.09350.462788
53-0.036317-0.52750.29919
54-0.019116-0.27770.390767
550.0647190.94010.174121
56-0.029886-0.43410.332322
570.0384460.55850.288563
58-0.020369-0.29590.383809
59-0.149859-2.17680.015302
600.0409110.59430.276484

\begin{tabular}{lllllllll}
\hline
Partial Autocorrelation Function \tabularnewline
Time lag k & PACF(k) & T-STAT & P-value \tabularnewline
1 & -0.311968 & -4.5316 & 5e-06 \tabularnewline
2 & -0.473255 & -6.8744 & 0 \tabularnewline
3 & -0.474122 & -6.887 & 0 \tabularnewline
4 & -0.148652 & -2.1593 & 0.015978 \tabularnewline
5 & -0.196685 & -2.857 & 0.002352 \tabularnewline
6 & -0.050018 & -0.7266 & 0.234153 \tabularnewline
7 & -0.289482 & -4.205 & 1.9e-05 \tabularnewline
8 & 0.216117 & 3.1393 & 0.000968 \tabularnewline
9 & 0.320109 & 4.6498 & 3e-06 \tabularnewline
10 & -0.092509 & -1.3438 & 0.090233 \tabularnewline
11 & -0.600897 & -8.7285 & 0 \tabularnewline
12 & 0.32497 & 4.7205 & 2e-06 \tabularnewline
13 & 0.195571 & 2.8408 & 0.00247 \tabularnewline
14 & 0.137938 & 2.0037 & 0.023193 \tabularnewline
15 & -0.010326 & -0.15 & 0.440457 \tabularnewline
16 & -0.059032 & -0.8575 & 0.196075 \tabularnewline
17 & 0.010214 & 0.1484 & 0.441098 \tabularnewline
18 & -0.122151 & -1.7743 & 0.038724 \tabularnewline
19 & 0.011316 & 0.1644 & 0.434796 \tabularnewline
20 & 0.041886 & 0.6084 & 0.271781 \tabularnewline
21 & -0.181835 & -2.6413 & 0.004438 \tabularnewline
22 & -0.073721 & -1.0709 & 0.142727 \tabularnewline
23 & -0.085557 & -1.2428 & 0.107662 \tabularnewline
24 & -0.045633 & -0.6629 & 0.254075 \tabularnewline
25 & 0.017669 & 0.2567 & 0.398846 \tabularnewline
26 & 0.134614 & 1.9554 & 0.025929 \tabularnewline
27 & -0.085783 & -1.2461 & 0.107059 \tabularnewline
28 & 0.062669 & 0.9103 & 0.181844 \tabularnewline
29 & -0.033846 & -0.4916 & 0.31174 \tabularnewline
30 & -0.080976 & -1.1762 & 0.120412 \tabularnewline
31 & -0.060244 & -0.8751 & 0.191259 \tabularnewline
32 & -0.058038 & -0.8431 & 0.200076 \tabularnewline
33 & -0.119167 & -1.731 & 0.042457 \tabularnewline
34 & 0.04341 & 0.6306 & 0.264503 \tabularnewline
35 & -0.100849 & -1.4649 & 0.072217 \tabularnewline
36 & -0.031213 & -0.4534 & 0.325367 \tabularnewline
37 & 0.066636 & 0.9679 & 0.167091 \tabularnewline
38 & -0.041628 & -0.6047 & 0.273021 \tabularnewline
39 & 0.056426 & 0.8196 & 0.206676 \tabularnewline
40 & 0.040947 & 0.5948 & 0.276312 \tabularnewline
41 & -0.048566 & -0.7055 & 0.240651 \tabularnewline
42 & -0.026968 & -0.3917 & 0.347825 \tabularnewline
43 & 0.043103 & 0.6261 & 0.265961 \tabularnewline
44 & -0.051063 & -0.7417 & 0.229536 \tabularnewline
45 & -0.036129 & -0.5248 & 0.300133 \tabularnewline
46 & 0.093198 & 1.3538 & 0.088627 \tabularnewline
47 & -0.045303 & -0.6581 & 0.255606 \tabularnewline
48 & 0.025406 & 0.369 & 0.356232 \tabularnewline
49 & -0.013645 & -0.1982 & 0.421536 \tabularnewline
50 & -0.06456 & -0.9378 & 0.174712 \tabularnewline
51 & 0.04652 & 0.6757 & 0.249972 \tabularnewline
52 & -0.006438 & -0.0935 & 0.462788 \tabularnewline
53 & -0.036317 & -0.5275 & 0.29919 \tabularnewline
54 & -0.019116 & -0.2777 & 0.390767 \tabularnewline
55 & 0.064719 & 0.9401 & 0.174121 \tabularnewline
56 & -0.029886 & -0.4341 & 0.332322 \tabularnewline
57 & 0.038446 & 0.5585 & 0.288563 \tabularnewline
58 & -0.020369 & -0.2959 & 0.383809 \tabularnewline
59 & -0.149859 & -2.1768 & 0.015302 \tabularnewline
60 & 0.040911 & 0.5943 & 0.276484 \tabularnewline
\hline
\end{tabular}
%Source: https://freestatistics.org/blog/index.php?pk=310679&T=2

[TABLE]
[ROW][C]Partial Autocorrelation Function[/C][/ROW]
[ROW][C]Time lag k[/C][C]PACF(k)[/C][C]T-STAT[/C][C]P-value[/C][/ROW]
[ROW][C]1[/C][C]-0.311968[/C][C]-4.5316[/C][C]5e-06[/C][/ROW]
[ROW][C]2[/C][C]-0.473255[/C][C]-6.8744[/C][C]0[/C][/ROW]
[ROW][C]3[/C][C]-0.474122[/C][C]-6.887[/C][C]0[/C][/ROW]
[ROW][C]4[/C][C]-0.148652[/C][C]-2.1593[/C][C]0.015978[/C][/ROW]
[ROW][C]5[/C][C]-0.196685[/C][C]-2.857[/C][C]0.002352[/C][/ROW]
[ROW][C]6[/C][C]-0.050018[/C][C]-0.7266[/C][C]0.234153[/C][/ROW]
[ROW][C]7[/C][C]-0.289482[/C][C]-4.205[/C][C]1.9e-05[/C][/ROW]
[ROW][C]8[/C][C]0.216117[/C][C]3.1393[/C][C]0.000968[/C][/ROW]
[ROW][C]9[/C][C]0.320109[/C][C]4.6498[/C][C]3e-06[/C][/ROW]
[ROW][C]10[/C][C]-0.092509[/C][C]-1.3438[/C][C]0.090233[/C][/ROW]
[ROW][C]11[/C][C]-0.600897[/C][C]-8.7285[/C][C]0[/C][/ROW]
[ROW][C]12[/C][C]0.32497[/C][C]4.7205[/C][C]2e-06[/C][/ROW]
[ROW][C]13[/C][C]0.195571[/C][C]2.8408[/C][C]0.00247[/C][/ROW]
[ROW][C]14[/C][C]0.137938[/C][C]2.0037[/C][C]0.023193[/C][/ROW]
[ROW][C]15[/C][C]-0.010326[/C][C]-0.15[/C][C]0.440457[/C][/ROW]
[ROW][C]16[/C][C]-0.059032[/C][C]-0.8575[/C][C]0.196075[/C][/ROW]
[ROW][C]17[/C][C]0.010214[/C][C]0.1484[/C][C]0.441098[/C][/ROW]
[ROW][C]18[/C][C]-0.122151[/C][C]-1.7743[/C][C]0.038724[/C][/ROW]
[ROW][C]19[/C][C]0.011316[/C][C]0.1644[/C][C]0.434796[/C][/ROW]
[ROW][C]20[/C][C]0.041886[/C][C]0.6084[/C][C]0.271781[/C][/ROW]
[ROW][C]21[/C][C]-0.181835[/C][C]-2.6413[/C][C]0.004438[/C][/ROW]
[ROW][C]22[/C][C]-0.073721[/C][C]-1.0709[/C][C]0.142727[/C][/ROW]
[ROW][C]23[/C][C]-0.085557[/C][C]-1.2428[/C][C]0.107662[/C][/ROW]
[ROW][C]24[/C][C]-0.045633[/C][C]-0.6629[/C][C]0.254075[/C][/ROW]
[ROW][C]25[/C][C]0.017669[/C][C]0.2567[/C][C]0.398846[/C][/ROW]
[ROW][C]26[/C][C]0.134614[/C][C]1.9554[/C][C]0.025929[/C][/ROW]
[ROW][C]27[/C][C]-0.085783[/C][C]-1.2461[/C][C]0.107059[/C][/ROW]
[ROW][C]28[/C][C]0.062669[/C][C]0.9103[/C][C]0.181844[/C][/ROW]
[ROW][C]29[/C][C]-0.033846[/C][C]-0.4916[/C][C]0.31174[/C][/ROW]
[ROW][C]30[/C][C]-0.080976[/C][C]-1.1762[/C][C]0.120412[/C][/ROW]
[ROW][C]31[/C][C]-0.060244[/C][C]-0.8751[/C][C]0.191259[/C][/ROW]
[ROW][C]32[/C][C]-0.058038[/C][C]-0.8431[/C][C]0.200076[/C][/ROW]
[ROW][C]33[/C][C]-0.119167[/C][C]-1.731[/C][C]0.042457[/C][/ROW]
[ROW][C]34[/C][C]0.04341[/C][C]0.6306[/C][C]0.264503[/C][/ROW]
[ROW][C]35[/C][C]-0.100849[/C][C]-1.4649[/C][C]0.072217[/C][/ROW]
[ROW][C]36[/C][C]-0.031213[/C][C]-0.4534[/C][C]0.325367[/C][/ROW]
[ROW][C]37[/C][C]0.066636[/C][C]0.9679[/C][C]0.167091[/C][/ROW]
[ROW][C]38[/C][C]-0.041628[/C][C]-0.6047[/C][C]0.273021[/C][/ROW]
[ROW][C]39[/C][C]0.056426[/C][C]0.8196[/C][C]0.206676[/C][/ROW]
[ROW][C]40[/C][C]0.040947[/C][C]0.5948[/C][C]0.276312[/C][/ROW]
[ROW][C]41[/C][C]-0.048566[/C][C]-0.7055[/C][C]0.240651[/C][/ROW]
[ROW][C]42[/C][C]-0.026968[/C][C]-0.3917[/C][C]0.347825[/C][/ROW]
[ROW][C]43[/C][C]0.043103[/C][C]0.6261[/C][C]0.265961[/C][/ROW]
[ROW][C]44[/C][C]-0.051063[/C][C]-0.7417[/C][C]0.229536[/C][/ROW]
[ROW][C]45[/C][C]-0.036129[/C][C]-0.5248[/C][C]0.300133[/C][/ROW]
[ROW][C]46[/C][C]0.093198[/C][C]1.3538[/C][C]0.088627[/C][/ROW]
[ROW][C]47[/C][C]-0.045303[/C][C]-0.6581[/C][C]0.255606[/C][/ROW]
[ROW][C]48[/C][C]0.025406[/C][C]0.369[/C][C]0.356232[/C][/ROW]
[ROW][C]49[/C][C]-0.013645[/C][C]-0.1982[/C][C]0.421536[/C][/ROW]
[ROW][C]50[/C][C]-0.06456[/C][C]-0.9378[/C][C]0.174712[/C][/ROW]
[ROW][C]51[/C][C]0.04652[/C][C]0.6757[/C][C]0.249972[/C][/ROW]
[ROW][C]52[/C][C]-0.006438[/C][C]-0.0935[/C][C]0.462788[/C][/ROW]
[ROW][C]53[/C][C]-0.036317[/C][C]-0.5275[/C][C]0.29919[/C][/ROW]
[ROW][C]54[/C][C]-0.019116[/C][C]-0.2777[/C][C]0.390767[/C][/ROW]
[ROW][C]55[/C][C]0.064719[/C][C]0.9401[/C][C]0.174121[/C][/ROW]
[ROW][C]56[/C][C]-0.029886[/C][C]-0.4341[/C][C]0.332322[/C][/ROW]
[ROW][C]57[/C][C]0.038446[/C][C]0.5585[/C][C]0.288563[/C][/ROW]
[ROW][C]58[/C][C]-0.020369[/C][C]-0.2959[/C][C]0.383809[/C][/ROW]
[ROW][C]59[/C][C]-0.149859[/C][C]-2.1768[/C][C]0.015302[/C][/ROW]
[ROW][C]60[/C][C]0.040911[/C][C]0.5943[/C][C]0.276484[/C][/ROW]
[/TABLE]
Source: https://freestatistics.org/blog/index.php?pk=310679&T=2

Globally Unique Identifier (entire table): ba.freestatistics.org/blog/index.php?pk=310679&T=2

As an alternative you can also use a QR Code:  

The GUIDs for individual cells are displayed in the table below:

Partial Autocorrelation Function
Time lag kPACF(k)T-STATP-value
1-0.311968-4.53165e-06
2-0.473255-6.87440
3-0.474122-6.8870
4-0.148652-2.15930.015978
5-0.196685-2.8570.002352
6-0.050018-0.72660.234153
7-0.289482-4.2051.9e-05
80.2161173.13930.000968
90.3201094.64983e-06
10-0.092509-1.34380.090233
11-0.600897-8.72850
120.324974.72052e-06
130.1955712.84080.00247
140.1379382.00370.023193
15-0.010326-0.150.440457
16-0.059032-0.85750.196075
170.0102140.14840.441098
18-0.122151-1.77430.038724
190.0113160.16440.434796
200.0418860.60840.271781
21-0.181835-2.64130.004438
22-0.073721-1.07090.142727
23-0.085557-1.24280.107662
24-0.045633-0.66290.254075
250.0176690.25670.398846
260.1346141.95540.025929
27-0.085783-1.24610.107059
280.0626690.91030.181844
29-0.033846-0.49160.31174
30-0.080976-1.17620.120412
31-0.060244-0.87510.191259
32-0.058038-0.84310.200076
33-0.119167-1.7310.042457
340.043410.63060.264503
35-0.100849-1.46490.072217
36-0.031213-0.45340.325367
370.0666360.96790.167091
38-0.041628-0.60470.273021
390.0564260.81960.206676
400.0409470.59480.276312
41-0.048566-0.70550.240651
42-0.026968-0.39170.347825
430.0431030.62610.265961
44-0.051063-0.74170.229536
45-0.036129-0.52480.300133
460.0931981.35380.088627
47-0.045303-0.65810.255606
480.0254060.3690.356232
49-0.013645-0.19820.421536
50-0.06456-0.93780.174712
510.046520.67570.249972
52-0.006438-0.09350.462788
53-0.036317-0.52750.29919
54-0.019116-0.27770.390767
550.0647190.94010.174121
56-0.029886-0.43410.332322
570.0384460.55850.288563
58-0.020369-0.29590.383809
59-0.149859-2.17680.015302
600.0409110.59430.276484


Parameters (Session):
par1 = 60 ; par2 = -0.3 ; par3 = 1 ; par4 = 0 ; par5 = 12 ; par6 = White Noise ; par7 = 0.95 ;
Parameters (R input):
par1 = 60 ; par2 = -0.3 ; par3 = 1 ; par4 = 0 ; par5 = 12 ; par6 = White Noise ; par7 = 0.95 ; par8 = ;
R code (references can be found in the software module):
if (par1 == 'Default') {
par1 = 10*log10(length(x))
} else {
par1 <- as.numeric(par1)
}
par2 <- as.numeric(par2)
par3 <- as.numeric(par3)
par4 <- as.numeric(par4)
par5 <- as.numeric(par5)
if (par6 == 'White Noise') par6 <- 'white' else par6 <- 'ma'
par7 <- as.numeric(par7)
if (par8 != '') par8 <- as.numeric(par8)
x <- na.omit(x)
ox <- x
if (par8 == '') {
if (par2 == 0) {
x <- log(x)
} else {
x <- (x ^ par2 - 1) / par2
}
} else {
x <- log(x,base=par8)
}
if (par3 > 0) x <- diff(x,lag=1,difference=par3)
if (par4 > 0) x <- diff(x,lag=par5,difference=par4)
bitmap(file='picts.png')
op <- par(mfrow=c(2,1))
plot(ox,type='l',main='Original Time Series',xlab='time',ylab='value')
if (par8=='') {
mytitle <- paste('Working Time Series (lambda=',par2,', d=',par3,', D=',par4,')',sep='')
mysub <- paste('(lambda=',par2,', d=',par3,', D=',par4,', CI=', par7, ', CI type=',par6,')',sep='')
} else {
mytitle <- paste('Working Time Series (base=',par8,', d=',par3,', D=',par4,')',sep='')
mysub <- paste('(base=',par8,', d=',par3,', D=',par4,', CI=', par7, ', CI type=',par6,')',sep='')
}
plot(x,type='l', main=mytitle,xlab='time',ylab='value')
par(op)
dev.off()
bitmap(file='pic1.png')
racf <- acf(x, par1, main='Autocorrelation', xlab='time lag', ylab='ACF', ci.type=par6, ci=par7, sub=mysub)
dev.off()
bitmap(file='pic2.png')
rpacf <- pacf(x,par1,main='Partial Autocorrelation',xlab='lags',ylab='PACF',sub=mysub)
dev.off()
(myacf <- c(racf$acf))
(mypacf <- c(rpacf$acf))
lengthx <- length(x)
sqrtn <- sqrt(lengthx)
load(file='createtable')
a<-table.start()
a<-table.row.start(a)
a<-table.element(a,'Autocorrelation Function',4,TRUE)
a<-table.row.end(a)
a<-table.row.start(a)
a<-table.element(a,'Time lag k',header=TRUE)
a<-table.element(a,'ACF(k)',header=TRUE)
a<-table.element(a,'T-STAT',header=TRUE)
a<-table.element(a,'P-value',header=TRUE)
a<-table.row.end(a)
for (i in 2:(par1+1)) {
a<-table.row.start(a)
a<-table.element(a,i-1,header=TRUE)
a<-table.element(a,round(myacf[i],6))
mytstat <- myacf[i]*sqrtn
a<-table.element(a,round(mytstat,4))
a<-table.element(a,round(1-pt(abs(mytstat),lengthx),6))
a<-table.row.end(a)
}
a<-table.end(a)
table.save(a,file='mytable.tab')
a<-table.start()
a<-table.row.start(a)
a<-table.element(a,'Partial Autocorrelation Function',4,TRUE)
a<-table.row.end(a)
a<-table.row.start(a)
a<-table.element(a,'Time lag k',header=TRUE)
a<-table.element(a,'PACF(k)',header=TRUE)
a<-table.element(a,'T-STAT',header=TRUE)
a<-table.element(a,'P-value',header=TRUE)
a<-table.row.end(a)
for (i in 1:par1) {
a<-table.row.start(a)
a<-table.element(a,i,header=TRUE)
a<-table.element(a,round(mypacf[i],6))
mytstat <- mypacf[i]*sqrtn
a<-table.element(a,round(mytstat,4))
a<-table.element(a,round(1-pt(abs(mytstat),lengthx),6))
a<-table.row.end(a)
}
a<-table.end(a)
table.save(a,file='mytable1.tab')