Free Statistics

of Irreproducible Research!

Author's title

Author*The author of this computation has been verified*
R Software Modulerwasp_autocorrelation.wasp
Title produced by software(Partial) Autocorrelation Function
Date of computationThu, 21 Dec 2017 18:24:49 +0100
Cite this page as followsStatistical Computations at FreeStatistics.org, Office for Research Development and Education, URL https://freestatistics.org/blog/index.php?v=date/2017/Dec/21/t1513877103b2lzhmnkfd5790y.htm/, Retrieved Mon, 13 May 2024 22:48:48 +0000
Statistical Computations at FreeStatistics.org, Office for Research Development and Education, URL https://freestatistics.org/blog/index.php?pk=310678, Retrieved Mon, 13 May 2024 22:48:48 +0000
QR Codes:

Original text written by user:
IsPrivate?No (this computation is public)
User-defined keywords
Estimated Impact39
Family? (F = Feedback message, R = changed R code, M = changed R Module, P = changed Parameters, D = changed Data)
-       [(Partial) Autocorrelation Function] [] [2017-12-21 17:24:49] [8829069b4432872c842806a35f4fa8df] [Current]
Feedback Forum

Post a new message
Dataseries X:
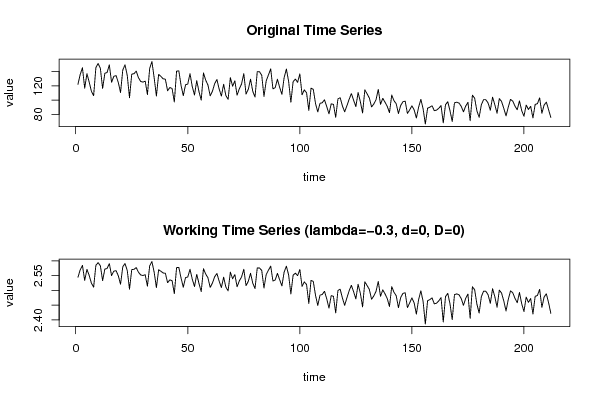
122.2
136.1
145.5
116.7
137.1
125.5
112.4
106.3
145.7
151.5
144.6
116.4
137.7
138.8
149.5
125
133.4
134.4
124.8
110.6
142.4
149.6
134.6
103.3
136.5
137.1
140.7
131.4
126.2
125.3
126.6
107.7
144.5
154.2
131.4
105.7
136.2
133.3
130
129.3
113.1
117.7
116.3
97.3
140.6
141.2
120.8
106.2
121.5
122.6
137.2
118.9
107.2
127.4
111.8
100
138.3
128
121.2
105.9
112.5
123.1
129
115.5
105.7
122.3
106.4
101.1
131.6
119.5
127
106.9
115.9
122.7
137.2
108.5
115.2
129.4
112.3
104.3
140
139.9
134.9
105.1
127
135.5
143.9
115.8
117.5
129.3
117.9
108.1
131.7
143.7
126.2
96.9
125.8
129.6
124.9
136.8
107.5
114.3
110.3
85.5
116.8
115.1
95.2
83.4
95.4
96.3
100.5
90.9
80.6
94.8
93.9
75.9
101.6
103.3
91.8
83.5
92
101.2
109.1
99.8
90.8
110.6
97.8
81.9
114.4
108.8
103.1
90.4
94.4
100.5
115.1
93.9
102.5
97.1
91.2
82.3
107.1
99.2
94.8
81.1
92.5
97.7
98.5
81.2
86.2
92
86.3
74.8
90
101.1
87.8
66.3
88.6
90
92
85.1
85.9
88.5
92.3
68
93.6
97.7
85.1
69.9
96.1
97
95.9
91.3
83.5
91.4
96.8
71
106.9
102.7
84.9
75.8
93.6
100.7
100.5
95.9
85.7
104.1
93.5
81.5
102.1
98.2
88.4
77.8
90.1
101
98.6
91.5
86.4
98.9
85.2
77.3
93
86.8
91.3
74.9
93.9
95
103.1
81.4
93.1
97.2
86.4
75.5


Summary of computational transaction
Raw Input view raw input (R code)
Raw Outputview raw output of R engine
Computing time2 seconds
R ServerBig Analytics Cloud Computing Center

\begin{tabular}{lllllllll}
\hline
Summary of computational transaction \tabularnewline
Raw Input view raw input (R code)  \tabularnewline
Raw Outputview raw output of R engine  \tabularnewline
Computing time2 seconds \tabularnewline
R ServerBig Analytics Cloud Computing Center \tabularnewline
\hline
\end{tabular}
%Source: https://freestatistics.org/blog/index.php?pk=310678&T=0

[TABLE]
[ROW]
Summary of computational transaction[/C][/ROW] [ROW]Raw Input[/C] view raw input (R code) [/C][/ROW] [ROW]Raw Output[/C]view raw output of R engine [/C][/ROW] [ROW]Computing time[/C]2 seconds[/C][/ROW] [ROW]R Server[/C]Big Analytics Cloud Computing Center[/C][/ROW] [/TABLE] Source: https://freestatistics.org/blog/index.php?pk=310678&T=0

Globally Unique Identifier (entire table): ba.freestatistics.org/blog/index.php?pk=310678&T=0

As an alternative you can also use a QR Code:  

The GUIDs for individual cells are displayed in the table below:

Summary of computational transaction
Raw Input view raw input (R code)
Raw Outputview raw output of R engine
Computing time2 seconds
R ServerBig Analytics Cloud Computing Center


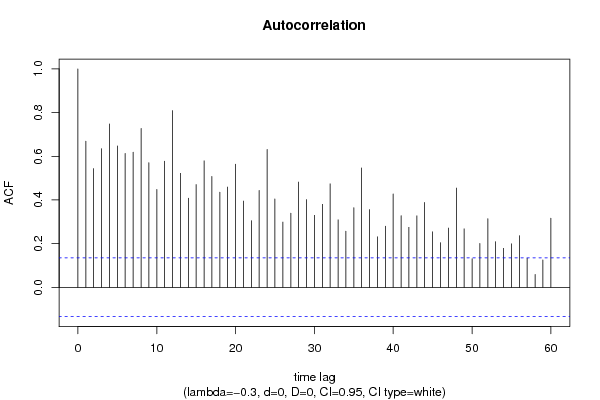
Autocorrelation Function
Time lag kACF(k)T-STATP-value
10.66929.74370
20.5435187.91370
30.6341269.2330
40.74761110.88540
50.6473199.42510
60.6127528.92180
70.6187279.00880
80.72717210.58780
90.5706848.30930
100.448046.52360
110.5773378.40620
120.80898111.77890
130.5216697.59560
140.4078965.93910
150.4701256.84510
160.579128.43210
170.5073227.38670
180.4353066.33810
190.4588356.68070
200.5637418.20820
210.3947755.7480
220.3046024.43517e-06
230.4436436.45950
240.6313589.19270
250.4046435.89170
260.2985894.34751.1e-05
270.3387454.93221e-06
280.481777.01470
290.4013895.84430
300.3294924.79752e-06
310.3797715.52960
320.4736156.89590
330.3086874.49466e-06
340.256653.73690.00012
350.3639395.2990
360.5463687.95520
370.3557785.18020
380.2308343.3610.000461
390.2798154.07423.3e-05
400.4268696.21530
410.3276864.77122e-06
420.2745513.99754.4e-05
430.3269774.76092e-06
440.3886855.65930
450.2539053.69690.000139
460.2037952.96730.001675
470.2709163.94465.4e-05
480.4543216.6150
490.2675913.89626.6e-05
500.1308211.90480.029081
510.200522.91960.001942
520.314034.57234e-06
530.2085063.03590.001349
540.1780792.59290.00509
550.19872.89310.002106
560.2359953.43610.000355
570.1323091.92650.027693
580.0583990.85030.198058
590.1249891.81990.035095
600.3163494.60614e-06

\begin{tabular}{lllllllll}
\hline
Autocorrelation Function \tabularnewline
Time lag k & ACF(k) & T-STAT & P-value \tabularnewline
1 & 0.6692 & 9.7437 & 0 \tabularnewline
2 & 0.543518 & 7.9137 & 0 \tabularnewline
3 & 0.634126 & 9.233 & 0 \tabularnewline
4 & 0.747611 & 10.8854 & 0 \tabularnewline
5 & 0.647319 & 9.4251 & 0 \tabularnewline
6 & 0.612752 & 8.9218 & 0 \tabularnewline
7 & 0.618727 & 9.0088 & 0 \tabularnewline
8 & 0.727172 & 10.5878 & 0 \tabularnewline
9 & 0.570684 & 8.3093 & 0 \tabularnewline
10 & 0.44804 & 6.5236 & 0 \tabularnewline
11 & 0.577337 & 8.4062 & 0 \tabularnewline
12 & 0.808981 & 11.7789 & 0 \tabularnewline
13 & 0.521669 & 7.5956 & 0 \tabularnewline
14 & 0.407896 & 5.9391 & 0 \tabularnewline
15 & 0.470125 & 6.8451 & 0 \tabularnewline
16 & 0.57912 & 8.4321 & 0 \tabularnewline
17 & 0.507322 & 7.3867 & 0 \tabularnewline
18 & 0.435306 & 6.3381 & 0 \tabularnewline
19 & 0.458835 & 6.6807 & 0 \tabularnewline
20 & 0.563741 & 8.2082 & 0 \tabularnewline
21 & 0.394775 & 5.748 & 0 \tabularnewline
22 & 0.304602 & 4.4351 & 7e-06 \tabularnewline
23 & 0.443643 & 6.4595 & 0 \tabularnewline
24 & 0.631358 & 9.1927 & 0 \tabularnewline
25 & 0.404643 & 5.8917 & 0 \tabularnewline
26 & 0.298589 & 4.3475 & 1.1e-05 \tabularnewline
27 & 0.338745 & 4.9322 & 1e-06 \tabularnewline
28 & 0.48177 & 7.0147 & 0 \tabularnewline
29 & 0.401389 & 5.8443 & 0 \tabularnewline
30 & 0.329492 & 4.7975 & 2e-06 \tabularnewline
31 & 0.379771 & 5.5296 & 0 \tabularnewline
32 & 0.473615 & 6.8959 & 0 \tabularnewline
33 & 0.308687 & 4.4946 & 6e-06 \tabularnewline
34 & 0.25665 & 3.7369 & 0.00012 \tabularnewline
35 & 0.363939 & 5.299 & 0 \tabularnewline
36 & 0.546368 & 7.9552 & 0 \tabularnewline
37 & 0.355778 & 5.1802 & 0 \tabularnewline
38 & 0.230834 & 3.361 & 0.000461 \tabularnewline
39 & 0.279815 & 4.0742 & 3.3e-05 \tabularnewline
40 & 0.426869 & 6.2153 & 0 \tabularnewline
41 & 0.327686 & 4.7712 & 2e-06 \tabularnewline
42 & 0.274551 & 3.9975 & 4.4e-05 \tabularnewline
43 & 0.326977 & 4.7609 & 2e-06 \tabularnewline
44 & 0.388685 & 5.6593 & 0 \tabularnewline
45 & 0.253905 & 3.6969 & 0.000139 \tabularnewline
46 & 0.203795 & 2.9673 & 0.001675 \tabularnewline
47 & 0.270916 & 3.9446 & 5.4e-05 \tabularnewline
48 & 0.454321 & 6.615 & 0 \tabularnewline
49 & 0.267591 & 3.8962 & 6.6e-05 \tabularnewline
50 & 0.130821 & 1.9048 & 0.029081 \tabularnewline
51 & 0.20052 & 2.9196 & 0.001942 \tabularnewline
52 & 0.31403 & 4.5723 & 4e-06 \tabularnewline
53 & 0.208506 & 3.0359 & 0.001349 \tabularnewline
54 & 0.178079 & 2.5929 & 0.00509 \tabularnewline
55 & 0.1987 & 2.8931 & 0.002106 \tabularnewline
56 & 0.235995 & 3.4361 & 0.000355 \tabularnewline
57 & 0.132309 & 1.9265 & 0.027693 \tabularnewline
58 & 0.058399 & 0.8503 & 0.198058 \tabularnewline
59 & 0.124989 & 1.8199 & 0.035095 \tabularnewline
60 & 0.316349 & 4.6061 & 4e-06 \tabularnewline
\hline
\end{tabular}
%Source: https://freestatistics.org/blog/index.php?pk=310678&T=1

[TABLE]
[ROW][C]Autocorrelation Function[/C][/ROW]
[ROW][C]Time lag k[/C][C]ACF(k)[/C][C]T-STAT[/C][C]P-value[/C][/ROW]
[ROW][C]1[/C][C]0.6692[/C][C]9.7437[/C][C]0[/C][/ROW]
[ROW][C]2[/C][C]0.543518[/C][C]7.9137[/C][C]0[/C][/ROW]
[ROW][C]3[/C][C]0.634126[/C][C]9.233[/C][C]0[/C][/ROW]
[ROW][C]4[/C][C]0.747611[/C][C]10.8854[/C][C]0[/C][/ROW]
[ROW][C]5[/C][C]0.647319[/C][C]9.4251[/C][C]0[/C][/ROW]
[ROW][C]6[/C][C]0.612752[/C][C]8.9218[/C][C]0[/C][/ROW]
[ROW][C]7[/C][C]0.618727[/C][C]9.0088[/C][C]0[/C][/ROW]
[ROW][C]8[/C][C]0.727172[/C][C]10.5878[/C][C]0[/C][/ROW]
[ROW][C]9[/C][C]0.570684[/C][C]8.3093[/C][C]0[/C][/ROW]
[ROW][C]10[/C][C]0.44804[/C][C]6.5236[/C][C]0[/C][/ROW]
[ROW][C]11[/C][C]0.577337[/C][C]8.4062[/C][C]0[/C][/ROW]
[ROW][C]12[/C][C]0.808981[/C][C]11.7789[/C][C]0[/C][/ROW]
[ROW][C]13[/C][C]0.521669[/C][C]7.5956[/C][C]0[/C][/ROW]
[ROW][C]14[/C][C]0.407896[/C][C]5.9391[/C][C]0[/C][/ROW]
[ROW][C]15[/C][C]0.470125[/C][C]6.8451[/C][C]0[/C][/ROW]
[ROW][C]16[/C][C]0.57912[/C][C]8.4321[/C][C]0[/C][/ROW]
[ROW][C]17[/C][C]0.507322[/C][C]7.3867[/C][C]0[/C][/ROW]
[ROW][C]18[/C][C]0.435306[/C][C]6.3381[/C][C]0[/C][/ROW]
[ROW][C]19[/C][C]0.458835[/C][C]6.6807[/C][C]0[/C][/ROW]
[ROW][C]20[/C][C]0.563741[/C][C]8.2082[/C][C]0[/C][/ROW]
[ROW][C]21[/C][C]0.394775[/C][C]5.748[/C][C]0[/C][/ROW]
[ROW][C]22[/C][C]0.304602[/C][C]4.4351[/C][C]7e-06[/C][/ROW]
[ROW][C]23[/C][C]0.443643[/C][C]6.4595[/C][C]0[/C][/ROW]
[ROW][C]24[/C][C]0.631358[/C][C]9.1927[/C][C]0[/C][/ROW]
[ROW][C]25[/C][C]0.404643[/C][C]5.8917[/C][C]0[/C][/ROW]
[ROW][C]26[/C][C]0.298589[/C][C]4.3475[/C][C]1.1e-05[/C][/ROW]
[ROW][C]27[/C][C]0.338745[/C][C]4.9322[/C][C]1e-06[/C][/ROW]
[ROW][C]28[/C][C]0.48177[/C][C]7.0147[/C][C]0[/C][/ROW]
[ROW][C]29[/C][C]0.401389[/C][C]5.8443[/C][C]0[/C][/ROW]
[ROW][C]30[/C][C]0.329492[/C][C]4.7975[/C][C]2e-06[/C][/ROW]
[ROW][C]31[/C][C]0.379771[/C][C]5.5296[/C][C]0[/C][/ROW]
[ROW][C]32[/C][C]0.473615[/C][C]6.8959[/C][C]0[/C][/ROW]
[ROW][C]33[/C][C]0.308687[/C][C]4.4946[/C][C]6e-06[/C][/ROW]
[ROW][C]34[/C][C]0.25665[/C][C]3.7369[/C][C]0.00012[/C][/ROW]
[ROW][C]35[/C][C]0.363939[/C][C]5.299[/C][C]0[/C][/ROW]
[ROW][C]36[/C][C]0.546368[/C][C]7.9552[/C][C]0[/C][/ROW]
[ROW][C]37[/C][C]0.355778[/C][C]5.1802[/C][C]0[/C][/ROW]
[ROW][C]38[/C][C]0.230834[/C][C]3.361[/C][C]0.000461[/C][/ROW]
[ROW][C]39[/C][C]0.279815[/C][C]4.0742[/C][C]3.3e-05[/C][/ROW]
[ROW][C]40[/C][C]0.426869[/C][C]6.2153[/C][C]0[/C][/ROW]
[ROW][C]41[/C][C]0.327686[/C][C]4.7712[/C][C]2e-06[/C][/ROW]
[ROW][C]42[/C][C]0.274551[/C][C]3.9975[/C][C]4.4e-05[/C][/ROW]
[ROW][C]43[/C][C]0.326977[/C][C]4.7609[/C][C]2e-06[/C][/ROW]
[ROW][C]44[/C][C]0.388685[/C][C]5.6593[/C][C]0[/C][/ROW]
[ROW][C]45[/C][C]0.253905[/C][C]3.6969[/C][C]0.000139[/C][/ROW]
[ROW][C]46[/C][C]0.203795[/C][C]2.9673[/C][C]0.001675[/C][/ROW]
[ROW][C]47[/C][C]0.270916[/C][C]3.9446[/C][C]5.4e-05[/C][/ROW]
[ROW][C]48[/C][C]0.454321[/C][C]6.615[/C][C]0[/C][/ROW]
[ROW][C]49[/C][C]0.267591[/C][C]3.8962[/C][C]6.6e-05[/C][/ROW]
[ROW][C]50[/C][C]0.130821[/C][C]1.9048[/C][C]0.029081[/C][/ROW]
[ROW][C]51[/C][C]0.20052[/C][C]2.9196[/C][C]0.001942[/C][/ROW]
[ROW][C]52[/C][C]0.31403[/C][C]4.5723[/C][C]4e-06[/C][/ROW]
[ROW][C]53[/C][C]0.208506[/C][C]3.0359[/C][C]0.001349[/C][/ROW]
[ROW][C]54[/C][C]0.178079[/C][C]2.5929[/C][C]0.00509[/C][/ROW]
[ROW][C]55[/C][C]0.1987[/C][C]2.8931[/C][C]0.002106[/C][/ROW]
[ROW][C]56[/C][C]0.235995[/C][C]3.4361[/C][C]0.000355[/C][/ROW]
[ROW][C]57[/C][C]0.132309[/C][C]1.9265[/C][C]0.027693[/C][/ROW]
[ROW][C]58[/C][C]0.058399[/C][C]0.8503[/C][C]0.198058[/C][/ROW]
[ROW][C]59[/C][C]0.124989[/C][C]1.8199[/C][C]0.035095[/C][/ROW]
[ROW][C]60[/C][C]0.316349[/C][C]4.6061[/C][C]4e-06[/C][/ROW]
[/TABLE]
Source: https://freestatistics.org/blog/index.php?pk=310678&T=1

Globally Unique Identifier (entire table): ba.freestatistics.org/blog/index.php?pk=310678&T=1

As an alternative you can also use a QR Code:  

The GUIDs for individual cells are displayed in the table below:

Autocorrelation Function
Time lag kACF(k)T-STATP-value
10.66929.74370
20.5435187.91370
30.6341269.2330
40.74761110.88540
50.6473199.42510
60.6127528.92180
70.6187279.00880
80.72717210.58780
90.5706848.30930
100.448046.52360
110.5773378.40620
120.80898111.77890
130.5216697.59560
140.4078965.93910
150.4701256.84510
160.579128.43210
170.5073227.38670
180.4353066.33810
190.4588356.68070
200.5637418.20820
210.3947755.7480
220.3046024.43517e-06
230.4436436.45950
240.6313589.19270
250.4046435.89170
260.2985894.34751.1e-05
270.3387454.93221e-06
280.481777.01470
290.4013895.84430
300.3294924.79752e-06
310.3797715.52960
320.4736156.89590
330.3086874.49466e-06
340.256653.73690.00012
350.3639395.2990
360.5463687.95520
370.3557785.18020
380.2308343.3610.000461
390.2798154.07423.3e-05
400.4268696.21530
410.3276864.77122e-06
420.2745513.99754.4e-05
430.3269774.76092e-06
440.3886855.65930
450.2539053.69690.000139
460.2037952.96730.001675
470.2709163.94465.4e-05
480.4543216.6150
490.2675913.89626.6e-05
500.1308211.90480.029081
510.200522.91960.001942
520.314034.57234e-06
530.2085063.03590.001349
540.1780792.59290.00509
550.19872.89310.002106
560.2359953.43610.000355
570.1323091.92650.027693
580.0583990.85030.198058
590.1249891.81990.035095
600.3163494.60614e-06


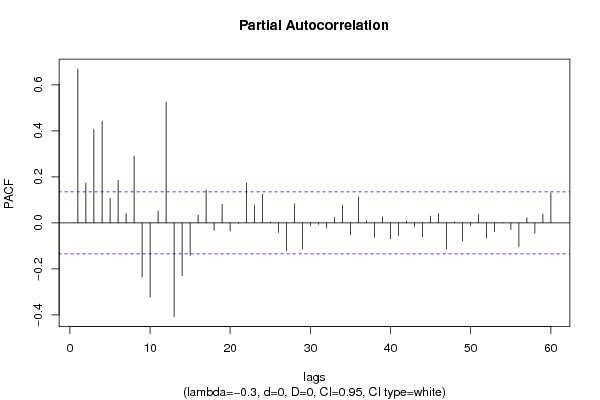
Partial Autocorrelation Function
Time lag kPACF(k)T-STATP-value
10.66929.74370
20.1732962.52320.006181
30.4060315.91190
40.4417636.43220
50.1061621.54570.06183
60.1842872.68330.003933
70.040670.59220.277186
80.2908234.23441.7e-05
9-0.236212-3.43930.000351
10-0.322693-4.69852e-06
110.0515860.75110.226713
120.5252517.64780
13-0.407911-5.93930
14-0.229503-3.34160.000492
15-0.140594-2.04710.020942
160.032820.47790.316618
170.1428182.07950.019389
18-0.031701-0.46160.322433
190.0795081.15770.124153
20-0.034916-0.50840.305858
21-0.002341-0.03410.48642
220.1731752.52150.006211
230.0774111.12710.130481
240.1246221.81450.035505
250.0040130.05840.476732
26-0.041354-0.60210.273867
27-0.121792-1.77330.038806
280.0823821.19950.115838
29-0.112887-1.64370.050865
30-0.012057-0.17560.430404
31-0.005827-0.08480.466235
32-0.022626-0.32940.371073
330.0236850.34490.36527
340.0763021.1110.133919
35-0.051179-0.74520.228497
360.1127481.64160.051075
370.0085870.1250.450311
38-0.062482-0.90970.181994
390.0268280.39060.348234
40-0.069187-1.00740.157453
41-0.054726-0.79680.213222
420.0083380.12140.451743
43-0.017498-0.25480.399573
44-0.061538-0.8960.185631
450.0299960.43680.331368
460.040670.59220.277183
47-0.113465-1.65210.05
480.0041350.06020.476025
49-0.079071-1.15130.125456
50-0.012847-0.18710.425896
510.0365770.53260.297446
52-0.065566-0.95470.170421
53-0.037936-0.55230.290645
540.0017630.02570.489771
55-0.028862-0.42020.337368
56-0.102469-1.4920.068597
570.0218140.31760.375543
58-0.045161-0.65750.25577
590.0375860.54730.29239
600.1296811.88820.030183

\begin{tabular}{lllllllll}
\hline
Partial Autocorrelation Function \tabularnewline
Time lag k & PACF(k) & T-STAT & P-value \tabularnewline
1 & 0.6692 & 9.7437 & 0 \tabularnewline
2 & 0.173296 & 2.5232 & 0.006181 \tabularnewline
3 & 0.406031 & 5.9119 & 0 \tabularnewline
4 & 0.441763 & 6.4322 & 0 \tabularnewline
5 & 0.106162 & 1.5457 & 0.06183 \tabularnewline
6 & 0.184287 & 2.6833 & 0.003933 \tabularnewline
7 & 0.04067 & 0.5922 & 0.277186 \tabularnewline
8 & 0.290823 & 4.2344 & 1.7e-05 \tabularnewline
9 & -0.236212 & -3.4393 & 0.000351 \tabularnewline
10 & -0.322693 & -4.6985 & 2e-06 \tabularnewline
11 & 0.051586 & 0.7511 & 0.226713 \tabularnewline
12 & 0.525251 & 7.6478 & 0 \tabularnewline
13 & -0.407911 & -5.9393 & 0 \tabularnewline
14 & -0.229503 & -3.3416 & 0.000492 \tabularnewline
15 & -0.140594 & -2.0471 & 0.020942 \tabularnewline
16 & 0.03282 & 0.4779 & 0.316618 \tabularnewline
17 & 0.142818 & 2.0795 & 0.019389 \tabularnewline
18 & -0.031701 & -0.4616 & 0.322433 \tabularnewline
19 & 0.079508 & 1.1577 & 0.124153 \tabularnewline
20 & -0.034916 & -0.5084 & 0.305858 \tabularnewline
21 & -0.002341 & -0.0341 & 0.48642 \tabularnewline
22 & 0.173175 & 2.5215 & 0.006211 \tabularnewline
23 & 0.077411 & 1.1271 & 0.130481 \tabularnewline
24 & 0.124622 & 1.8145 & 0.035505 \tabularnewline
25 & 0.004013 & 0.0584 & 0.476732 \tabularnewline
26 & -0.041354 & -0.6021 & 0.273867 \tabularnewline
27 & -0.121792 & -1.7733 & 0.038806 \tabularnewline
28 & 0.082382 & 1.1995 & 0.115838 \tabularnewline
29 & -0.112887 & -1.6437 & 0.050865 \tabularnewline
30 & -0.012057 & -0.1756 & 0.430404 \tabularnewline
31 & -0.005827 & -0.0848 & 0.466235 \tabularnewline
32 & -0.022626 & -0.3294 & 0.371073 \tabularnewline
33 & 0.023685 & 0.3449 & 0.36527 \tabularnewline
34 & 0.076302 & 1.111 & 0.133919 \tabularnewline
35 & -0.051179 & -0.7452 & 0.228497 \tabularnewline
36 & 0.112748 & 1.6416 & 0.051075 \tabularnewline
37 & 0.008587 & 0.125 & 0.450311 \tabularnewline
38 & -0.062482 & -0.9097 & 0.181994 \tabularnewline
39 & 0.026828 & 0.3906 & 0.348234 \tabularnewline
40 & -0.069187 & -1.0074 & 0.157453 \tabularnewline
41 & -0.054726 & -0.7968 & 0.213222 \tabularnewline
42 & 0.008338 & 0.1214 & 0.451743 \tabularnewline
43 & -0.017498 & -0.2548 & 0.399573 \tabularnewline
44 & -0.061538 & -0.896 & 0.185631 \tabularnewline
45 & 0.029996 & 0.4368 & 0.331368 \tabularnewline
46 & 0.04067 & 0.5922 & 0.277183 \tabularnewline
47 & -0.113465 & -1.6521 & 0.05 \tabularnewline
48 & 0.004135 & 0.0602 & 0.476025 \tabularnewline
49 & -0.079071 & -1.1513 & 0.125456 \tabularnewline
50 & -0.012847 & -0.1871 & 0.425896 \tabularnewline
51 & 0.036577 & 0.5326 & 0.297446 \tabularnewline
52 & -0.065566 & -0.9547 & 0.170421 \tabularnewline
53 & -0.037936 & -0.5523 & 0.290645 \tabularnewline
54 & 0.001763 & 0.0257 & 0.489771 \tabularnewline
55 & -0.028862 & -0.4202 & 0.337368 \tabularnewline
56 & -0.102469 & -1.492 & 0.068597 \tabularnewline
57 & 0.021814 & 0.3176 & 0.375543 \tabularnewline
58 & -0.045161 & -0.6575 & 0.25577 \tabularnewline
59 & 0.037586 & 0.5473 & 0.29239 \tabularnewline
60 & 0.129681 & 1.8882 & 0.030183 \tabularnewline
\hline
\end{tabular}
%Source: https://freestatistics.org/blog/index.php?pk=310678&T=2

[TABLE]
[ROW][C]Partial Autocorrelation Function[/C][/ROW]
[ROW][C]Time lag k[/C][C]PACF(k)[/C][C]T-STAT[/C][C]P-value[/C][/ROW]
[ROW][C]1[/C][C]0.6692[/C][C]9.7437[/C][C]0[/C][/ROW]
[ROW][C]2[/C][C]0.173296[/C][C]2.5232[/C][C]0.006181[/C][/ROW]
[ROW][C]3[/C][C]0.406031[/C][C]5.9119[/C][C]0[/C][/ROW]
[ROW][C]4[/C][C]0.441763[/C][C]6.4322[/C][C]0[/C][/ROW]
[ROW][C]5[/C][C]0.106162[/C][C]1.5457[/C][C]0.06183[/C][/ROW]
[ROW][C]6[/C][C]0.184287[/C][C]2.6833[/C][C]0.003933[/C][/ROW]
[ROW][C]7[/C][C]0.04067[/C][C]0.5922[/C][C]0.277186[/C][/ROW]
[ROW][C]8[/C][C]0.290823[/C][C]4.2344[/C][C]1.7e-05[/C][/ROW]
[ROW][C]9[/C][C]-0.236212[/C][C]-3.4393[/C][C]0.000351[/C][/ROW]
[ROW][C]10[/C][C]-0.322693[/C][C]-4.6985[/C][C]2e-06[/C][/ROW]
[ROW][C]11[/C][C]0.051586[/C][C]0.7511[/C][C]0.226713[/C][/ROW]
[ROW][C]12[/C][C]0.525251[/C][C]7.6478[/C][C]0[/C][/ROW]
[ROW][C]13[/C][C]-0.407911[/C][C]-5.9393[/C][C]0[/C][/ROW]
[ROW][C]14[/C][C]-0.229503[/C][C]-3.3416[/C][C]0.000492[/C][/ROW]
[ROW][C]15[/C][C]-0.140594[/C][C]-2.0471[/C][C]0.020942[/C][/ROW]
[ROW][C]16[/C][C]0.03282[/C][C]0.4779[/C][C]0.316618[/C][/ROW]
[ROW][C]17[/C][C]0.142818[/C][C]2.0795[/C][C]0.019389[/C][/ROW]
[ROW][C]18[/C][C]-0.031701[/C][C]-0.4616[/C][C]0.322433[/C][/ROW]
[ROW][C]19[/C][C]0.079508[/C][C]1.1577[/C][C]0.124153[/C][/ROW]
[ROW][C]20[/C][C]-0.034916[/C][C]-0.5084[/C][C]0.305858[/C][/ROW]
[ROW][C]21[/C][C]-0.002341[/C][C]-0.0341[/C][C]0.48642[/C][/ROW]
[ROW][C]22[/C][C]0.173175[/C][C]2.5215[/C][C]0.006211[/C][/ROW]
[ROW][C]23[/C][C]0.077411[/C][C]1.1271[/C][C]0.130481[/C][/ROW]
[ROW][C]24[/C][C]0.124622[/C][C]1.8145[/C][C]0.035505[/C][/ROW]
[ROW][C]25[/C][C]0.004013[/C][C]0.0584[/C][C]0.476732[/C][/ROW]
[ROW][C]26[/C][C]-0.041354[/C][C]-0.6021[/C][C]0.273867[/C][/ROW]
[ROW][C]27[/C][C]-0.121792[/C][C]-1.7733[/C][C]0.038806[/C][/ROW]
[ROW][C]28[/C][C]0.082382[/C][C]1.1995[/C][C]0.115838[/C][/ROW]
[ROW][C]29[/C][C]-0.112887[/C][C]-1.6437[/C][C]0.050865[/C][/ROW]
[ROW][C]30[/C][C]-0.012057[/C][C]-0.1756[/C][C]0.430404[/C][/ROW]
[ROW][C]31[/C][C]-0.005827[/C][C]-0.0848[/C][C]0.466235[/C][/ROW]
[ROW][C]32[/C][C]-0.022626[/C][C]-0.3294[/C][C]0.371073[/C][/ROW]
[ROW][C]33[/C][C]0.023685[/C][C]0.3449[/C][C]0.36527[/C][/ROW]
[ROW][C]34[/C][C]0.076302[/C][C]1.111[/C][C]0.133919[/C][/ROW]
[ROW][C]35[/C][C]-0.051179[/C][C]-0.7452[/C][C]0.228497[/C][/ROW]
[ROW][C]36[/C][C]0.112748[/C][C]1.6416[/C][C]0.051075[/C][/ROW]
[ROW][C]37[/C][C]0.008587[/C][C]0.125[/C][C]0.450311[/C][/ROW]
[ROW][C]38[/C][C]-0.062482[/C][C]-0.9097[/C][C]0.181994[/C][/ROW]
[ROW][C]39[/C][C]0.026828[/C][C]0.3906[/C][C]0.348234[/C][/ROW]
[ROW][C]40[/C][C]-0.069187[/C][C]-1.0074[/C][C]0.157453[/C][/ROW]
[ROW][C]41[/C][C]-0.054726[/C][C]-0.7968[/C][C]0.213222[/C][/ROW]
[ROW][C]42[/C][C]0.008338[/C][C]0.1214[/C][C]0.451743[/C][/ROW]
[ROW][C]43[/C][C]-0.017498[/C][C]-0.2548[/C][C]0.399573[/C][/ROW]
[ROW][C]44[/C][C]-0.061538[/C][C]-0.896[/C][C]0.185631[/C][/ROW]
[ROW][C]45[/C][C]0.029996[/C][C]0.4368[/C][C]0.331368[/C][/ROW]
[ROW][C]46[/C][C]0.04067[/C][C]0.5922[/C][C]0.277183[/C][/ROW]
[ROW][C]47[/C][C]-0.113465[/C][C]-1.6521[/C][C]0.05[/C][/ROW]
[ROW][C]48[/C][C]0.004135[/C][C]0.0602[/C][C]0.476025[/C][/ROW]
[ROW][C]49[/C][C]-0.079071[/C][C]-1.1513[/C][C]0.125456[/C][/ROW]
[ROW][C]50[/C][C]-0.012847[/C][C]-0.1871[/C][C]0.425896[/C][/ROW]
[ROW][C]51[/C][C]0.036577[/C][C]0.5326[/C][C]0.297446[/C][/ROW]
[ROW][C]52[/C][C]-0.065566[/C][C]-0.9547[/C][C]0.170421[/C][/ROW]
[ROW][C]53[/C][C]-0.037936[/C][C]-0.5523[/C][C]0.290645[/C][/ROW]
[ROW][C]54[/C][C]0.001763[/C][C]0.0257[/C][C]0.489771[/C][/ROW]
[ROW][C]55[/C][C]-0.028862[/C][C]-0.4202[/C][C]0.337368[/C][/ROW]
[ROW][C]56[/C][C]-0.102469[/C][C]-1.492[/C][C]0.068597[/C][/ROW]
[ROW][C]57[/C][C]0.021814[/C][C]0.3176[/C][C]0.375543[/C][/ROW]
[ROW][C]58[/C][C]-0.045161[/C][C]-0.6575[/C][C]0.25577[/C][/ROW]
[ROW][C]59[/C][C]0.037586[/C][C]0.5473[/C][C]0.29239[/C][/ROW]
[ROW][C]60[/C][C]0.129681[/C][C]1.8882[/C][C]0.030183[/C][/ROW]
[/TABLE]
Source: https://freestatistics.org/blog/index.php?pk=310678&T=2

Globally Unique Identifier (entire table): ba.freestatistics.org/blog/index.php?pk=310678&T=2

As an alternative you can also use a QR Code:  

The GUIDs for individual cells are displayed in the table below:

Partial Autocorrelation Function
Time lag kPACF(k)T-STATP-value
10.66929.74370
20.1732962.52320.006181
30.4060315.91190
40.4417636.43220
50.1061621.54570.06183
60.1842872.68330.003933
70.040670.59220.277186
80.2908234.23441.7e-05
9-0.236212-3.43930.000351
10-0.322693-4.69852e-06
110.0515860.75110.226713
120.5252517.64780
13-0.407911-5.93930
14-0.229503-3.34160.000492
15-0.140594-2.04710.020942
160.032820.47790.316618
170.1428182.07950.019389
18-0.031701-0.46160.322433
190.0795081.15770.124153
20-0.034916-0.50840.305858
21-0.002341-0.03410.48642
220.1731752.52150.006211
230.0774111.12710.130481
240.1246221.81450.035505
250.0040130.05840.476732
26-0.041354-0.60210.273867
27-0.121792-1.77330.038806
280.0823821.19950.115838
29-0.112887-1.64370.050865
30-0.012057-0.17560.430404
31-0.005827-0.08480.466235
32-0.022626-0.32940.371073
330.0236850.34490.36527
340.0763021.1110.133919
35-0.051179-0.74520.228497
360.1127481.64160.051075
370.0085870.1250.450311
38-0.062482-0.90970.181994
390.0268280.39060.348234
40-0.069187-1.00740.157453
41-0.054726-0.79680.213222
420.0083380.12140.451743
43-0.017498-0.25480.399573
44-0.061538-0.8960.185631
450.0299960.43680.331368
460.040670.59220.277183
47-0.113465-1.65210.05
480.0041350.06020.476025
49-0.079071-1.15130.125456
50-0.012847-0.18710.425896
510.0365770.53260.297446
52-0.065566-0.95470.170421
53-0.037936-0.55230.290645
540.0017630.02570.489771
55-0.028862-0.42020.337368
56-0.102469-1.4920.068597
570.0218140.31760.375543
58-0.045161-0.65750.25577
590.0375860.54730.29239
600.1296811.88820.030183


Parameters (Session):
par1 = 60 ; par2 = -0.3 ; par3 = 0 ; par4 = 0 ; par5 = 12 ; par6 = White Noise ; par7 = 0.95 ;
Parameters (R input):
par1 = 60 ; par2 = -0.3 ; par3 = 0 ; par4 = 0 ; par5 = 12 ; par6 = White Noise ; par7 = 0.95 ; par8 = ;
R code (references can be found in the software module):
if (par1 == 'Default') {
par1 = 10*log10(length(x))
} else {
par1 <- as.numeric(par1)
}
par2 <- as.numeric(par2)
par3 <- as.numeric(par3)
par4 <- as.numeric(par4)
par5 <- as.numeric(par5)
if (par6 == 'White Noise') par6 <- 'white' else par6 <- 'ma'
par7 <- as.numeric(par7)
if (par8 != '') par8 <- as.numeric(par8)
x <- na.omit(x)
ox <- x
if (par8 == '') {
if (par2 == 0) {
x <- log(x)
} else {
x <- (x ^ par2 - 1) / par2
}
} else {
x <- log(x,base=par8)
}
if (par3 > 0) x <- diff(x,lag=1,difference=par3)
if (par4 > 0) x <- diff(x,lag=par5,difference=par4)
bitmap(file='picts.png')
op <- par(mfrow=c(2,1))
plot(ox,type='l',main='Original Time Series',xlab='time',ylab='value')
if (par8=='') {
mytitle <- paste('Working Time Series (lambda=',par2,', d=',par3,', D=',par4,')',sep='')
mysub <- paste('(lambda=',par2,', d=',par3,', D=',par4,', CI=', par7, ', CI type=',par6,')',sep='')
} else {
mytitle <- paste('Working Time Series (base=',par8,', d=',par3,', D=',par4,')',sep='')
mysub <- paste('(base=',par8,', d=',par3,', D=',par4,', CI=', par7, ', CI type=',par6,')',sep='')
}
plot(x,type='l', main=mytitle,xlab='time',ylab='value')
par(op)
dev.off()
bitmap(file='pic1.png')
racf <- acf(x, par1, main='Autocorrelation', xlab='time lag', ylab='ACF', ci.type=par6, ci=par7, sub=mysub)
dev.off()
bitmap(file='pic2.png')
rpacf <- pacf(x,par1,main='Partial Autocorrelation',xlab='lags',ylab='PACF',sub=mysub)
dev.off()
(myacf <- c(racf$acf))
(mypacf <- c(rpacf$acf))
lengthx <- length(x)
sqrtn <- sqrt(lengthx)
load(file='createtable')
a<-table.start()
a<-table.row.start(a)
a<-table.element(a,'Autocorrelation Function',4,TRUE)
a<-table.row.end(a)
a<-table.row.start(a)
a<-table.element(a,'Time lag k',header=TRUE)
a<-table.element(a,'ACF(k)',header=TRUE)
a<-table.element(a,'T-STAT',header=TRUE)
a<-table.element(a,'P-value',header=TRUE)
a<-table.row.end(a)
for (i in 2:(par1+1)) {
a<-table.row.start(a)
a<-table.element(a,i-1,header=TRUE)
a<-table.element(a,round(myacf[i],6))
mytstat <- myacf[i]*sqrtn
a<-table.element(a,round(mytstat,4))
a<-table.element(a,round(1-pt(abs(mytstat),lengthx),6))
a<-table.row.end(a)
}
a<-table.end(a)
table.save(a,file='mytable.tab')
a<-table.start()
a<-table.row.start(a)
a<-table.element(a,'Partial Autocorrelation Function',4,TRUE)
a<-table.row.end(a)
a<-table.row.start(a)
a<-table.element(a,'Time lag k',header=TRUE)
a<-table.element(a,'PACF(k)',header=TRUE)
a<-table.element(a,'T-STAT',header=TRUE)
a<-table.element(a,'P-value',header=TRUE)
a<-table.row.end(a)
for (i in 1:par1) {
a<-table.row.start(a)
a<-table.element(a,i,header=TRUE)
a<-table.element(a,round(mypacf[i],6))
mytstat <- mypacf[i]*sqrtn
a<-table.element(a,round(mytstat,4))
a<-table.element(a,round(1-pt(abs(mytstat),lengthx),6))
a<-table.row.end(a)
}
a<-table.end(a)
table.save(a,file='mytable1.tab')