Free Statistics

of Irreproducible Research!

Author's title

Author*The author of this computation has been verified*
R Software Modulerwasp_autocorrelation.wasp
Title produced by software(Partial) Autocorrelation Function
Date of computationWed, 20 Dec 2017 22:43:41 +0100
Cite this page as followsStatistical Computations at FreeStatistics.org, Office for Research Development and Education, URL https://freestatistics.org/blog/index.php?v=date/2017/Dec/20/t1513806307bq8wmbn3km5azrs.htm/, Retrieved Tue, 14 May 2024 04:05:42 +0000
Statistical Computations at FreeStatistics.org, Office for Research Development and Education, URL https://freestatistics.org/blog/index.php?pk=310584, Retrieved Tue, 14 May 2024 04:05:42 +0000
QR Codes:

Original text written by user:
IsPrivate?No (this computation is public)
User-defined keywords
Estimated Impact105
Family? (F = Feedback message, R = changed R code, M = changed R Module, P = changed Parameters, D = changed Data)
-       [(Partial) Autocorrelation Function] [] [2017-12-20 21:43:41] [6a14c6712734b6e9645e9b92d85f99d9] [Current]
Feedback Forum

Post a new message
Dataseries X:
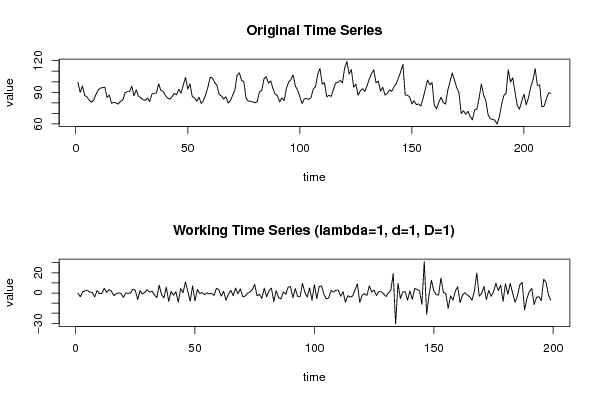
99.5
89.9
96
86.9
85.6
82.5
80.5
82.7
87.7
92.2
93.9
94.5
94.8
85
87.4
79.5
80.5
79.8
78.8
81.5
82.6
89.5
90.7
90.7
95.7
86.6
92.4
86.3
84.7
83.1
82.2
84.5
81.2
88.2
89.1
89.1
98
91.7
90.9
87.1
84.5
83.5
85.9
89
87.6
92.9
89.1
96.9
104.1
93
98
85.9
84.8
81.5
85.3
79.3
82.3
87.8
95
104.4
103.5
99.5
96.6
88.1
86.4
83.6
85.7
79.8
81.9
87.1
92
106.1
108.5
101.4
100.1
84.4
81.6
81.5
80.9
79.9
81.2
90.5
91.7
102.7
104.8
98.7
100.8
93.6
88.1
86.8
80.8
84.6
82
93.6
99.7
102.1
106.6
95.9
92.1
85.9
79.3
83.7
84.1
83.2
85
93.1
95.4
107.3
112.5
97.8
99.1
85.6
87.2
86
92.7
98.8
99.2
101.4
98.8
113.2
119.2
107.4
111.6
94.8
97.7
87.3
91.4
93.4
90.8
96.1
102.6
107.7
111.4
98.9
100.7
91
94.8
87.3
88.8
92.3
90.9
95.2
98.2
103.5
109.7
116.4
87.5
87.2
85.5
79
81.8
78.2
78.9
76.9
84.4
93.1
101.6
97.1
99.3
77.8
74.3
80.4
85.3
80.1
78.8
91.8
100
108.4
101.7
94.4
89.5
69.8
72.5
69.1
71.9
67
63.8
73.2
74.2
84.7
97.8
87.4
81.8
68.6
64.9
64.1
63.6
59.8
66.3
78.1
86.8
89
111.3
99.7
103.7
90.4
77.6
73.9
81.5
88.2
78
84.7
94.8
101.5
112.4
96.6
96.9
76.1
76.9
83.8
89.4
89.1


Summary of computational transaction
Raw Input view raw input (R code)
Raw Outputview raw output of R engine
Computing time1 seconds
R ServerBig Analytics Cloud Computing Center

\begin{tabular}{lllllllll}
\hline
Summary of computational transaction \tabularnewline
Raw Input view raw input (R code)  \tabularnewline
Raw Outputview raw output of R engine  \tabularnewline
Computing time1 seconds \tabularnewline
R ServerBig Analytics Cloud Computing Center \tabularnewline
\hline
\end{tabular}
%Source: https://freestatistics.org/blog/index.php?pk=310584&T=0

[TABLE]
[ROW]
Summary of computational transaction[/C][/ROW] [ROW]Raw Input[/C] view raw input (R code) [/C][/ROW] [ROW]Raw Output[/C]view raw output of R engine [/C][/ROW] [ROW]Computing time[/C]1 seconds[/C][/ROW] [ROW]R Server[/C]Big Analytics Cloud Computing Center[/C][/ROW] [/TABLE] Source: https://freestatistics.org/blog/index.php?pk=310584&T=0

Globally Unique Identifier (entire table): ba.freestatistics.org/blog/index.php?pk=310584&T=0

As an alternative you can also use a QR Code:  

The GUIDs for individual cells are displayed in the table below:

Summary of computational transaction
Raw Input view raw input (R code)
Raw Outputview raw output of R engine
Computing time1 seconds
R ServerBig Analytics Cloud Computing Center


Autocorrelation Function
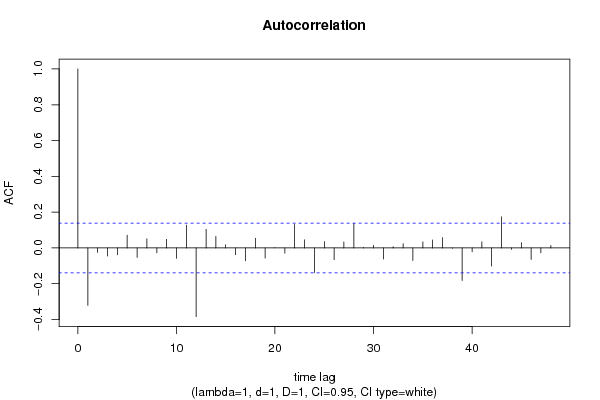
Time lag kACF(k)T-STATP-value
1-0.320835-4.52595e-06
2-0.024647-0.34770.364221
3-0.044714-0.63080.26446
4-0.037894-0.53460.296773
50.070710.99750.159868
6-0.052707-0.74350.229019
70.0505870.71360.238151
8-0.026948-0.38010.35212
90.0480520.67790.249323
10-0.058314-0.82260.205854
110.1277351.80190.036536
12-0.383846-5.41480
130.1037091.4630.072523
140.0636660.89810.185103
150.018350.25890.398008
16-0.037267-0.52570.299835
17-0.071607-1.01010.156829
180.0544240.76770.221776
19-0.056744-0.80050.212195
204.5e-056e-040.499745
21-0.028959-0.40850.341668
220.1314961.8550.03254
230.0449960.63470.263161
24-0.137559-1.94050.026866
250.0360130.5080.306
26-0.065162-0.91920.179547
270.0335130.47280.318449
280.1364341.92460.02785
290.0029750.0420.483286
300.0145660.20550.418703
31-0.062187-0.87730.190701
320.0063840.09010.464166
330.0234920.33140.370346
34-0.070011-0.98760.162268
350.0338460.47750.31678
360.0444650.62730.265606
370.0576150.81280.208662
38-0.001265-0.01780.492889
39-0.18162-2.56210.005572
40-0.021421-0.30220.381413
410.0341320.48150.315349
42-0.10098-1.42450.077935
430.1735612.44840.007608
44-0.007861-0.11090.455905
450.0293320.41380.339739
46-0.06399-0.90270.18389
47-0.026779-0.37780.353004
480.0134610.18990.424797

\begin{tabular}{lllllllll}
\hline
Autocorrelation Function \tabularnewline
Time lag k & ACF(k) & T-STAT & P-value \tabularnewline
1 & -0.320835 & -4.5259 & 5e-06 \tabularnewline
2 & -0.024647 & -0.3477 & 0.364221 \tabularnewline
3 & -0.044714 & -0.6308 & 0.26446 \tabularnewline
4 & -0.037894 & -0.5346 & 0.296773 \tabularnewline
5 & 0.07071 & 0.9975 & 0.159868 \tabularnewline
6 & -0.052707 & -0.7435 & 0.229019 \tabularnewline
7 & 0.050587 & 0.7136 & 0.238151 \tabularnewline
8 & -0.026948 & -0.3801 & 0.35212 \tabularnewline
9 & 0.048052 & 0.6779 & 0.249323 \tabularnewline
10 & -0.058314 & -0.8226 & 0.205854 \tabularnewline
11 & 0.127735 & 1.8019 & 0.036536 \tabularnewline
12 & -0.383846 & -5.4148 & 0 \tabularnewline
13 & 0.103709 & 1.463 & 0.072523 \tabularnewline
14 & 0.063666 & 0.8981 & 0.185103 \tabularnewline
15 & 0.01835 & 0.2589 & 0.398008 \tabularnewline
16 & -0.037267 & -0.5257 & 0.299835 \tabularnewline
17 & -0.071607 & -1.0101 & 0.156829 \tabularnewline
18 & 0.054424 & 0.7677 & 0.221776 \tabularnewline
19 & -0.056744 & -0.8005 & 0.212195 \tabularnewline
20 & 4.5e-05 & 6e-04 & 0.499745 \tabularnewline
21 & -0.028959 & -0.4085 & 0.341668 \tabularnewline
22 & 0.131496 & 1.855 & 0.03254 \tabularnewline
23 & 0.044996 & 0.6347 & 0.263161 \tabularnewline
24 & -0.137559 & -1.9405 & 0.026866 \tabularnewline
25 & 0.036013 & 0.508 & 0.306 \tabularnewline
26 & -0.065162 & -0.9192 & 0.179547 \tabularnewline
27 & 0.033513 & 0.4728 & 0.318449 \tabularnewline
28 & 0.136434 & 1.9246 & 0.02785 \tabularnewline
29 & 0.002975 & 0.042 & 0.483286 \tabularnewline
30 & 0.014566 & 0.2055 & 0.418703 \tabularnewline
31 & -0.062187 & -0.8773 & 0.190701 \tabularnewline
32 & 0.006384 & 0.0901 & 0.464166 \tabularnewline
33 & 0.023492 & 0.3314 & 0.370346 \tabularnewline
34 & -0.070011 & -0.9876 & 0.162268 \tabularnewline
35 & 0.033846 & 0.4775 & 0.31678 \tabularnewline
36 & 0.044465 & 0.6273 & 0.265606 \tabularnewline
37 & 0.057615 & 0.8128 & 0.208662 \tabularnewline
38 & -0.001265 & -0.0178 & 0.492889 \tabularnewline
39 & -0.18162 & -2.5621 & 0.005572 \tabularnewline
40 & -0.021421 & -0.3022 & 0.381413 \tabularnewline
41 & 0.034132 & 0.4815 & 0.315349 \tabularnewline
42 & -0.10098 & -1.4245 & 0.077935 \tabularnewline
43 & 0.173561 & 2.4484 & 0.007608 \tabularnewline
44 & -0.007861 & -0.1109 & 0.455905 \tabularnewline
45 & 0.029332 & 0.4138 & 0.339739 \tabularnewline
46 & -0.06399 & -0.9027 & 0.18389 \tabularnewline
47 & -0.026779 & -0.3778 & 0.353004 \tabularnewline
48 & 0.013461 & 0.1899 & 0.424797 \tabularnewline
\hline
\end{tabular}
%Source: https://freestatistics.org/blog/index.php?pk=310584&T=1

[TABLE]
[ROW][C]Autocorrelation Function[/C][/ROW]
[ROW][C]Time lag k[/C][C]ACF(k)[/C][C]T-STAT[/C][C]P-value[/C][/ROW]
[ROW][C]1[/C][C]-0.320835[/C][C]-4.5259[/C][C]5e-06[/C][/ROW]
[ROW][C]2[/C][C]-0.024647[/C][C]-0.3477[/C][C]0.364221[/C][/ROW]
[ROW][C]3[/C][C]-0.044714[/C][C]-0.6308[/C][C]0.26446[/C][/ROW]
[ROW][C]4[/C][C]-0.037894[/C][C]-0.5346[/C][C]0.296773[/C][/ROW]
[ROW][C]5[/C][C]0.07071[/C][C]0.9975[/C][C]0.159868[/C][/ROW]
[ROW][C]6[/C][C]-0.052707[/C][C]-0.7435[/C][C]0.229019[/C][/ROW]
[ROW][C]7[/C][C]0.050587[/C][C]0.7136[/C][C]0.238151[/C][/ROW]
[ROW][C]8[/C][C]-0.026948[/C][C]-0.3801[/C][C]0.35212[/C][/ROW]
[ROW][C]9[/C][C]0.048052[/C][C]0.6779[/C][C]0.249323[/C][/ROW]
[ROW][C]10[/C][C]-0.058314[/C][C]-0.8226[/C][C]0.205854[/C][/ROW]
[ROW][C]11[/C][C]0.127735[/C][C]1.8019[/C][C]0.036536[/C][/ROW]
[ROW][C]12[/C][C]-0.383846[/C][C]-5.4148[/C][C]0[/C][/ROW]
[ROW][C]13[/C][C]0.103709[/C][C]1.463[/C][C]0.072523[/C][/ROW]
[ROW][C]14[/C][C]0.063666[/C][C]0.8981[/C][C]0.185103[/C][/ROW]
[ROW][C]15[/C][C]0.01835[/C][C]0.2589[/C][C]0.398008[/C][/ROW]
[ROW][C]16[/C][C]-0.037267[/C][C]-0.5257[/C][C]0.299835[/C][/ROW]
[ROW][C]17[/C][C]-0.071607[/C][C]-1.0101[/C][C]0.156829[/C][/ROW]
[ROW][C]18[/C][C]0.054424[/C][C]0.7677[/C][C]0.221776[/C][/ROW]
[ROW][C]19[/C][C]-0.056744[/C][C]-0.8005[/C][C]0.212195[/C][/ROW]
[ROW][C]20[/C][C]4.5e-05[/C][C]6e-04[/C][C]0.499745[/C][/ROW]
[ROW][C]21[/C][C]-0.028959[/C][C]-0.4085[/C][C]0.341668[/C][/ROW]
[ROW][C]22[/C][C]0.131496[/C][C]1.855[/C][C]0.03254[/C][/ROW]
[ROW][C]23[/C][C]0.044996[/C][C]0.6347[/C][C]0.263161[/C][/ROW]
[ROW][C]24[/C][C]-0.137559[/C][C]-1.9405[/C][C]0.026866[/C][/ROW]
[ROW][C]25[/C][C]0.036013[/C][C]0.508[/C][C]0.306[/C][/ROW]
[ROW][C]26[/C][C]-0.065162[/C][C]-0.9192[/C][C]0.179547[/C][/ROW]
[ROW][C]27[/C][C]0.033513[/C][C]0.4728[/C][C]0.318449[/C][/ROW]
[ROW][C]28[/C][C]0.136434[/C][C]1.9246[/C][C]0.02785[/C][/ROW]
[ROW][C]29[/C][C]0.002975[/C][C]0.042[/C][C]0.483286[/C][/ROW]
[ROW][C]30[/C][C]0.014566[/C][C]0.2055[/C][C]0.418703[/C][/ROW]
[ROW][C]31[/C][C]-0.062187[/C][C]-0.8773[/C][C]0.190701[/C][/ROW]
[ROW][C]32[/C][C]0.006384[/C][C]0.0901[/C][C]0.464166[/C][/ROW]
[ROW][C]33[/C][C]0.023492[/C][C]0.3314[/C][C]0.370346[/C][/ROW]
[ROW][C]34[/C][C]-0.070011[/C][C]-0.9876[/C][C]0.162268[/C][/ROW]
[ROW][C]35[/C][C]0.033846[/C][C]0.4775[/C][C]0.31678[/C][/ROW]
[ROW][C]36[/C][C]0.044465[/C][C]0.6273[/C][C]0.265606[/C][/ROW]
[ROW][C]37[/C][C]0.057615[/C][C]0.8128[/C][C]0.208662[/C][/ROW]
[ROW][C]38[/C][C]-0.001265[/C][C]-0.0178[/C][C]0.492889[/C][/ROW]
[ROW][C]39[/C][C]-0.18162[/C][C]-2.5621[/C][C]0.005572[/C][/ROW]
[ROW][C]40[/C][C]-0.021421[/C][C]-0.3022[/C][C]0.381413[/C][/ROW]
[ROW][C]41[/C][C]0.034132[/C][C]0.4815[/C][C]0.315349[/C][/ROW]
[ROW][C]42[/C][C]-0.10098[/C][C]-1.4245[/C][C]0.077935[/C][/ROW]
[ROW][C]43[/C][C]0.173561[/C][C]2.4484[/C][C]0.007608[/C][/ROW]
[ROW][C]44[/C][C]-0.007861[/C][C]-0.1109[/C][C]0.455905[/C][/ROW]
[ROW][C]45[/C][C]0.029332[/C][C]0.4138[/C][C]0.339739[/C][/ROW]
[ROW][C]46[/C][C]-0.06399[/C][C]-0.9027[/C][C]0.18389[/C][/ROW]
[ROW][C]47[/C][C]-0.026779[/C][C]-0.3778[/C][C]0.353004[/C][/ROW]
[ROW][C]48[/C][C]0.013461[/C][C]0.1899[/C][C]0.424797[/C][/ROW]
[/TABLE]
Source: https://freestatistics.org/blog/index.php?pk=310584&T=1

Globally Unique Identifier (entire table): ba.freestatistics.org/blog/index.php?pk=310584&T=1

As an alternative you can also use a QR Code:  

The GUIDs for individual cells are displayed in the table below:

Autocorrelation Function
Time lag kACF(k)T-STATP-value
1-0.320835-4.52595e-06
2-0.024647-0.34770.364221
3-0.044714-0.63080.26446
4-0.037894-0.53460.296773
50.070710.99750.159868
6-0.052707-0.74350.229019
70.0505870.71360.238151
8-0.026948-0.38010.35212
90.0480520.67790.249323
10-0.058314-0.82260.205854
110.1277351.80190.036536
12-0.383846-5.41480
130.1037091.4630.072523
140.0636660.89810.185103
150.018350.25890.398008
16-0.037267-0.52570.299835
17-0.071607-1.01010.156829
180.0544240.76770.221776
19-0.056744-0.80050.212195
204.5e-056e-040.499745
21-0.028959-0.40850.341668
220.1314961.8550.03254
230.0449960.63470.263161
24-0.137559-1.94050.026866
250.0360130.5080.306
26-0.065162-0.91920.179547
270.0335130.47280.318449
280.1364341.92460.02785
290.0029750.0420.483286
300.0145660.20550.418703
31-0.062187-0.87730.190701
320.0063840.09010.464166
330.0234920.33140.370346
34-0.070011-0.98760.162268
350.0338460.47750.31678
360.0444650.62730.265606
370.0576150.81280.208662
38-0.001265-0.01780.492889
39-0.18162-2.56210.005572
40-0.021421-0.30220.381413
410.0341320.48150.315349
42-0.10098-1.42450.077935
430.1735612.44840.007608
44-0.007861-0.11090.455905
450.0293320.41380.339739
46-0.06399-0.90270.18389
47-0.026779-0.37780.353004
480.0134610.18990.424797


Partial Autocorrelation Function
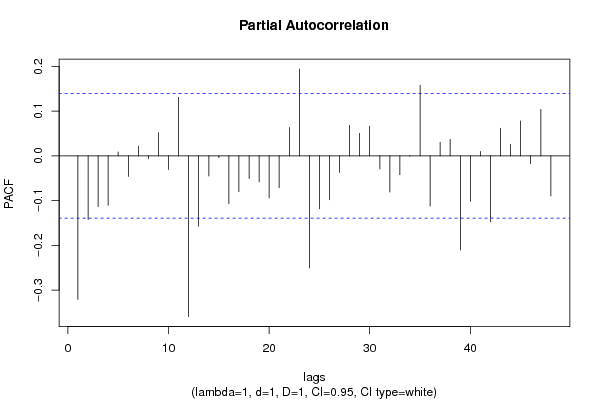
Time lag kPACF(k)T-STATP-value
1-0.320835-4.52595e-06
2-0.142221-2.00630.02309
3-0.113065-1.5950.056152
4-0.11041-1.55750.060467
50.00860.12130.451779
6-0.045812-0.64630.259427
70.0213890.30170.381587
8-0.006305-0.08890.464608
90.0516520.72860.233539
10-0.03057-0.43120.33338
110.1307831.84490.033268
12-0.359374-5.06960
13-0.157043-2.21540.013934
14-0.044949-0.63410.263375
15-0.003999-0.05640.477533
16-0.106877-1.50770.066611
17-0.080046-1.12920.130089
18-0.050716-0.71540.23759
19-0.05823-0.82140.20619
20-0.094354-1.3310.092351
21-0.07098-1.00130.158949
220.0635270.89620.185627
230.1942362.740.003351
24-0.25057-3.53470.000254
25-0.118084-1.66580.048665
26-0.098309-1.38680.083525
27-0.037137-0.52390.30047
280.0682130.96230.168544
290.0502680.70910.239542
300.0660510.93180.176295
31-0.029208-0.4120.340381
32-0.080691-1.13830.128184
33-0.042024-0.59280.276985
34-0.000747-0.01050.495803
350.1578352.22650.01355
36-0.112177-1.58240.057568
370.030590.43150.333277
380.0368050.51920.302099
39-0.210561-2.97030.00167
40-0.101653-1.4340.076572
410.0096040.13550.446183
42-0.147108-2.07520.019626
430.0617160.87060.192509
440.0257760.36360.358268
450.0780391.10090.136141
46-0.017514-0.24710.402559
470.1036831.46260.072574
48-0.08941-1.26130.104343

\begin{tabular}{lllllllll}
\hline
Partial Autocorrelation Function \tabularnewline
Time lag k & PACF(k) & T-STAT & P-value \tabularnewline
1 & -0.320835 & -4.5259 & 5e-06 \tabularnewline
2 & -0.142221 & -2.0063 & 0.02309 \tabularnewline
3 & -0.113065 & -1.595 & 0.056152 \tabularnewline
4 & -0.11041 & -1.5575 & 0.060467 \tabularnewline
5 & 0.0086 & 0.1213 & 0.451779 \tabularnewline
6 & -0.045812 & -0.6463 & 0.259427 \tabularnewline
7 & 0.021389 & 0.3017 & 0.381587 \tabularnewline
8 & -0.006305 & -0.0889 & 0.464608 \tabularnewline
9 & 0.051652 & 0.7286 & 0.233539 \tabularnewline
10 & -0.03057 & -0.4312 & 0.33338 \tabularnewline
11 & 0.130783 & 1.8449 & 0.033268 \tabularnewline
12 & -0.359374 & -5.0696 & 0 \tabularnewline
13 & -0.157043 & -2.2154 & 0.013934 \tabularnewline
14 & -0.044949 & -0.6341 & 0.263375 \tabularnewline
15 & -0.003999 & -0.0564 & 0.477533 \tabularnewline
16 & -0.106877 & -1.5077 & 0.066611 \tabularnewline
17 & -0.080046 & -1.1292 & 0.130089 \tabularnewline
18 & -0.050716 & -0.7154 & 0.23759 \tabularnewline
19 & -0.05823 & -0.8214 & 0.20619 \tabularnewline
20 & -0.094354 & -1.331 & 0.092351 \tabularnewline
21 & -0.07098 & -1.0013 & 0.158949 \tabularnewline
22 & 0.063527 & 0.8962 & 0.185627 \tabularnewline
23 & 0.194236 & 2.74 & 0.003351 \tabularnewline
24 & -0.25057 & -3.5347 & 0.000254 \tabularnewline
25 & -0.118084 & -1.6658 & 0.048665 \tabularnewline
26 & -0.098309 & -1.3868 & 0.083525 \tabularnewline
27 & -0.037137 & -0.5239 & 0.30047 \tabularnewline
28 & 0.068213 & 0.9623 & 0.168544 \tabularnewline
29 & 0.050268 & 0.7091 & 0.239542 \tabularnewline
30 & 0.066051 & 0.9318 & 0.176295 \tabularnewline
31 & -0.029208 & -0.412 & 0.340381 \tabularnewline
32 & -0.080691 & -1.1383 & 0.128184 \tabularnewline
33 & -0.042024 & -0.5928 & 0.276985 \tabularnewline
34 & -0.000747 & -0.0105 & 0.495803 \tabularnewline
35 & 0.157835 & 2.2265 & 0.01355 \tabularnewline
36 & -0.112177 & -1.5824 & 0.057568 \tabularnewline
37 & 0.03059 & 0.4315 & 0.333277 \tabularnewline
38 & 0.036805 & 0.5192 & 0.302099 \tabularnewline
39 & -0.210561 & -2.9703 & 0.00167 \tabularnewline
40 & -0.101653 & -1.434 & 0.076572 \tabularnewline
41 & 0.009604 & 0.1355 & 0.446183 \tabularnewline
42 & -0.147108 & -2.0752 & 0.019626 \tabularnewline
43 & 0.061716 & 0.8706 & 0.192509 \tabularnewline
44 & 0.025776 & 0.3636 & 0.358268 \tabularnewline
45 & 0.078039 & 1.1009 & 0.136141 \tabularnewline
46 & -0.017514 & -0.2471 & 0.402559 \tabularnewline
47 & 0.103683 & 1.4626 & 0.072574 \tabularnewline
48 & -0.08941 & -1.2613 & 0.104343 \tabularnewline
\hline
\end{tabular}
%Source: https://freestatistics.org/blog/index.php?pk=310584&T=2

[TABLE]
[ROW][C]Partial Autocorrelation Function[/C][/ROW]
[ROW][C]Time lag k[/C][C]PACF(k)[/C][C]T-STAT[/C][C]P-value[/C][/ROW]
[ROW][C]1[/C][C]-0.320835[/C][C]-4.5259[/C][C]5e-06[/C][/ROW]
[ROW][C]2[/C][C]-0.142221[/C][C]-2.0063[/C][C]0.02309[/C][/ROW]
[ROW][C]3[/C][C]-0.113065[/C][C]-1.595[/C][C]0.056152[/C][/ROW]
[ROW][C]4[/C][C]-0.11041[/C][C]-1.5575[/C][C]0.060467[/C][/ROW]
[ROW][C]5[/C][C]0.0086[/C][C]0.1213[/C][C]0.451779[/C][/ROW]
[ROW][C]6[/C][C]-0.045812[/C][C]-0.6463[/C][C]0.259427[/C][/ROW]
[ROW][C]7[/C][C]0.021389[/C][C]0.3017[/C][C]0.381587[/C][/ROW]
[ROW][C]8[/C][C]-0.006305[/C][C]-0.0889[/C][C]0.464608[/C][/ROW]
[ROW][C]9[/C][C]0.051652[/C][C]0.7286[/C][C]0.233539[/C][/ROW]
[ROW][C]10[/C][C]-0.03057[/C][C]-0.4312[/C][C]0.33338[/C][/ROW]
[ROW][C]11[/C][C]0.130783[/C][C]1.8449[/C][C]0.033268[/C][/ROW]
[ROW][C]12[/C][C]-0.359374[/C][C]-5.0696[/C][C]0[/C][/ROW]
[ROW][C]13[/C][C]-0.157043[/C][C]-2.2154[/C][C]0.013934[/C][/ROW]
[ROW][C]14[/C][C]-0.044949[/C][C]-0.6341[/C][C]0.263375[/C][/ROW]
[ROW][C]15[/C][C]-0.003999[/C][C]-0.0564[/C][C]0.477533[/C][/ROW]
[ROW][C]16[/C][C]-0.106877[/C][C]-1.5077[/C][C]0.066611[/C][/ROW]
[ROW][C]17[/C][C]-0.080046[/C][C]-1.1292[/C][C]0.130089[/C][/ROW]
[ROW][C]18[/C][C]-0.050716[/C][C]-0.7154[/C][C]0.23759[/C][/ROW]
[ROW][C]19[/C][C]-0.05823[/C][C]-0.8214[/C][C]0.20619[/C][/ROW]
[ROW][C]20[/C][C]-0.094354[/C][C]-1.331[/C][C]0.092351[/C][/ROW]
[ROW][C]21[/C][C]-0.07098[/C][C]-1.0013[/C][C]0.158949[/C][/ROW]
[ROW][C]22[/C][C]0.063527[/C][C]0.8962[/C][C]0.185627[/C][/ROW]
[ROW][C]23[/C][C]0.194236[/C][C]2.74[/C][C]0.003351[/C][/ROW]
[ROW][C]24[/C][C]-0.25057[/C][C]-3.5347[/C][C]0.000254[/C][/ROW]
[ROW][C]25[/C][C]-0.118084[/C][C]-1.6658[/C][C]0.048665[/C][/ROW]
[ROW][C]26[/C][C]-0.098309[/C][C]-1.3868[/C][C]0.083525[/C][/ROW]
[ROW][C]27[/C][C]-0.037137[/C][C]-0.5239[/C][C]0.30047[/C][/ROW]
[ROW][C]28[/C][C]0.068213[/C][C]0.9623[/C][C]0.168544[/C][/ROW]
[ROW][C]29[/C][C]0.050268[/C][C]0.7091[/C][C]0.239542[/C][/ROW]
[ROW][C]30[/C][C]0.066051[/C][C]0.9318[/C][C]0.176295[/C][/ROW]
[ROW][C]31[/C][C]-0.029208[/C][C]-0.412[/C][C]0.340381[/C][/ROW]
[ROW][C]32[/C][C]-0.080691[/C][C]-1.1383[/C][C]0.128184[/C][/ROW]
[ROW][C]33[/C][C]-0.042024[/C][C]-0.5928[/C][C]0.276985[/C][/ROW]
[ROW][C]34[/C][C]-0.000747[/C][C]-0.0105[/C][C]0.495803[/C][/ROW]
[ROW][C]35[/C][C]0.157835[/C][C]2.2265[/C][C]0.01355[/C][/ROW]
[ROW][C]36[/C][C]-0.112177[/C][C]-1.5824[/C][C]0.057568[/C][/ROW]
[ROW][C]37[/C][C]0.03059[/C][C]0.4315[/C][C]0.333277[/C][/ROW]
[ROW][C]38[/C][C]0.036805[/C][C]0.5192[/C][C]0.302099[/C][/ROW]
[ROW][C]39[/C][C]-0.210561[/C][C]-2.9703[/C][C]0.00167[/C][/ROW]
[ROW][C]40[/C][C]-0.101653[/C][C]-1.434[/C][C]0.076572[/C][/ROW]
[ROW][C]41[/C][C]0.009604[/C][C]0.1355[/C][C]0.446183[/C][/ROW]
[ROW][C]42[/C][C]-0.147108[/C][C]-2.0752[/C][C]0.019626[/C][/ROW]
[ROW][C]43[/C][C]0.061716[/C][C]0.8706[/C][C]0.192509[/C][/ROW]
[ROW][C]44[/C][C]0.025776[/C][C]0.3636[/C][C]0.358268[/C][/ROW]
[ROW][C]45[/C][C]0.078039[/C][C]1.1009[/C][C]0.136141[/C][/ROW]
[ROW][C]46[/C][C]-0.017514[/C][C]-0.2471[/C][C]0.402559[/C][/ROW]
[ROW][C]47[/C][C]0.103683[/C][C]1.4626[/C][C]0.072574[/C][/ROW]
[ROW][C]48[/C][C]-0.08941[/C][C]-1.2613[/C][C]0.104343[/C][/ROW]
[/TABLE]
Source: https://freestatistics.org/blog/index.php?pk=310584&T=2

Globally Unique Identifier (entire table): ba.freestatistics.org/blog/index.php?pk=310584&T=2

As an alternative you can also use a QR Code:  

The GUIDs for individual cells are displayed in the table below:

Partial Autocorrelation Function
Time lag kPACF(k)T-STATP-value
1-0.320835-4.52595e-06
2-0.142221-2.00630.02309
3-0.113065-1.5950.056152
4-0.11041-1.55750.060467
50.00860.12130.451779
6-0.045812-0.64630.259427
70.0213890.30170.381587
8-0.006305-0.08890.464608
90.0516520.72860.233539
10-0.03057-0.43120.33338
110.1307831.84490.033268
12-0.359374-5.06960
13-0.157043-2.21540.013934
14-0.044949-0.63410.263375
15-0.003999-0.05640.477533
16-0.106877-1.50770.066611
17-0.080046-1.12920.130089
18-0.050716-0.71540.23759
19-0.05823-0.82140.20619
20-0.094354-1.3310.092351
21-0.07098-1.00130.158949
220.0635270.89620.185627
230.1942362.740.003351
24-0.25057-3.53470.000254
25-0.118084-1.66580.048665
26-0.098309-1.38680.083525
27-0.037137-0.52390.30047
280.0682130.96230.168544
290.0502680.70910.239542
300.0660510.93180.176295
31-0.029208-0.4120.340381
32-0.080691-1.13830.128184
33-0.042024-0.59280.276985
34-0.000747-0.01050.495803
350.1578352.22650.01355
36-0.112177-1.58240.057568
370.030590.43150.333277
380.0368050.51920.302099
39-0.210561-2.97030.00167
40-0.101653-1.4340.076572
410.0096040.13550.446183
42-0.147108-2.07520.019626
430.0617160.87060.192509
440.0257760.36360.358268
450.0780391.10090.136141
46-0.017514-0.24710.402559
470.1036831.46260.072574
48-0.08941-1.26130.104343


Parameters (Session):
par1 = FALSE ; par2 = 1 ; par3 = 1 ; par4 = 1 ; par5 = 12 ; par6 = 3 ; par7 = 1 ; par8 = 2 ; par9 = 1 ;
Parameters (R input):
par1 = 48 ; par2 = 1 ; par3 = 1 ; par4 = 1 ; par5 = 12 ; par6 = White Noise ; par7 = 0.95 ; par8 = ;
R code (references can be found in the software module):
par8 <- ''
par7 <- '0.95'
par6 <- 'White Noise'
par5 <- '12'
par4 <- '1'
par3 <- '0'
par2 <- '1'
par1 <- '48'
if (par1 == 'Default') {
par1 = 10*log10(length(x))
} else {
par1 <- as.numeric(par1)
}
par2 <- as.numeric(par2)
par3 <- as.numeric(par3)
par4 <- as.numeric(par4)
par5 <- as.numeric(par5)
if (par6 == 'White Noise') par6 <- 'white' else par6 <- 'ma'
par7 <- as.numeric(par7)
if (par8 != '') par8 <- as.numeric(par8)
x <- na.omit(x)
ox <- x
if (par8 == '') {
if (par2 == 0) {
x <- log(x)
} else {
x <- (x ^ par2 - 1) / par2
}
} else {
x <- log(x,base=par8)
}
if (par3 > 0) x <- diff(x,lag=1,difference=par3)
if (par4 > 0) x <- diff(x,lag=par5,difference=par4)
bitmap(file='picts.png')
op <- par(mfrow=c(2,1))
plot(ox,type='l',main='Original Time Series',xlab='time',ylab='value')
if (par8=='') {
mytitle <- paste('Working Time Series (lambda=',par2,', d=',par3,', D=',par4,')',sep='')
mysub <- paste('(lambda=',par2,', d=',par3,', D=',par4,', CI=', par7, ', CI type=',par6,')',sep='')
} else {
mytitle <- paste('Working Time Series (base=',par8,', d=',par3,', D=',par4,')',sep='')
mysub <- paste('(base=',par8,', d=',par3,', D=',par4,', CI=', par7, ', CI type=',par6,')',sep='')
}
plot(x,type='l', main=mytitle,xlab='time',ylab='value')
par(op)
dev.off()
bitmap(file='pic1.png')
racf <- acf(x, par1, main='Autocorrelation', xlab='time lag', ylab='ACF', ci.type=par6, ci=par7, sub=mysub)
dev.off()
bitmap(file='pic2.png')
rpacf <- pacf(x,par1,main='Partial Autocorrelation',xlab='lags',ylab='PACF',sub=mysub)
dev.off()
(myacf <- c(racf$acf))
(mypacf <- c(rpacf$acf))
lengthx <- length(x)
sqrtn <- sqrt(lengthx)
load(file='createtable')
a<-table.start()
a<-table.row.start(a)
a<-table.element(a,'Autocorrelation Function',4,TRUE)
a<-table.row.end(a)
a<-table.row.start(a)
a<-table.element(a,'Time lag k',header=TRUE)
a<-table.element(a,'ACF(k)',header=TRUE)
a<-table.element(a,'T-STAT',header=TRUE)
a<-table.element(a,'P-value',header=TRUE)
a<-table.row.end(a)
for (i in 2:(par1+1)) {
a<-table.row.start(a)
a<-table.element(a,i-1,header=TRUE)
a<-table.element(a,round(myacf[i],6))
mytstat <- myacf[i]*sqrtn
a<-table.element(a,round(mytstat,4))
a<-table.element(a,round(1-pt(abs(mytstat),lengthx),6))
a<-table.row.end(a)
}
a<-table.end(a)
table.save(a,file='mytable.tab')
a<-table.start()
a<-table.row.start(a)
a<-table.element(a,'Partial Autocorrelation Function',4,TRUE)
a<-table.row.end(a)
a<-table.row.start(a)
a<-table.element(a,'Time lag k',header=TRUE)
a<-table.element(a,'PACF(k)',header=TRUE)
a<-table.element(a,'T-STAT',header=TRUE)
a<-table.element(a,'P-value',header=TRUE)
a<-table.row.end(a)
for (i in 1:par1) {
a<-table.row.start(a)
a<-table.element(a,i,header=TRUE)
a<-table.element(a,round(mypacf[i],6))
mytstat <- mypacf[i]*sqrtn
a<-table.element(a,round(mytstat,4))
a<-table.element(a,round(1-pt(abs(mytstat),lengthx),6))
a<-table.row.end(a)
}
a<-table.end(a)
table.save(a,file='mytable1.tab')