Free Statistics

of Irreproducible Research!

Author's title

Author*The author of this computation has been verified*
R Software Modulerwasp_smp.wasp
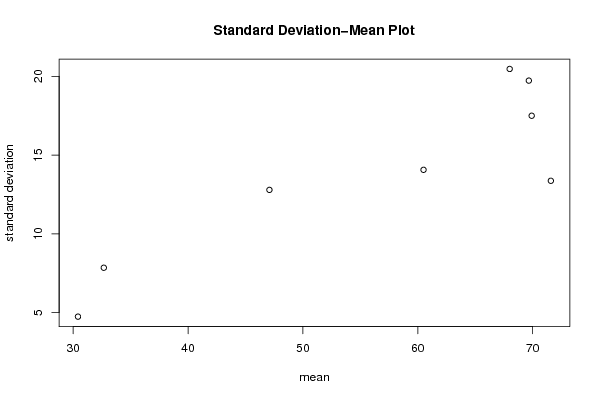
Title produced by softwareStandard Deviation-Mean Plot
Date of computationWed, 20 Dec 2017 19:28:04 +0100
Cite this page as followsStatistical Computations at FreeStatistics.org, Office for Research Development and Education, URL https://freestatistics.org/blog/index.php?v=date/2017/Dec/20/t1513795703gvsd9ci649cl8vh.htm/, Retrieved Tue, 14 May 2024 09:32:06 +0000
Statistical Computations at FreeStatistics.org, Office for Research Development and Education, URL https://freestatistics.org/blog/index.php?pk=310561, Retrieved Tue, 14 May 2024 09:32:06 +0000
QR Codes:

Original text written by user:
IsPrivate?No (this computation is public)
User-defined keywords
Estimated Impact107
Family? (F = Feedback message, R = changed R code, M = changed R Module, P = changed Parameters, D = changed Data)
-       [Standard Deviation-Mean Plot] [lambda] [2017-12-20 18:28:04] [84592a6ba07caf36916a6fee2e3505cc] [Current]
Feedback Forum

Post a new message
Dataseries X:
67
61
113
61
43
105
63
64
69
60
59
71
66
65
76
64
41
106
52
62
49
106
75
54
63
48
64
65
69
31
51
52
78
72
80
53
69
61
52
82
100
73
71
62
80
85
65
59
78
92
89
82
83
79
80
50
40
58
56
52
55
59
45
77
48
46
41
35
47
47
26
39
33
40
43
41
24
41
25
22
36
24
27
36
27
27
39
35
29
28
29
23
27
36
35
30
19
22
23
21
34
32
24
22
17
26
19


Summary of computational transaction
Raw Input view raw input (R code)
Raw Outputview raw output of R engine
Computing time1 seconds
R ServerBig Analytics Cloud Computing Center

\begin{tabular}{lllllllll}
\hline
Summary of computational transaction \tabularnewline
Raw Input view raw input (R code)  \tabularnewline
Raw Outputview raw output of R engine  \tabularnewline
Computing time1 seconds \tabularnewline
R ServerBig Analytics Cloud Computing Center \tabularnewline
\hline
\end{tabular}
%Source: https://freestatistics.org/blog/index.php?pk=310561&T=0

[TABLE]
[ROW]
Summary of computational transaction[/C][/ROW] [ROW]Raw Input[/C] view raw input (R code) [/C][/ROW] [ROW]Raw Output[/C]view raw output of R engine [/C][/ROW] [ROW]Computing time[/C]1 seconds[/C][/ROW] [ROW]R Server[/C]Big Analytics Cloud Computing Center[/C][/ROW] [/TABLE] Source: https://freestatistics.org/blog/index.php?pk=310561&T=0

Globally Unique Identifier (entire table): ba.freestatistics.org/blog/index.php?pk=310561&T=0

As an alternative you can also use a QR Code:  

The GUIDs for individual cells are displayed in the table below:

Summary of computational transaction
Raw Input view raw input (R code)
Raw Outputview raw output of R engine
Computing time1 seconds
R ServerBig Analytics Cloud Computing Center


Standard Deviation-Mean Plot
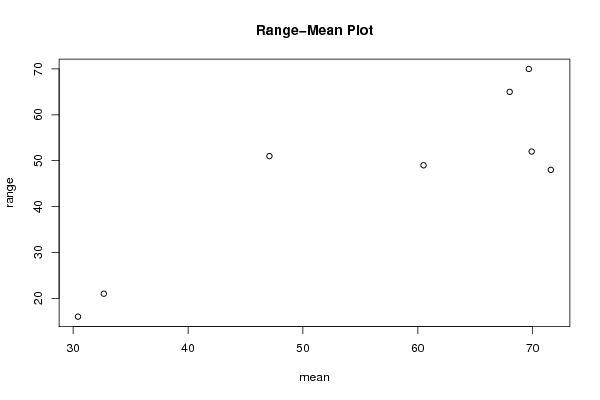
SectionMeanStandard DeviationRange
169.666666666666719.726923610931270
26820.467268770138665
360.514.061552998416449
471.583333333333313.365208112064248
569.916666666666717.495237447183552
647.083333333333312.788192944582951
732.66666666666677.8431595365102421
830.41666666666674.7378233079094116

\begin{tabular}{lllllllll}
\hline
Standard Deviation-Mean Plot \tabularnewline
Section & Mean & Standard Deviation & Range \tabularnewline
1 & 69.6666666666667 & 19.7269236109312 & 70 \tabularnewline
2 & 68 & 20.4672687701386 & 65 \tabularnewline
3 & 60.5 & 14.0615529984164 & 49 \tabularnewline
4 & 71.5833333333333 & 13.3652081120642 & 48 \tabularnewline
5 & 69.9166666666667 & 17.4952374471835 & 52 \tabularnewline
6 & 47.0833333333333 & 12.7881929445829 & 51 \tabularnewline
7 & 32.6666666666667 & 7.84315953651024 & 21 \tabularnewline
8 & 30.4166666666667 & 4.73782330790941 & 16 \tabularnewline
\hline
\end{tabular}
%Source: https://freestatistics.org/blog/index.php?pk=310561&T=1

[TABLE]
[ROW][C]Standard Deviation-Mean Plot[/C][/ROW]
[ROW][C]Section[/C][C]Mean[/C][C]Standard Deviation[/C][C]Range[/C][/ROW]
[ROW][C]1[/C][C]69.6666666666667[/C][C]19.7269236109312[/C][C]70[/C][/ROW]
[ROW][C]2[/C][C]68[/C][C]20.4672687701386[/C][C]65[/C][/ROW]
[ROW][C]3[/C][C]60.5[/C][C]14.0615529984164[/C][C]49[/C][/ROW]
[ROW][C]4[/C][C]71.5833333333333[/C][C]13.3652081120642[/C][C]48[/C][/ROW]
[ROW][C]5[/C][C]69.9166666666667[/C][C]17.4952374471835[/C][C]52[/C][/ROW]
[ROW][C]6[/C][C]47.0833333333333[/C][C]12.7881929445829[/C][C]51[/C][/ROW]
[ROW][C]7[/C][C]32.6666666666667[/C][C]7.84315953651024[/C][C]21[/C][/ROW]
[ROW][C]8[/C][C]30.4166666666667[/C][C]4.73782330790941[/C][C]16[/C][/ROW]
[/TABLE]
Source: https://freestatistics.org/blog/index.php?pk=310561&T=1

Globally Unique Identifier (entire table): ba.freestatistics.org/blog/index.php?pk=310561&T=1

As an alternative you can also use a QR Code:  

The GUIDs for individual cells are displayed in the table below:

Standard Deviation-Mean Plot
SectionMeanStandard DeviationRange
169.666666666666719.726923610931270
26820.467268770138665
360.514.061552998416449
471.583333333333313.365208112064248
569.916666666666717.495237447183552
647.083333333333312.788192944582951
732.66666666666677.8431595365102421
830.41666666666674.7378233079094116


Regression: S.E.(k) = alpha + beta * Mean(k)
alpha-2.15968423880944
beta0.284022617202398
S.D.0.060587818593791
T-STAT4.68778417501079
p-value0.00336858094768617

\begin{tabular}{lllllllll}
\hline
Regression: S.E.(k) = alpha + beta * Mean(k) \tabularnewline
alpha & -2.15968423880944 \tabularnewline
beta & 0.284022617202398 \tabularnewline
S.D. & 0.060587818593791 \tabularnewline
T-STAT & 4.68778417501079 \tabularnewline
p-value & 0.00336858094768617 \tabularnewline
\hline
\end{tabular}
%Source: https://freestatistics.org/blog/index.php?pk=310561&T=2

[TABLE]
[ROW][C]Regression: S.E.(k) = alpha + beta * Mean(k)[/C][/ROW]
[ROW][C]alpha[/C][C]-2.15968423880944[/C][/ROW]
[ROW][C]beta[/C][C]0.284022617202398[/C][/ROW]
[ROW][C]S.D.[/C][C]0.060587818593791[/C][/ROW]
[ROW][C]T-STAT[/C][C]4.68778417501079[/C][/ROW]
[ROW][C]p-value[/C][C]0.00336858094768617[/C][/ROW]
[/TABLE]
Source: https://freestatistics.org/blog/index.php?pk=310561&T=2

Globally Unique Identifier (entire table): ba.freestatistics.org/blog/index.php?pk=310561&T=2

As an alternative you can also use a QR Code:  

The GUIDs for individual cells are displayed in the table below:

Regression: S.E.(k) = alpha + beta * Mean(k)
alpha-2.15968423880944
beta0.284022617202398
S.D.0.060587818593791
T-STAT4.68778417501079
p-value0.00336858094768617


Regression: ln S.E.(k) = alpha + beta * ln Mean(k)
alpha-2.6270899199796
beta1.29657021560297
S.D.0.224941766605747
T-STAT5.76402610847922
p-value0.00118928972590732
Lambda-0.296570215602967

\begin{tabular}{lllllllll}
\hline
Regression: ln S.E.(k) = alpha + beta * ln Mean(k) \tabularnewline
alpha & -2.6270899199796 \tabularnewline
beta & 1.29657021560297 \tabularnewline
S.D. & 0.224941766605747 \tabularnewline
T-STAT & 5.76402610847922 \tabularnewline
p-value & 0.00118928972590732 \tabularnewline
Lambda & -0.296570215602967 \tabularnewline
\hline
\end{tabular}
%Source: https://freestatistics.org/blog/index.php?pk=310561&T=3

[TABLE]
[ROW][C]Regression: ln S.E.(k) = alpha + beta * ln Mean(k)[/C][/ROW]
[ROW][C]alpha[/C][C]-2.6270899199796[/C][/ROW]
[ROW][C]beta[/C][C]1.29657021560297[/C][/ROW]
[ROW][C]S.D.[/C][C]0.224941766605747[/C][/ROW]
[ROW][C]T-STAT[/C][C]5.76402610847922[/C][/ROW]
[ROW][C]p-value[/C][C]0.00118928972590732[/C][/ROW]
[ROW][C]Lambda[/C][C]-0.296570215602967[/C][/ROW]
[/TABLE]
Source: https://freestatistics.org/blog/index.php?pk=310561&T=3

Globally Unique Identifier (entire table): ba.freestatistics.org/blog/index.php?pk=310561&T=3

As an alternative you can also use a QR Code:  

The GUIDs for individual cells are displayed in the table below:

Regression: ln S.E.(k) = alpha + beta * ln Mean(k)
alpha-2.6270899199796
beta1.29657021560297
S.D.0.224941766605747
T-STAT5.76402610847922
p-value0.00118928972590732
Lambda-0.296570215602967


Parameters (Session):
par1 = 1 ; par2 = 1 ; par3 = 1 ; par4 = 4 ;
Parameters (R input):
par1 = 12 ;
R code (references can be found in the software module):
par1 <- as.numeric(par1)
(n <- length(x))
(np <- floor(n / par1))
arr <- array(NA,dim=c(par1,np))
j <- 0
k <- 1
for (i in 1:(np*par1))
{
j = j + 1
arr[j,k] <- x[i]
if (j == par1) {
j = 0
k=k+1
}
}
arr
arr.mean <- array(NA,dim=np)
arr.sd <- array(NA,dim=np)
arr.range <- array(NA,dim=np)
for (j in 1:np)
{
arr.mean[j] <- mean(arr[,j],na.rm=TRUE)
arr.sd[j] <- sd(arr[,j],na.rm=TRUE)
arr.range[j] <- max(arr[,j],na.rm=TRUE) - min(arr[,j],na.rm=TRUE)
}
arr.mean
arr.sd
arr.range
(lm1 <- lm(arr.sd~arr.mean))
(lnlm1 <- lm(log(arr.sd)~log(arr.mean)))
(lm2 <- lm(arr.range~arr.mean))
bitmap(file='test1.png')
plot(arr.mean,arr.sd,main='Standard Deviation-Mean Plot',xlab='mean',ylab='standard deviation')
dev.off()
bitmap(file='test2.png')
plot(arr.mean,arr.range,main='Range-Mean Plot',xlab='mean',ylab='range')
dev.off()
load(file='createtable')
a<-table.start()
a<-table.row.start(a)
a<-table.element(a,'Standard Deviation-Mean Plot',4,TRUE)
a<-table.row.end(a)
a<-table.row.start(a)
a<-table.element(a,'Section',header=TRUE)
a<-table.element(a,'Mean',header=TRUE)
a<-table.element(a,'Standard Deviation',header=TRUE)
a<-table.element(a,'Range',header=TRUE)
a<-table.row.end(a)
for (j in 1:np) {
a<-table.row.start(a)
a<-table.element(a,j,header=TRUE)
a<-table.element(a,arr.mean[j])
a<-table.element(a,arr.sd[j] )
a<-table.element(a,arr.range[j] )
a<-table.row.end(a)
}
a<-table.end(a)
table.save(a,file='mytable.tab')
a<-table.start()
a<-table.row.start(a)
a<-table.element(a,'Regression: S.E.(k) = alpha + beta * Mean(k)',2,TRUE)
a<-table.row.end(a)
a<-table.row.start(a)
a<-table.element(a,'alpha',header=TRUE)
a<-table.element(a,lm1$coefficients[[1]])
a<-table.row.end(a)
a<-table.row.start(a)
a<-table.element(a,'beta',header=TRUE)
a<-table.element(a,lm1$coefficients[[2]])
a<-table.row.end(a)
a<-table.row.start(a)
a<-table.element(a,'S.D.',header=TRUE)
a<-table.element(a,summary(lm1)$coefficients[2,2])
a<-table.row.end(a)
a<-table.row.start(a)
a<-table.element(a,'T-STAT',header=TRUE)
a<-table.element(a,summary(lm1)$coefficients[2,3])
a<-table.row.end(a)
a<-table.row.start(a)
a<-table.element(a,'p-value',header=TRUE)
a<-table.element(a,summary(lm1)$coefficients[2,4])
a<-table.row.end(a)
a<-table.end(a)
table.save(a,file='mytable1.tab')
a<-table.start()
a<-table.row.start(a)
a<-table.element(a,'Regression: ln S.E.(k) = alpha + beta * ln Mean(k)',2,TRUE)
a<-table.row.end(a)
a<-table.row.start(a)
a<-table.element(a,'alpha',header=TRUE)
a<-table.element(a,lnlm1$coefficients[[1]])
a<-table.row.end(a)
a<-table.row.start(a)
a<-table.element(a,'beta',header=TRUE)
a<-table.element(a,lnlm1$coefficients[[2]])
a<-table.row.end(a)
a<-table.row.start(a)
a<-table.element(a,'S.D.',header=TRUE)
a<-table.element(a,summary(lnlm1)$coefficients[2,2])
a<-table.row.end(a)
a<-table.row.start(a)
a<-table.element(a,'T-STAT',header=TRUE)
a<-table.element(a,summary(lnlm1)$coefficients[2,3])
a<-table.row.end(a)
a<-table.row.start(a)
a<-table.element(a,'p-value',header=TRUE)
a<-table.element(a,summary(lnlm1)$coefficients[2,4])
a<-table.row.end(a)
a<-table.row.start(a)
a<-table.element(a,'Lambda',header=TRUE)
a<-table.element(a,1-lnlm1$coefficients[[2]])
a<-table.row.end(a)
a<-table.end(a)
table.save(a,file='mytable2.tab')