Free Statistics
of Irreproducible Research!
Description of Statistical Computation | ||||||||||||||||||||||||||||||||||||||||||||||
|---|---|---|---|---|---|---|---|---|---|---|---|---|---|---|---|---|---|---|---|---|---|---|---|---|---|---|---|---|---|---|---|---|---|---|---|---|---|---|---|---|---|---|---|---|---|---|
| Author's title | ||||||||||||||||||||||||||||||||||||||||||||||
| Author | *The author of this computation has been verified* | |||||||||||||||||||||||||||||||||||||||||||||
| R Software Module | rwasp_spearman.wasp | |||||||||||||||||||||||||||||||||||||||||||||
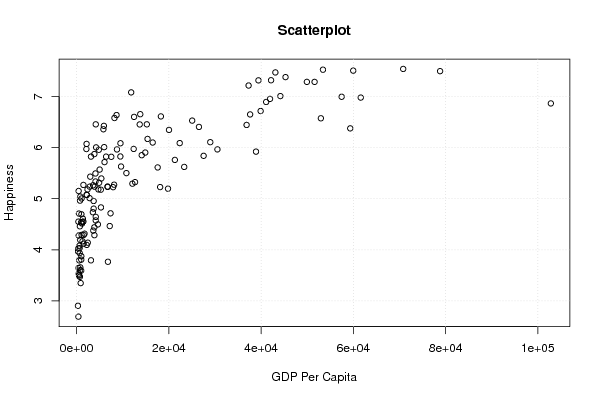
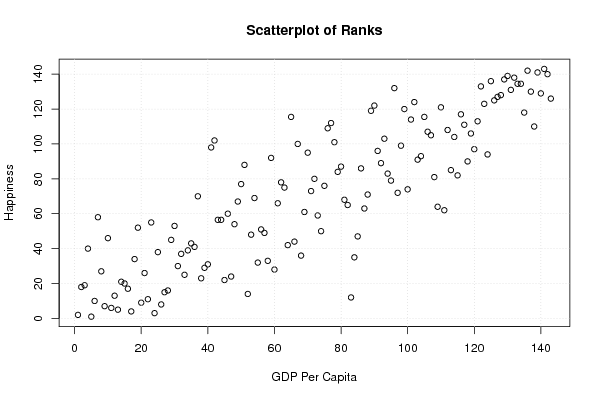
| Title produced by software | Spearman Rank Correlation | |||||||||||||||||||||||||||||||||||||||||||||
| Date of computation | Wed, 20 Dec 2017 19:04:15 +0100 | |||||||||||||||||||||||||||||||||||||||||||||
| Cite this page as follows | Statistical Computations at FreeStatistics.org, Office for Research Development and Education, URL https://freestatistics.org/blog/index.php?v=date/2017/Dec/20/t1513793220m4qxnflroddmyue.htm/, Retrieved Tue, 14 May 2024 12:59:30 +0000 | |||||||||||||||||||||||||||||||||||||||||||||
| Statistical Computations at FreeStatistics.org, Office for Research Development and Education, URL https://freestatistics.org/blog/index.php?pk=310559, Retrieved Tue, 14 May 2024 12:59:30 +0000 | ||||||||||||||||||||||||||||||||||||||||||||||
| QR Codes: | ||||||||||||||||||||||||||||||||||||||||||||||
|
| ||||||||||||||||||||||||||||||||||||||||||||||
| Original text written by user: | ||||||||||||||||||||||||||||||||||||||||||||||
| IsPrivate? | No (this computation is public) | |||||||||||||||||||||||||||||||||||||||||||||
| User-defined keywords | ||||||||||||||||||||||||||||||||||||||||||||||
| Estimated Impact | 86 | |||||||||||||||||||||||||||||||||||||||||||||
Tree of Dependent Computations | ||||||||||||||||||||||||||||||||||||||||||||||
| Family? (F = Feedback message, R = changed R code, M = changed R Module, P = changed Parameters, D = changed Data) | ||||||||||||||||||||||||||||||||||||||||||||||
| - [Spearman Rank Correlation] [Spearman Rank Cor...] [2017-12-20 18:04:15] [cbdc27eb3c0ce1e50616f96e5af4492f] [Current] | ||||||||||||||||||||||||||||||||||||||||||||||
| Feedback Forum | ||||||||||||||||||||||||||||||||||||||||||||||
Post a new message | ||||||||||||||||||||||||||||||||||||||||||||||
Dataset | ||||||||||||||||||||||||||||||||||||||||||||||
| Dataseries X: | ||||||||||||||||||||||||||||||||||||||||||||||
561.7787463 4146.8962500 3843.7523220 3110.8081830 12449.2168500 3606.1520570 49927.8195100 44176.5152200 3876.9364330 22354.1670700 1358.7797520 4989.2546110 41096.1573000 4810.5659020 789.4404107 2804.0002230 3104.9560890 4708.7182610 6788.0427450 8649.9484920 7350.7958010 649.7304837 285.7274421 1269.9072380 1032.6487220 42157.9279900 382.2131743 664.2956519 13792.9260500 8123.1808730 5805.6053350 444.5053168 1528.2448300 11824.6381000 12090.6665600 23324.2017400 18266.5496900 53417.6642800 6722.2235360 5968.9841380 3514.4900970 4223.5845790 17574.6873600 706.7577541 43090.2475100 36854.9682800 7179.3406610 3853.6499040 41936.0585800 1513.4610340 18103.9693200 4146.7441290 508.1450784 739.5954363 2361.1576200 12664.8474400 59976.9425700 1709.3879210 3570.2948880 4609.6006940 61606.4829400 37292.6122200 30527.2682000 4868.2482630 38894.4677300 4087.9375170 7510.0772090 1455.3597650 28975.4010800 1077.0361740 14118.0639100 7914.0046770 998.1343716 455.3707414 14879.6803000 102831.3215000 5237.1476700 401.3188701 300.7948251 9502.5683960 780.5071109 25058.1706100 1077.5561360 9627.5957850 8201.3062530 3686.4516980 6701.0000800 2832.4297770 382.0693304 1275.0176080 4140.4619320 729.5325011 45294.7800000 39426.6235000 2151.3820470 363.2269739 2177.9851700 70812.4774200 1468.1929460 13680.2360100 4080.2046440 6045.6500770 2951.0719290 12372.4170600 19813.3082500 59330.8599900 9474.1306040 8748.3645040 702.8356016 20028.6482100 958.0737379 5348.2940640 496.0494634 52960.7141900 16495.9876800 21304.5701600 434.2088097 5273.5938800 27538.8061300 26528.4917900 3835.3948170 2415.0381620 51599.8688700 78812.6506900 795.8438644 879.1938140 5907.9134320 578.4616936 15377.0988100 3688.6463750 10787.6093400 6389.3341430 615.3088032 2185.7280310 37622.2074600 39899.3883900 57466.7871100 15220.5660300 2110.6478720 2185.6902820 990.3347740 1178.3879050 1008.5973310 | ||||||||||||||||||||||||||||||||||||||||||||||
| Dataseries Y: | ||||||||||||||||||||||||||||||||||||||||||||||
3.79399991035461 4.64400005340576 5.87200021743774 3.79500007629395 6.59899997711182 4.37599992752075 7.28399991989136 7.00600004196167 5.23400020599365 6.08699989318848 4.60799980163574 5.56899976730347 6.89099979400635 5.95599985122681 3.65700006484985 5.01100015640259 5.82299995422363 5.18200016021729 3.76600003242493 6.63500022888184 4.71400022506714 4.03200006484985 2.90499997138977 4.16800022125244 4.69500017166138 7.31599998474121 2.69300007820129 3.93600010871887 6.65199995040894 5.27299976348877 6.35699987411499 4.28000020980835 4.29099988937378 7.07899999618530 5.29300022125244 5.62099981307983 6.60900020599365 7.52199983596802 5.23000001907349 6.00799989700317 4.73500013351440 6.00299978256226 5.61100006103516 4.46000003814697 7.46899986267090 6.44199991226196 4.46500015258789 4.28599977493286 6.95100021362305 4.11999988555908 5.22700023651123 6.45399999618530 3.50699996948242 3.60299992561340 5.18100023269653 5.32399988174438 7.50400018692017 4.31500005722046 5.26200008392334 4.49700021743774 6.97700023651123 7.21299982070923 5.96400022506714 5.31099987030029 5.92000007629395 5.33599996566772 5.81899976730347 4.55299997329712 6.10500001907349 5.00400018692017 5.84999990463257 5.22499990463257 3.80800008773804 3.53299999237061 5.90199995040894 6.86299991607666 5.17500019073486 3.64400005340576 3.97000002861023 6.08400011062622 4.19000005722046 6.52699995040894 4.29199981689453 5.62900018692017 6.57800006866455 4.95499992370605 5.23699998855591 5.23500013351440 4.55000019073486 4.54500007629395 4.57399988174438 4.96199989318848 7.37699985504150 7.31400012969971 6.07100009918213 4.02799987792969 5.07399988174438 7.53700017929077 5.26900005340576 6.45200014114380 5.49300003051758 5.71500015258789 5.42999982833862 5.97300004959106 5.19500017166138 6.37500000000000 5.82499980926514 5.96299982070923 3.47099995613098 6.34399986267090 4.53499984741211 5.39499998092651 4.70900011062622 6.57200002670288 6.09800004959106 5.75799989700317 5.15100002288818 4.82899999618530 5.83799982070923 6.40299987792969 4.44000005722046 4.13899993896484 7.28399991989136 7.49399995803833 5.04099988937378 3.34899997711182 6.42399978637695 3.49499988555908 6.16800022125244 4.80499982833862 5.50000000000000 5.82200002670288 4.08099985122681 4.09600019454956 6.64799976348877 6.71400022506714 6.99300003051758 6.45399999618530 5.97100019454956 5.07399988174438 3.59299993515015 4.51399993896484 3.87500000000000 | ||||||||||||||||||||||||||||||||||||||||||||||
Tables (Output of Computation) | ||||||||||||||||||||||||||||||||||||||||||||||
| ||||||||||||||||||||||||||||||||||||||||||||||
Figures (Output of Computation) | ||||||||||||||||||||||||||||||||||||||||||||||
Input Parameters & R Code | ||||||||||||||||||||||||||||||||||||||||||||||
| Parameters (Session): | ||||||||||||||||||||||||||||||||||||||||||||||
| Parameters (R input): | ||||||||||||||||||||||||||||||||||||||||||||||
| R code (references can be found in the software module): | ||||||||||||||||||||||||||||||||||||||||||||||
k <- cor.test(x,y,method='spearman') | ||||||||||||||||||||||||||||||||||||||||||||||