Free Statistics

of Irreproducible Research!

Author's title

Author*The author of this computation has been verified*
R Software Modulerwasp_multipleregression.wasp
Title produced by softwareMultiple Regression
Date of computationWed, 20 Dec 2017 18:05:34 +0100
Cite this page as followsStatistical Computations at FreeStatistics.org, Office for Research Development and Education, URL https://freestatistics.org/blog/index.php?v=date/2017/Dec/20/t15137895819ecsxa8cjdov6aj.htm/, Retrieved Tue, 14 May 2024 11:35:07 +0000
Statistical Computations at FreeStatistics.org, Office for Research Development and Education, URL https://freestatistics.org/blog/index.php?pk=310551, Retrieved Tue, 14 May 2024 11:35:07 +0000
QR Codes:

Original text written by user:
IsPrivate?No (this computation is public)
User-defined keywords
Estimated Impact106
Family? (F = Feedback message, R = changed R code, M = changed R Module, P = changed Parameters, D = changed Data)
-       [Multiple Regression] [Regressie] [2017-12-20 17:05:34] [dd1b1eac6490c5f5f771b5814b2d0001] [Current]
Feedback Forum

Post a new message
Dataseries X:
14226	21885	274512	700
507911	14834	224455	1350
12774	20050	299741	1230
17227	15940	183984	1550
10278	18132	233625	1250
37286	20684	279148	900
28016	18742	272433	995
21159	21313	275824	775
18066	16472	222872	1150
10765	17059	191223	1450
8198	23019	289733	1450
18184	18324	240106	1100
26506	20823	238668	700
20883	20634	257343	1095
8668	20066	285024	1400
25202	19308	269620	1125
9582	16755	188202	1550
18581	19420	263234	1120
14922	19684	216002	1250
8201	18816	219454	1350
19308	22840	287587	875
33776	19385	240440	1175
18140	19459	237907	950
9137	18948	253647	1175
12405	18830	254557	700
19731	16991	261388	1175
12713	19129	243590	975
21610	19846	248479	935
18794	18994	211467	1200
14948	17783	231896	975
11013	17530	219051	1850
14828	21958	237215	1150
20810	19399	224261	1275
17037	18778	226650	850
40915	17737	203940	1050
34497	18303	213767	1250
82602	17528	206625	1550
22198	17716	231266	1300
16896	18079	233868	1150
16899	19318	212898	1395
8122	18400	199090	1500
20412	19092	264682	1400
25059	17255	189285	1600
12941	16072	216680	1400
2630	15240	229200	1340
21772	16824	187387	1400
17340	18112	214270	1200
9286	16608	180600	900
38101	18219	214513	1170
11026	18430	207012	1350
27438	18073	191157	1400
8781	17018	229942	1500
14396	17464	205985	1350
20549	16434	257481	1400
10175	17623	204676	1300
17965	18369	207271	925
16385	17732	233450	1200
9961	17261	177500	1450
8682	16745	270741	1100
35089	17780	179981	1200
12016	17782	200961	1000
12965	18794	246575	800
14556	16474	224836	1250
10817	16925	221555	1275
11512	16089	254322	1330
42008	16707	201137	1450
7702	18030	198340	1200
10704	19611	213591	1000
24497	18028	200421	1100
15598	17512	182997	1100


Summary of computational transaction
Raw Input view raw input (R code)
Raw Outputview raw output of R engine
Computing time7 seconds
R ServerBig Analytics Cloud Computing Center

\begin{tabular}{lllllllll}
\hline
Summary of computational transaction \tabularnewline
Raw Input view raw input (R code)  \tabularnewline
Raw Outputview raw output of R engine  \tabularnewline
Computing time7 seconds \tabularnewline
R ServerBig Analytics Cloud Computing Center \tabularnewline
\hline
\end{tabular}
%Source: https://freestatistics.org/blog/index.php?pk=310551&T=0

[TABLE]
[ROW]
Summary of computational transaction[/C][/ROW] [ROW]Raw Input[/C] view raw input (R code) [/C][/ROW] [ROW]Raw Output[/C]view raw output of R engine [/C][/ROW] [ROW]Computing time[/C]7 seconds[/C][/ROW] [ROW]R Server[/C]Big Analytics Cloud Computing Center[/C][/ROW] [/TABLE] Source: https://freestatistics.org/blog/index.php?pk=310551&T=0

Globally Unique Identifier (entire table): ba.freestatistics.org/blog/index.php?pk=310551&T=0

As an alternative you can also use a QR Code:  

The GUIDs for individual cells are displayed in the table below:

Summary of computational transaction
Raw Input view raw input (R code)
Raw Outputview raw output of R engine
Computing time7 seconds
R ServerBig Analytics Cloud Computing Center


Multiple Linear Regression - Estimated Regression Equation
VKP[t] = + 69576.2 + 0.0553903Inw[t] + 9.74362Ink[t] -17.6232OPC[t] + e[t]

\begin{tabular}{lllllllll}
\hline
Multiple Linear Regression - Estimated Regression Equation \tabularnewline
VKP[t] =  +  69576.2 +  0.0553903Inw[t] +  9.74362Ink[t] -17.6232OPC[t]  + e[t] \tabularnewline
 \tabularnewline
\hline
\end{tabular}
%Source: https://freestatistics.org/blog/index.php?pk=310551&T=1

[TABLE]
[ROW][C]Multiple Linear Regression - Estimated Regression Equation[/C][/ROW]
[ROW][C]VKP[t] =  +  69576.2 +  0.0553903Inw[t] +  9.74362Ink[t] -17.6232OPC[t]  + e[t][/C][/ROW]
[ROW][C][/C][/ROW]
[/TABLE]
Source: https://freestatistics.org/blog/index.php?pk=310551&T=1

Globally Unique Identifier (entire table): ba.freestatistics.org/blog/index.php?pk=310551&T=1

As an alternative you can also use a QR Code:  

The GUIDs for individual cells are displayed in the table below:

Multiple Linear Regression - Estimated Regression Equation
VKP[t] = + 69576.2 + 0.0553903Inw[t] + 9.74362Ink[t] -17.6232OPC[t] + e[t]


Multiple Linear Regression - Ordinary Least Squares
VariableParameterS.D.T-STATH0: parameter = 02-tail p-value1-tail p-value
(Intercept)+6.958e+04 4.963e+04+1.4020e+00 0.1656 0.08281
Inw+0.05539 0.0528+1.0490e+00 0.298 0.149
Ink+9.744 2.116+4.6040e+00 1.941e-05 9.703e-06
OPC-17.62 14.5-1.2150e+00 0.2287 0.1143

\begin{tabular}{lllllllll}
\hline
Multiple Linear Regression - Ordinary Least Squares \tabularnewline
Variable & Parameter & S.D. & T-STATH0: parameter = 0 & 2-tail p-value & 1-tail p-value \tabularnewline
(Intercept) & +6.958e+04 &  4.963e+04 & +1.4020e+00 &  0.1656 &  0.08281 \tabularnewline
Inw & +0.05539 &  0.0528 & +1.0490e+00 &  0.298 &  0.149 \tabularnewline
Ink & +9.744 &  2.116 & +4.6040e+00 &  1.941e-05 &  9.703e-06 \tabularnewline
OPC & -17.62 &  14.5 & -1.2150e+00 &  0.2287 &  0.1143 \tabularnewline
\hline
\end{tabular}
%Source: https://freestatistics.org/blog/index.php?pk=310551&T=2

[TABLE]
[ROW][C]Multiple Linear Regression - Ordinary Least Squares[/C][/ROW]
[ROW][C]Variable[/C][C]Parameter[/C][C]S.D.[/C][C]T-STATH0: parameter = 0[/C][C]2-tail p-value[/C][C]1-tail p-value[/C][/ROW]
[ROW][C](Intercept)[/C][C]+6.958e+04[/C][C] 4.963e+04[/C][C]+1.4020e+00[/C][C] 0.1656[/C][C] 0.08281[/C][/ROW]
[ROW][C]Inw[/C][C]+0.05539[/C][C] 0.0528[/C][C]+1.0490e+00[/C][C] 0.298[/C][C] 0.149[/C][/ROW]
[ROW][C]Ink[/C][C]+9.744[/C][C] 2.116[/C][C]+4.6040e+00[/C][C] 1.941e-05[/C][C] 9.703e-06[/C][/ROW]
[ROW][C]OPC[/C][C]-17.62[/C][C] 14.5[/C][C]-1.2150e+00[/C][C] 0.2287[/C][C] 0.1143[/C][/ROW]
[/TABLE]
Source: https://freestatistics.org/blog/index.php?pk=310551&T=2

Globally Unique Identifier (entire table): ba.freestatistics.org/blog/index.php?pk=310551&T=2

As an alternative you can also use a QR Code:  

The GUIDs for individual cells are displayed in the table below:

Multiple Linear Regression - Ordinary Least Squares
VariableParameterS.D.T-STATH0: parameter = 02-tail p-value1-tail p-value
(Intercept)+6.958e+04 4.963e+04+1.4020e+00 0.1656 0.08281
Inw+0.05539 0.0528+1.0490e+00 0.298 0.149
Ink+9.744 2.116+4.6040e+00 1.941e-05 9.703e-06
OPC-17.62 14.5-1.2150e+00 0.2287 0.1143


Multiple Linear Regression - Regression Statistics
Multiple R 0.5885
R-squared 0.3464
Adjusted R-squared 0.3167
F-TEST (value) 11.66
F-TEST (DF numerator)3
F-TEST (DF denominator)66
p-value 3.191e-06
Multiple Linear Regression - Residual Statistics
Residual Standard Deviation 2.532e+04
Sum Squared Residuals 4.231e+10

\begin{tabular}{lllllllll}
\hline
Multiple Linear Regression - Regression Statistics \tabularnewline
Multiple R &  0.5885 \tabularnewline
R-squared &  0.3464 \tabularnewline
Adjusted R-squared &  0.3167 \tabularnewline
F-TEST (value) &  11.66 \tabularnewline
F-TEST (DF numerator) & 3 \tabularnewline
F-TEST (DF denominator) & 66 \tabularnewline
p-value &  3.191e-06 \tabularnewline
Multiple Linear Regression - Residual Statistics \tabularnewline
Residual Standard Deviation &  2.532e+04 \tabularnewline
Sum Squared Residuals &  4.231e+10 \tabularnewline
\hline
\end{tabular}
%Source: https://freestatistics.org/blog/index.php?pk=310551&T=3

[TABLE]
[ROW][C]Multiple Linear Regression - Regression Statistics[/C][/ROW]
[ROW][C]Multiple R[/C][C] 0.5885[/C][/ROW]
[ROW][C]R-squared[/C][C] 0.3464[/C][/ROW]
[ROW][C]Adjusted R-squared[/C][C] 0.3167[/C][/ROW]
[ROW][C]F-TEST (value)[/C][C] 11.66[/C][/ROW]
[ROW][C]F-TEST (DF numerator)[/C][C]3[/C][/ROW]
[ROW][C]F-TEST (DF denominator)[/C][C]66[/C][/ROW]
[ROW][C]p-value[/C][C] 3.191e-06[/C][/ROW]
[ROW][C]Multiple Linear Regression - Residual Statistics[/C][/ROW]
[ROW][C]Residual Standard Deviation[/C][C] 2.532e+04[/C][/ROW]
[ROW][C]Sum Squared Residuals[/C][C] 4.231e+10[/C][/ROW]
[/TABLE]
Source: https://freestatistics.org/blog/index.php?pk=310551&T=3

Globally Unique Identifier (entire table): ba.freestatistics.org/blog/index.php?pk=310551&T=3

As an alternative you can also use a QR Code:  

The GUIDs for individual cells are displayed in the table below:

Multiple Linear Regression - Regression Statistics
Multiple R 0.5885
R-squared 0.3464
Adjusted R-squared 0.3167
F-TEST (value) 11.66
F-TEST (DF numerator)3
F-TEST (DF denominator)66
p-value 3.191e-06
Multiple Linear Regression - Residual Statistics
Residual Standard Deviation 2.532e+04
Sum Squared Residuals 4.231e+10


Menu of Residual Diagnostics
DescriptionLink
HistogramCompute
Central TendencyCompute
QQ PlotCompute
Kernel Density PlotCompute
Skewness/Kurtosis TestCompute
Skewness-Kurtosis PlotCompute
Harrell-Davis PlotCompute
Bootstrap Plot -- Central TendencyCompute
Blocked Bootstrap Plot -- Central TendencyCompute
(Partial) Autocorrelation PlotCompute
Spectral AnalysisCompute
Tukey lambda PPCC PlotCompute
Box-Cox Normality PlotCompute
Summary StatisticsCompute

\begin{tabular}{lllllllll}
\hline
Menu of Residual Diagnostics \tabularnewline
Description & Link \tabularnewline
Histogram & Compute \tabularnewline
Central Tendency & Compute \tabularnewline
QQ Plot & Compute \tabularnewline
Kernel Density Plot & Compute \tabularnewline
Skewness/Kurtosis Test & Compute \tabularnewline
Skewness-Kurtosis Plot & Compute \tabularnewline
Harrell-Davis Plot & Compute \tabularnewline
Bootstrap Plot -- Central Tendency & Compute \tabularnewline
Blocked Bootstrap Plot -- Central Tendency & Compute \tabularnewline
(Partial) Autocorrelation Plot & Compute \tabularnewline
Spectral Analysis & Compute \tabularnewline
Tukey lambda PPCC Plot & Compute \tabularnewline
Box-Cox Normality Plot & Compute \tabularnewline
Summary Statistics & Compute \tabularnewline
\hline
\end{tabular}
%Source: https://freestatistics.org/blog/index.php?pk=310551&T=4

[TABLE]
[ROW][C]Menu of Residual Diagnostics[/C][/ROW]
[ROW][C]Description[/C][C]Link[/C][/ROW]
[ROW][C]Histogram[/C][C]Compute[/C][/ROW]
[ROW][C]Central Tendency[/C][C]Compute[/C][/ROW]
[ROW][C]QQ Plot[/C][C]Compute[/C][/ROW]
[ROW][C]Kernel Density Plot[/C][C]Compute[/C][/ROW]
[ROW][C]Skewness/Kurtosis Test[/C][C]Compute[/C][/ROW]
[ROW][C]Skewness-Kurtosis Plot[/C][C]Compute[/C][/ROW]
[ROW][C]Harrell-Davis Plot[/C][C]Compute[/C][/ROW]
[ROW][C]Bootstrap Plot -- Central Tendency[/C][C]Compute[/C][/ROW]
[ROW][C]Blocked Bootstrap Plot -- Central Tendency[/C][C]Compute[/C][/ROW]
[ROW][C](Partial) Autocorrelation Plot[/C][C]Compute[/C][/ROW]
[ROW][C]Spectral Analysis[/C][C]Compute[/C][/ROW]
[ROW][C]Tukey lambda PPCC Plot[/C][C]Compute[/C][/ROW]
[ROW][C]Box-Cox Normality Plot[/C][C]Compute[/C][/ROW]
[ROW][C]Summary Statistics[/C][C]Compute[/C][/ROW]
[/TABLE]
Source: https://freestatistics.org/blog/index.php?pk=310551&T=4

Globally Unique Identifier (entire table): ba.freestatistics.org/blog/index.php?pk=310551&T=4

As an alternative you can also use a QR Code:  

The GUIDs for individual cells are displayed in the table below:

Menu of Residual Diagnostics
DescriptionLink
HistogramCompute
Central TendencyCompute
QQ PlotCompute
Kernel Density PlotCompute
Skewness/Kurtosis TestCompute
Skewness-Kurtosis PlotCompute
Harrell-Davis PlotCompute
Bootstrap Plot -- Central TendencyCompute
Blocked Bootstrap Plot -- Central TendencyCompute
(Partial) Autocorrelation PlotCompute
Spectral AnalysisCompute
Tukey lambda PPCC PlotCompute
Box-Cox Normality PlotCompute
Summary StatisticsCompute


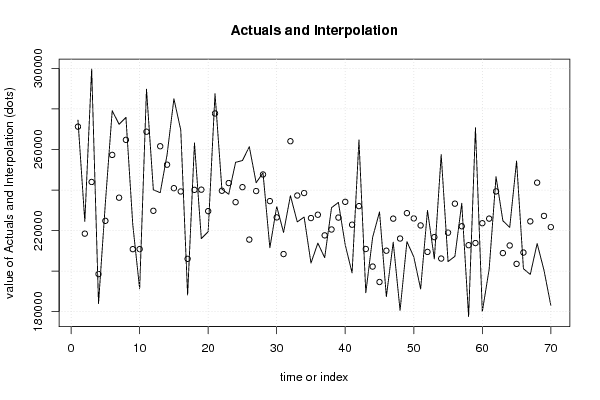
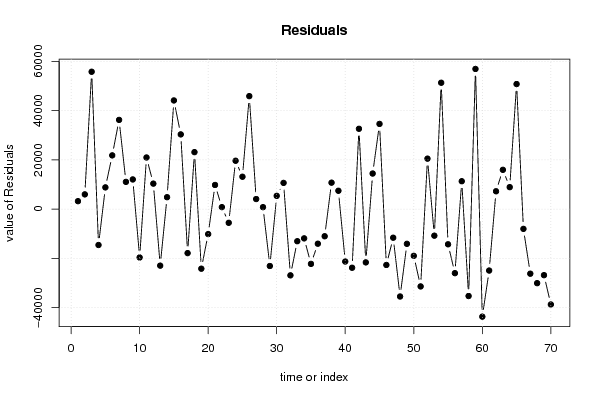
Multiple Linear Regression - Actuals, Interpolation, and Residuals
Time or IndexActualsInterpolationForecastResidualsPrediction Error
1 2.745e+05 2.713e+05 3245
2 2.245e+05 2.185e+05 6000
3 2.997e+05 2.44e+05 5.577e+04
4 1.84e+05 1.985e+05-1.454e+04
5 2.336e+05 2.248e+05 8837
6 2.791e+05 2.573e+05 2.183e+04
7 2.724e+05 2.362e+05 3.623e+04
8 2.758e+05 2.648e+05 1.107e+04
9 2.229e+05 2.108e+05 1.206e+04
10 1.912e+05 2.108e+05-1.961e+04
11 2.897e+05 2.688e+05 2.097e+04
12 2.401e+05 2.297e+05 1.037e+04
13 2.387e+05 2.616e+05-2.293e+04
14 2.573e+05 2.525e+05 4858
15 2.85e+05 2.409e+05 4.412e+04
16 2.696e+05 2.393e+05 3.034e+04
17 1.882e+05 2.06e+05-1.784e+04
18 2.632e+05 2.401e+05 2.315e+04
19 2.16e+05 2.402e+05-2.417e+04
20 2.195e+05 2.296e+05-1.012e+04
21 2.876e+05 2.778e+05 9817
22 2.404e+05 2.396e+05 820.1
23 2.379e+05 2.434e+05-5533
24 2.536e+05 2.34e+05 1.965e+04
25 2.546e+05 2.414e+05 1.316e+04
26 2.614e+05 2.155e+05 4.587e+04
27 2.436e+05 2.395e+05 4107
28 2.485e+05 2.477e+05 811.6
29 2.115e+05 2.345e+05-2.307e+04
30 2.319e+05 2.265e+05 5404
31 2.191e+05 2.084e+05 1.066e+04
32 2.372e+05 2.641e+05-2.687e+04
33 2.243e+05 2.373e+05-1.301e+04
34 2.266e+05 2.385e+05-1.186e+04
35 2.039e+05 2.262e+05-2.222e+04
36 2.138e+05 2.278e+05-1.403e+04
37 2.066e+05 2.176e+05-1.1e+04
38 2.313e+05 2.205e+05 1.075e+04
39 2.339e+05 2.264e+05 7468
40 2.129e+05 2.342e+05-2.126e+04
41 1.991e+05 2.229e+05-2.378e+04
42 2.647e+05 2.321e+05 3.262e+04
43 1.893e+05 2.109e+05-2.161e+04
44 2.167e+05 2.022e+05 1.446e+04
45 2.292e+05 1.946e+05 3.46e+04
46 1.874e+05 2.1e+05-2.265e+04
47 2.143e+05 2.259e+05-1.16e+04
48 1.806e+05 2.161e+05-3.545e+04
49 2.145e+05 2.286e+05-1.407e+04
50 2.07e+05 2.26e+05-1.896e+04
51 1.912e+05 2.225e+05-3.136e+04
52 2.299e+05 2.094e+05 2.05e+04
53 2.06e+05 2.167e+05-1.076e+04
54 2.575e+05 2.062e+05 5.131e+04
55 2.047e+05 2.189e+05-1.427e+04
56 2.073e+05 2.332e+05-2.598e+04
57 2.334e+05 2.221e+05 1.134e+04
58 1.775e+05 2.128e+05-3.526e+04
59 2.707e+05 2.138e+05 5.691e+04
60 1.8e+05 2.236e+05-4.363e+04
61 2.01e+05 2.259e+05-2.492e+04
62 2.466e+05 2.393e+05 7258
63 2.248e+05 2.089e+05 1.597e+04
64 2.216e+05 2.126e+05 8938
65 2.543e+05 2.035e+05 5.078e+04
66 2.011e+05 2.091e+05-7999
67 1.983e+05 2.245e+05-2.619e+04
68 2.136e+05 2.436e+05-3.004e+04
69 2.004e+05 2.272e+05-2.678e+04
70 1.83e+05 2.217e+05-3.869e+04

\begin{tabular}{lllllllll}
\hline
Multiple Linear Regression - Actuals, Interpolation, and Residuals \tabularnewline
Time or Index & Actuals & InterpolationForecast & ResidualsPrediction Error \tabularnewline
1 &  2.745e+05 &  2.713e+05 &  3245 \tabularnewline
2 &  2.245e+05 &  2.185e+05 &  6000 \tabularnewline
3 &  2.997e+05 &  2.44e+05 &  5.577e+04 \tabularnewline
4 &  1.84e+05 &  1.985e+05 & -1.454e+04 \tabularnewline
5 &  2.336e+05 &  2.248e+05 &  8837 \tabularnewline
6 &  2.791e+05 &  2.573e+05 &  2.183e+04 \tabularnewline
7 &  2.724e+05 &  2.362e+05 &  3.623e+04 \tabularnewline
8 &  2.758e+05 &  2.648e+05 &  1.107e+04 \tabularnewline
9 &  2.229e+05 &  2.108e+05 &  1.206e+04 \tabularnewline
10 &  1.912e+05 &  2.108e+05 & -1.961e+04 \tabularnewline
11 &  2.897e+05 &  2.688e+05 &  2.097e+04 \tabularnewline
12 &  2.401e+05 &  2.297e+05 &  1.037e+04 \tabularnewline
13 &  2.387e+05 &  2.616e+05 & -2.293e+04 \tabularnewline
14 &  2.573e+05 &  2.525e+05 &  4858 \tabularnewline
15 &  2.85e+05 &  2.409e+05 &  4.412e+04 \tabularnewline
16 &  2.696e+05 &  2.393e+05 &  3.034e+04 \tabularnewline
17 &  1.882e+05 &  2.06e+05 & -1.784e+04 \tabularnewline
18 &  2.632e+05 &  2.401e+05 &  2.315e+04 \tabularnewline
19 &  2.16e+05 &  2.402e+05 & -2.417e+04 \tabularnewline
20 &  2.195e+05 &  2.296e+05 & -1.012e+04 \tabularnewline
21 &  2.876e+05 &  2.778e+05 &  9817 \tabularnewline
22 &  2.404e+05 &  2.396e+05 &  820.1 \tabularnewline
23 &  2.379e+05 &  2.434e+05 & -5533 \tabularnewline
24 &  2.536e+05 &  2.34e+05 &  1.965e+04 \tabularnewline
25 &  2.546e+05 &  2.414e+05 &  1.316e+04 \tabularnewline
26 &  2.614e+05 &  2.155e+05 &  4.587e+04 \tabularnewline
27 &  2.436e+05 &  2.395e+05 &  4107 \tabularnewline
28 &  2.485e+05 &  2.477e+05 &  811.6 \tabularnewline
29 &  2.115e+05 &  2.345e+05 & -2.307e+04 \tabularnewline
30 &  2.319e+05 &  2.265e+05 &  5404 \tabularnewline
31 &  2.191e+05 &  2.084e+05 &  1.066e+04 \tabularnewline
32 &  2.372e+05 &  2.641e+05 & -2.687e+04 \tabularnewline
33 &  2.243e+05 &  2.373e+05 & -1.301e+04 \tabularnewline
34 &  2.266e+05 &  2.385e+05 & -1.186e+04 \tabularnewline
35 &  2.039e+05 &  2.262e+05 & -2.222e+04 \tabularnewline
36 &  2.138e+05 &  2.278e+05 & -1.403e+04 \tabularnewline
37 &  2.066e+05 &  2.176e+05 & -1.1e+04 \tabularnewline
38 &  2.313e+05 &  2.205e+05 &  1.075e+04 \tabularnewline
39 &  2.339e+05 &  2.264e+05 &  7468 \tabularnewline
40 &  2.129e+05 &  2.342e+05 & -2.126e+04 \tabularnewline
41 &  1.991e+05 &  2.229e+05 & -2.378e+04 \tabularnewline
42 &  2.647e+05 &  2.321e+05 &  3.262e+04 \tabularnewline
43 &  1.893e+05 &  2.109e+05 & -2.161e+04 \tabularnewline
44 &  2.167e+05 &  2.022e+05 &  1.446e+04 \tabularnewline
45 &  2.292e+05 &  1.946e+05 &  3.46e+04 \tabularnewline
46 &  1.874e+05 &  2.1e+05 & -2.265e+04 \tabularnewline
47 &  2.143e+05 &  2.259e+05 & -1.16e+04 \tabularnewline
48 &  1.806e+05 &  2.161e+05 & -3.545e+04 \tabularnewline
49 &  2.145e+05 &  2.286e+05 & -1.407e+04 \tabularnewline
50 &  2.07e+05 &  2.26e+05 & -1.896e+04 \tabularnewline
51 &  1.912e+05 &  2.225e+05 & -3.136e+04 \tabularnewline
52 &  2.299e+05 &  2.094e+05 &  2.05e+04 \tabularnewline
53 &  2.06e+05 &  2.167e+05 & -1.076e+04 \tabularnewline
54 &  2.575e+05 &  2.062e+05 &  5.131e+04 \tabularnewline
55 &  2.047e+05 &  2.189e+05 & -1.427e+04 \tabularnewline
56 &  2.073e+05 &  2.332e+05 & -2.598e+04 \tabularnewline
57 &  2.334e+05 &  2.221e+05 &  1.134e+04 \tabularnewline
58 &  1.775e+05 &  2.128e+05 & -3.526e+04 \tabularnewline
59 &  2.707e+05 &  2.138e+05 &  5.691e+04 \tabularnewline
60 &  1.8e+05 &  2.236e+05 & -4.363e+04 \tabularnewline
61 &  2.01e+05 &  2.259e+05 & -2.492e+04 \tabularnewline
62 &  2.466e+05 &  2.393e+05 &  7258 \tabularnewline
63 &  2.248e+05 &  2.089e+05 &  1.597e+04 \tabularnewline
64 &  2.216e+05 &  2.126e+05 &  8938 \tabularnewline
65 &  2.543e+05 &  2.035e+05 &  5.078e+04 \tabularnewline
66 &  2.011e+05 &  2.091e+05 & -7999 \tabularnewline
67 &  1.983e+05 &  2.245e+05 & -2.619e+04 \tabularnewline
68 &  2.136e+05 &  2.436e+05 & -3.004e+04 \tabularnewline
69 &  2.004e+05 &  2.272e+05 & -2.678e+04 \tabularnewline
70 &  1.83e+05 &  2.217e+05 & -3.869e+04 \tabularnewline
\hline
\end{tabular}
%Source: https://freestatistics.org/blog/index.php?pk=310551&T=5

[TABLE]
[ROW][C]Multiple Linear Regression - Actuals, Interpolation, and Residuals[/C][/ROW]
[ROW][C]Time or Index[/C][C]Actuals[/C][C]InterpolationForecast[/C][C]ResidualsPrediction Error[/C][/ROW]
[ROW][C]1[/C][C] 2.745e+05[/C][C] 2.713e+05[/C][C] 3245[/C][/ROW]
[ROW][C]2[/C][C] 2.245e+05[/C][C] 2.185e+05[/C][C] 6000[/C][/ROW]
[ROW][C]3[/C][C] 2.997e+05[/C][C] 2.44e+05[/C][C] 5.577e+04[/C][/ROW]
[ROW][C]4[/C][C] 1.84e+05[/C][C] 1.985e+05[/C][C]-1.454e+04[/C][/ROW]
[ROW][C]5[/C][C] 2.336e+05[/C][C] 2.248e+05[/C][C] 8837[/C][/ROW]
[ROW][C]6[/C][C] 2.791e+05[/C][C] 2.573e+05[/C][C] 2.183e+04[/C][/ROW]
[ROW][C]7[/C][C] 2.724e+05[/C][C] 2.362e+05[/C][C] 3.623e+04[/C][/ROW]
[ROW][C]8[/C][C] 2.758e+05[/C][C] 2.648e+05[/C][C] 1.107e+04[/C][/ROW]
[ROW][C]9[/C][C] 2.229e+05[/C][C] 2.108e+05[/C][C] 1.206e+04[/C][/ROW]
[ROW][C]10[/C][C] 1.912e+05[/C][C] 2.108e+05[/C][C]-1.961e+04[/C][/ROW]
[ROW][C]11[/C][C] 2.897e+05[/C][C] 2.688e+05[/C][C] 2.097e+04[/C][/ROW]
[ROW][C]12[/C][C] 2.401e+05[/C][C] 2.297e+05[/C][C] 1.037e+04[/C][/ROW]
[ROW][C]13[/C][C] 2.387e+05[/C][C] 2.616e+05[/C][C]-2.293e+04[/C][/ROW]
[ROW][C]14[/C][C] 2.573e+05[/C][C] 2.525e+05[/C][C] 4858[/C][/ROW]
[ROW][C]15[/C][C] 2.85e+05[/C][C] 2.409e+05[/C][C] 4.412e+04[/C][/ROW]
[ROW][C]16[/C][C] 2.696e+05[/C][C] 2.393e+05[/C][C] 3.034e+04[/C][/ROW]
[ROW][C]17[/C][C] 1.882e+05[/C][C] 2.06e+05[/C][C]-1.784e+04[/C][/ROW]
[ROW][C]18[/C][C] 2.632e+05[/C][C] 2.401e+05[/C][C] 2.315e+04[/C][/ROW]
[ROW][C]19[/C][C] 2.16e+05[/C][C] 2.402e+05[/C][C]-2.417e+04[/C][/ROW]
[ROW][C]20[/C][C] 2.195e+05[/C][C] 2.296e+05[/C][C]-1.012e+04[/C][/ROW]
[ROW][C]21[/C][C] 2.876e+05[/C][C] 2.778e+05[/C][C] 9817[/C][/ROW]
[ROW][C]22[/C][C] 2.404e+05[/C][C] 2.396e+05[/C][C] 820.1[/C][/ROW]
[ROW][C]23[/C][C] 2.379e+05[/C][C] 2.434e+05[/C][C]-5533[/C][/ROW]
[ROW][C]24[/C][C] 2.536e+05[/C][C] 2.34e+05[/C][C] 1.965e+04[/C][/ROW]
[ROW][C]25[/C][C] 2.546e+05[/C][C] 2.414e+05[/C][C] 1.316e+04[/C][/ROW]
[ROW][C]26[/C][C] 2.614e+05[/C][C] 2.155e+05[/C][C] 4.587e+04[/C][/ROW]
[ROW][C]27[/C][C] 2.436e+05[/C][C] 2.395e+05[/C][C] 4107[/C][/ROW]
[ROW][C]28[/C][C] 2.485e+05[/C][C] 2.477e+05[/C][C] 811.6[/C][/ROW]
[ROW][C]29[/C][C] 2.115e+05[/C][C] 2.345e+05[/C][C]-2.307e+04[/C][/ROW]
[ROW][C]30[/C][C] 2.319e+05[/C][C] 2.265e+05[/C][C] 5404[/C][/ROW]
[ROW][C]31[/C][C] 2.191e+05[/C][C] 2.084e+05[/C][C] 1.066e+04[/C][/ROW]
[ROW][C]32[/C][C] 2.372e+05[/C][C] 2.641e+05[/C][C]-2.687e+04[/C][/ROW]
[ROW][C]33[/C][C] 2.243e+05[/C][C] 2.373e+05[/C][C]-1.301e+04[/C][/ROW]
[ROW][C]34[/C][C] 2.266e+05[/C][C] 2.385e+05[/C][C]-1.186e+04[/C][/ROW]
[ROW][C]35[/C][C] 2.039e+05[/C][C] 2.262e+05[/C][C]-2.222e+04[/C][/ROW]
[ROW][C]36[/C][C] 2.138e+05[/C][C] 2.278e+05[/C][C]-1.403e+04[/C][/ROW]
[ROW][C]37[/C][C] 2.066e+05[/C][C] 2.176e+05[/C][C]-1.1e+04[/C][/ROW]
[ROW][C]38[/C][C] 2.313e+05[/C][C] 2.205e+05[/C][C] 1.075e+04[/C][/ROW]
[ROW][C]39[/C][C] 2.339e+05[/C][C] 2.264e+05[/C][C] 7468[/C][/ROW]
[ROW][C]40[/C][C] 2.129e+05[/C][C] 2.342e+05[/C][C]-2.126e+04[/C][/ROW]
[ROW][C]41[/C][C] 1.991e+05[/C][C] 2.229e+05[/C][C]-2.378e+04[/C][/ROW]
[ROW][C]42[/C][C] 2.647e+05[/C][C] 2.321e+05[/C][C] 3.262e+04[/C][/ROW]
[ROW][C]43[/C][C] 1.893e+05[/C][C] 2.109e+05[/C][C]-2.161e+04[/C][/ROW]
[ROW][C]44[/C][C] 2.167e+05[/C][C] 2.022e+05[/C][C] 1.446e+04[/C][/ROW]
[ROW][C]45[/C][C] 2.292e+05[/C][C] 1.946e+05[/C][C] 3.46e+04[/C][/ROW]
[ROW][C]46[/C][C] 1.874e+05[/C][C] 2.1e+05[/C][C]-2.265e+04[/C][/ROW]
[ROW][C]47[/C][C] 2.143e+05[/C][C] 2.259e+05[/C][C]-1.16e+04[/C][/ROW]
[ROW][C]48[/C][C] 1.806e+05[/C][C] 2.161e+05[/C][C]-3.545e+04[/C][/ROW]
[ROW][C]49[/C][C] 2.145e+05[/C][C] 2.286e+05[/C][C]-1.407e+04[/C][/ROW]
[ROW][C]50[/C][C] 2.07e+05[/C][C] 2.26e+05[/C][C]-1.896e+04[/C][/ROW]
[ROW][C]51[/C][C] 1.912e+05[/C][C] 2.225e+05[/C][C]-3.136e+04[/C][/ROW]
[ROW][C]52[/C][C] 2.299e+05[/C][C] 2.094e+05[/C][C] 2.05e+04[/C][/ROW]
[ROW][C]53[/C][C] 2.06e+05[/C][C] 2.167e+05[/C][C]-1.076e+04[/C][/ROW]
[ROW][C]54[/C][C] 2.575e+05[/C][C] 2.062e+05[/C][C] 5.131e+04[/C][/ROW]
[ROW][C]55[/C][C] 2.047e+05[/C][C] 2.189e+05[/C][C]-1.427e+04[/C][/ROW]
[ROW][C]56[/C][C] 2.073e+05[/C][C] 2.332e+05[/C][C]-2.598e+04[/C][/ROW]
[ROW][C]57[/C][C] 2.334e+05[/C][C] 2.221e+05[/C][C] 1.134e+04[/C][/ROW]
[ROW][C]58[/C][C] 1.775e+05[/C][C] 2.128e+05[/C][C]-3.526e+04[/C][/ROW]
[ROW][C]59[/C][C] 2.707e+05[/C][C] 2.138e+05[/C][C] 5.691e+04[/C][/ROW]
[ROW][C]60[/C][C] 1.8e+05[/C][C] 2.236e+05[/C][C]-4.363e+04[/C][/ROW]
[ROW][C]61[/C][C] 2.01e+05[/C][C] 2.259e+05[/C][C]-2.492e+04[/C][/ROW]
[ROW][C]62[/C][C] 2.466e+05[/C][C] 2.393e+05[/C][C] 7258[/C][/ROW]
[ROW][C]63[/C][C] 2.248e+05[/C][C] 2.089e+05[/C][C] 1.597e+04[/C][/ROW]
[ROW][C]64[/C][C] 2.216e+05[/C][C] 2.126e+05[/C][C] 8938[/C][/ROW]
[ROW][C]65[/C][C] 2.543e+05[/C][C] 2.035e+05[/C][C] 5.078e+04[/C][/ROW]
[ROW][C]66[/C][C] 2.011e+05[/C][C] 2.091e+05[/C][C]-7999[/C][/ROW]
[ROW][C]67[/C][C] 1.983e+05[/C][C] 2.245e+05[/C][C]-2.619e+04[/C][/ROW]
[ROW][C]68[/C][C] 2.136e+05[/C][C] 2.436e+05[/C][C]-3.004e+04[/C][/ROW]
[ROW][C]69[/C][C] 2.004e+05[/C][C] 2.272e+05[/C][C]-2.678e+04[/C][/ROW]
[ROW][C]70[/C][C] 1.83e+05[/C][C] 2.217e+05[/C][C]-3.869e+04[/C][/ROW]
[/TABLE]
Source: https://freestatistics.org/blog/index.php?pk=310551&T=5

Globally Unique Identifier (entire table): ba.freestatistics.org/blog/index.php?pk=310551&T=5

As an alternative you can also use a QR Code:  

The GUIDs for individual cells are displayed in the table below:

Multiple Linear Regression - Actuals, Interpolation, and Residuals
Time or IndexActualsInterpolationForecastResidualsPrediction Error
1 2.745e+05 2.713e+05 3245
2 2.245e+05 2.185e+05 6000
3 2.997e+05 2.44e+05 5.577e+04
4 1.84e+05 1.985e+05-1.454e+04
5 2.336e+05 2.248e+05 8837
6 2.791e+05 2.573e+05 2.183e+04
7 2.724e+05 2.362e+05 3.623e+04
8 2.758e+05 2.648e+05 1.107e+04
9 2.229e+05 2.108e+05 1.206e+04
10 1.912e+05 2.108e+05-1.961e+04
11 2.897e+05 2.688e+05 2.097e+04
12 2.401e+05 2.297e+05 1.037e+04
13 2.387e+05 2.616e+05-2.293e+04
14 2.573e+05 2.525e+05 4858
15 2.85e+05 2.409e+05 4.412e+04
16 2.696e+05 2.393e+05 3.034e+04
17 1.882e+05 2.06e+05-1.784e+04
18 2.632e+05 2.401e+05 2.315e+04
19 2.16e+05 2.402e+05-2.417e+04
20 2.195e+05 2.296e+05-1.012e+04
21 2.876e+05 2.778e+05 9817
22 2.404e+05 2.396e+05 820.1
23 2.379e+05 2.434e+05-5533
24 2.536e+05 2.34e+05 1.965e+04
25 2.546e+05 2.414e+05 1.316e+04
26 2.614e+05 2.155e+05 4.587e+04
27 2.436e+05 2.395e+05 4107
28 2.485e+05 2.477e+05 811.6
29 2.115e+05 2.345e+05-2.307e+04
30 2.319e+05 2.265e+05 5404
31 2.191e+05 2.084e+05 1.066e+04
32 2.372e+05 2.641e+05-2.687e+04
33 2.243e+05 2.373e+05-1.301e+04
34 2.266e+05 2.385e+05-1.186e+04
35 2.039e+05 2.262e+05-2.222e+04
36 2.138e+05 2.278e+05-1.403e+04
37 2.066e+05 2.176e+05-1.1e+04
38 2.313e+05 2.205e+05 1.075e+04
39 2.339e+05 2.264e+05 7468
40 2.129e+05 2.342e+05-2.126e+04
41 1.991e+05 2.229e+05-2.378e+04
42 2.647e+05 2.321e+05 3.262e+04
43 1.893e+05 2.109e+05-2.161e+04
44 2.167e+05 2.022e+05 1.446e+04
45 2.292e+05 1.946e+05 3.46e+04
46 1.874e+05 2.1e+05-2.265e+04
47 2.143e+05 2.259e+05-1.16e+04
48 1.806e+05 2.161e+05-3.545e+04
49 2.145e+05 2.286e+05-1.407e+04
50 2.07e+05 2.26e+05-1.896e+04
51 1.912e+05 2.225e+05-3.136e+04
52 2.299e+05 2.094e+05 2.05e+04
53 2.06e+05 2.167e+05-1.076e+04
54 2.575e+05 2.062e+05 5.131e+04
55 2.047e+05 2.189e+05-1.427e+04
56 2.073e+05 2.332e+05-2.598e+04
57 2.334e+05 2.221e+05 1.134e+04
58 1.775e+05 2.128e+05-3.526e+04
59 2.707e+05 2.138e+05 5.691e+04
60 1.8e+05 2.236e+05-4.363e+04
61 2.01e+05 2.259e+05-2.492e+04
62 2.466e+05 2.393e+05 7258
63 2.248e+05 2.089e+05 1.597e+04
64 2.216e+05 2.126e+05 8938
65 2.543e+05 2.035e+05 5.078e+04
66 2.011e+05 2.091e+05-7999
67 1.983e+05 2.245e+05-2.619e+04
68 2.136e+05 2.436e+05-3.004e+04
69 2.004e+05 2.272e+05-2.678e+04
70 1.83e+05 2.217e+05-3.869e+04


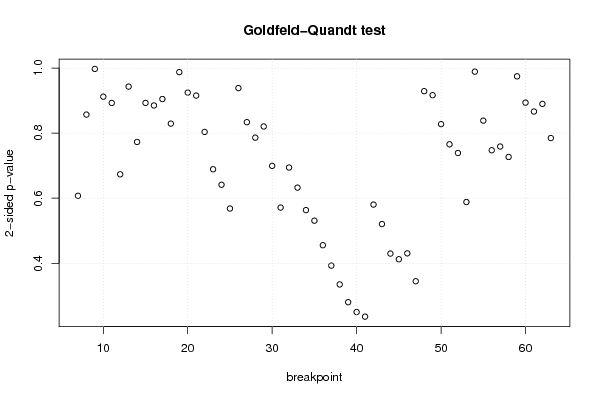
Goldfeld-Quandt test for Heteroskedasticity
p-valuesAlternative Hypothesis
breakpoint indexgreater2-sidedless
7 0.6962 0.6075 0.3038
8 0.5715 0.8569 0.4285
9 0.4986 0.9971 0.5014
10 0.544 0.9119 0.456
11 0.4463 0.8927 0.5537
12 0.3368 0.6736 0.6632
13 0.4715 0.9429 0.5285
14 0.3864 0.7729 0.6136
15 0.4464 0.8927 0.5536
16 0.4425 0.885 0.5575
17 0.4524 0.9047 0.5476
18 0.4146 0.8291 0.5854
19 0.5064 0.9873 0.4936
20 0.4623 0.9245 0.5377
21 0.4577 0.9154 0.5423
22 0.4019 0.8037 0.5981
23 0.3445 0.689 0.6555
24 0.3207 0.6414 0.6793
25 0.2842 0.5684 0.7158
26 0.4691 0.9383 0.5309
27 0.4168 0.8336 0.5832
28 0.393 0.7861 0.607
29 0.4102 0.8204 0.5898
30 0.3497 0.6994 0.6503
31 0.2857 0.5713 0.7143
32 0.3472 0.6943 0.6528
33 0.3162 0.6325 0.6838
34 0.2818 0.5636 0.7182
35 0.2655 0.531 0.7345
36 0.2278 0.4557 0.7722
37 0.1965 0.393 0.8035
38 0.1676 0.3352 0.8324
39 0.1403 0.2806 0.8597
40 0.1252 0.2504 0.8748
41 0.1181 0.2362 0.8819
42 0.2902 0.5804 0.7098
43 0.2604 0.5207 0.7396
44 0.215 0.43 0.785
45 0.2063 0.4127 0.7937
46 0.2154 0.4307 0.7846
47 0.1725 0.3449 0.8275
48 0.4644 0.9288 0.5356
49 0.4582 0.9165 0.5418
50 0.4138 0.8277 0.5862
51 0.3828 0.7657 0.6172
52 0.3695 0.739 0.6305
53 0.2942 0.5883 0.7058
54 0.5056 0.9888 0.4944
55 0.4192 0.8383 0.5808
56 0.3737 0.7474 0.6263
57 0.3794 0.7588 0.6206
58 0.3634 0.7268 0.6366
59 0.4872 0.9744 0.5128
60 0.4468 0.8935 0.5532
61 0.4332 0.8663 0.5668
62 0.5551 0.8898 0.4449
63 0.3925 0.7849 0.6075

\begin{tabular}{lllllllll}
\hline
Goldfeld-Quandt test for Heteroskedasticity \tabularnewline
p-values & Alternative Hypothesis \tabularnewline
breakpoint index & greater & 2-sided & less \tabularnewline
7 &  0.6962 &  0.6075 &  0.3038 \tabularnewline
8 &  0.5715 &  0.8569 &  0.4285 \tabularnewline
9 &  0.4986 &  0.9971 &  0.5014 \tabularnewline
10 &  0.544 &  0.9119 &  0.456 \tabularnewline
11 &  0.4463 &  0.8927 &  0.5537 \tabularnewline
12 &  0.3368 &  0.6736 &  0.6632 \tabularnewline
13 &  0.4715 &  0.9429 &  0.5285 \tabularnewline
14 &  0.3864 &  0.7729 &  0.6136 \tabularnewline
15 &  0.4464 &  0.8927 &  0.5536 \tabularnewline
16 &  0.4425 &  0.885 &  0.5575 \tabularnewline
17 &  0.4524 &  0.9047 &  0.5476 \tabularnewline
18 &  0.4146 &  0.8291 &  0.5854 \tabularnewline
19 &  0.5064 &  0.9873 &  0.4936 \tabularnewline
20 &  0.4623 &  0.9245 &  0.5377 \tabularnewline
21 &  0.4577 &  0.9154 &  0.5423 \tabularnewline
22 &  0.4019 &  0.8037 &  0.5981 \tabularnewline
23 &  0.3445 &  0.689 &  0.6555 \tabularnewline
24 &  0.3207 &  0.6414 &  0.6793 \tabularnewline
25 &  0.2842 &  0.5684 &  0.7158 \tabularnewline
26 &  0.4691 &  0.9383 &  0.5309 \tabularnewline
27 &  0.4168 &  0.8336 &  0.5832 \tabularnewline
28 &  0.393 &  0.7861 &  0.607 \tabularnewline
29 &  0.4102 &  0.8204 &  0.5898 \tabularnewline
30 &  0.3497 &  0.6994 &  0.6503 \tabularnewline
31 &  0.2857 &  0.5713 &  0.7143 \tabularnewline
32 &  0.3472 &  0.6943 &  0.6528 \tabularnewline
33 &  0.3162 &  0.6325 &  0.6838 \tabularnewline
34 &  0.2818 &  0.5636 &  0.7182 \tabularnewline
35 &  0.2655 &  0.531 &  0.7345 \tabularnewline
36 &  0.2278 &  0.4557 &  0.7722 \tabularnewline
37 &  0.1965 &  0.393 &  0.8035 \tabularnewline
38 &  0.1676 &  0.3352 &  0.8324 \tabularnewline
39 &  0.1403 &  0.2806 &  0.8597 \tabularnewline
40 &  0.1252 &  0.2504 &  0.8748 \tabularnewline
41 &  0.1181 &  0.2362 &  0.8819 \tabularnewline
42 &  0.2902 &  0.5804 &  0.7098 \tabularnewline
43 &  0.2604 &  0.5207 &  0.7396 \tabularnewline
44 &  0.215 &  0.43 &  0.785 \tabularnewline
45 &  0.2063 &  0.4127 &  0.7937 \tabularnewline
46 &  0.2154 &  0.4307 &  0.7846 \tabularnewline
47 &  0.1725 &  0.3449 &  0.8275 \tabularnewline
48 &  0.4644 &  0.9288 &  0.5356 \tabularnewline
49 &  0.4582 &  0.9165 &  0.5418 \tabularnewline
50 &  0.4138 &  0.8277 &  0.5862 \tabularnewline
51 &  0.3828 &  0.7657 &  0.6172 \tabularnewline
52 &  0.3695 &  0.739 &  0.6305 \tabularnewline
53 &  0.2942 &  0.5883 &  0.7058 \tabularnewline
54 &  0.5056 &  0.9888 &  0.4944 \tabularnewline
55 &  0.4192 &  0.8383 &  0.5808 \tabularnewline
56 &  0.3737 &  0.7474 &  0.6263 \tabularnewline
57 &  0.3794 &  0.7588 &  0.6206 \tabularnewline
58 &  0.3634 &  0.7268 &  0.6366 \tabularnewline
59 &  0.4872 &  0.9744 &  0.5128 \tabularnewline
60 &  0.4468 &  0.8935 &  0.5532 \tabularnewline
61 &  0.4332 &  0.8663 &  0.5668 \tabularnewline
62 &  0.5551 &  0.8898 &  0.4449 \tabularnewline
63 &  0.3925 &  0.7849 &  0.6075 \tabularnewline
\hline
\end{tabular}
%Source: https://freestatistics.org/blog/index.php?pk=310551&T=6

[TABLE]
[ROW][C]Goldfeld-Quandt test for Heteroskedasticity[/C][/ROW]
[ROW][C]p-values[/C][C]Alternative Hypothesis[/C][/ROW]
[ROW][C]breakpoint index[/C][C]greater[/C][C]2-sided[/C][C]less[/C][/ROW]
[ROW][C]7[/C][C] 0.6962[/C][C] 0.6075[/C][C] 0.3038[/C][/ROW]
[ROW][C]8[/C][C] 0.5715[/C][C] 0.8569[/C][C] 0.4285[/C][/ROW]
[ROW][C]9[/C][C] 0.4986[/C][C] 0.9971[/C][C] 0.5014[/C][/ROW]
[ROW][C]10[/C][C] 0.544[/C][C] 0.9119[/C][C] 0.456[/C][/ROW]
[ROW][C]11[/C][C] 0.4463[/C][C] 0.8927[/C][C] 0.5537[/C][/ROW]
[ROW][C]12[/C][C] 0.3368[/C][C] 0.6736[/C][C] 0.6632[/C][/ROW]
[ROW][C]13[/C][C] 0.4715[/C][C] 0.9429[/C][C] 0.5285[/C][/ROW]
[ROW][C]14[/C][C] 0.3864[/C][C] 0.7729[/C][C] 0.6136[/C][/ROW]
[ROW][C]15[/C][C] 0.4464[/C][C] 0.8927[/C][C] 0.5536[/C][/ROW]
[ROW][C]16[/C][C] 0.4425[/C][C] 0.885[/C][C] 0.5575[/C][/ROW]
[ROW][C]17[/C][C] 0.4524[/C][C] 0.9047[/C][C] 0.5476[/C][/ROW]
[ROW][C]18[/C][C] 0.4146[/C][C] 0.8291[/C][C] 0.5854[/C][/ROW]
[ROW][C]19[/C][C] 0.5064[/C][C] 0.9873[/C][C] 0.4936[/C][/ROW]
[ROW][C]20[/C][C] 0.4623[/C][C] 0.9245[/C][C] 0.5377[/C][/ROW]
[ROW][C]21[/C][C] 0.4577[/C][C] 0.9154[/C][C] 0.5423[/C][/ROW]
[ROW][C]22[/C][C] 0.4019[/C][C] 0.8037[/C][C] 0.5981[/C][/ROW]
[ROW][C]23[/C][C] 0.3445[/C][C] 0.689[/C][C] 0.6555[/C][/ROW]
[ROW][C]24[/C][C] 0.3207[/C][C] 0.6414[/C][C] 0.6793[/C][/ROW]
[ROW][C]25[/C][C] 0.2842[/C][C] 0.5684[/C][C] 0.7158[/C][/ROW]
[ROW][C]26[/C][C] 0.4691[/C][C] 0.9383[/C][C] 0.5309[/C][/ROW]
[ROW][C]27[/C][C] 0.4168[/C][C] 0.8336[/C][C] 0.5832[/C][/ROW]
[ROW][C]28[/C][C] 0.393[/C][C] 0.7861[/C][C] 0.607[/C][/ROW]
[ROW][C]29[/C][C] 0.4102[/C][C] 0.8204[/C][C] 0.5898[/C][/ROW]
[ROW][C]30[/C][C] 0.3497[/C][C] 0.6994[/C][C] 0.6503[/C][/ROW]
[ROW][C]31[/C][C] 0.2857[/C][C] 0.5713[/C][C] 0.7143[/C][/ROW]
[ROW][C]32[/C][C] 0.3472[/C][C] 0.6943[/C][C] 0.6528[/C][/ROW]
[ROW][C]33[/C][C] 0.3162[/C][C] 0.6325[/C][C] 0.6838[/C][/ROW]
[ROW][C]34[/C][C] 0.2818[/C][C] 0.5636[/C][C] 0.7182[/C][/ROW]
[ROW][C]35[/C][C] 0.2655[/C][C] 0.531[/C][C] 0.7345[/C][/ROW]
[ROW][C]36[/C][C] 0.2278[/C][C] 0.4557[/C][C] 0.7722[/C][/ROW]
[ROW][C]37[/C][C] 0.1965[/C][C] 0.393[/C][C] 0.8035[/C][/ROW]
[ROW][C]38[/C][C] 0.1676[/C][C] 0.3352[/C][C] 0.8324[/C][/ROW]
[ROW][C]39[/C][C] 0.1403[/C][C] 0.2806[/C][C] 0.8597[/C][/ROW]
[ROW][C]40[/C][C] 0.1252[/C][C] 0.2504[/C][C] 0.8748[/C][/ROW]
[ROW][C]41[/C][C] 0.1181[/C][C] 0.2362[/C][C] 0.8819[/C][/ROW]
[ROW][C]42[/C][C] 0.2902[/C][C] 0.5804[/C][C] 0.7098[/C][/ROW]
[ROW][C]43[/C][C] 0.2604[/C][C] 0.5207[/C][C] 0.7396[/C][/ROW]
[ROW][C]44[/C][C] 0.215[/C][C] 0.43[/C][C] 0.785[/C][/ROW]
[ROW][C]45[/C][C] 0.2063[/C][C] 0.4127[/C][C] 0.7937[/C][/ROW]
[ROW][C]46[/C][C] 0.2154[/C][C] 0.4307[/C][C] 0.7846[/C][/ROW]
[ROW][C]47[/C][C] 0.1725[/C][C] 0.3449[/C][C] 0.8275[/C][/ROW]
[ROW][C]48[/C][C] 0.4644[/C][C] 0.9288[/C][C] 0.5356[/C][/ROW]
[ROW][C]49[/C][C] 0.4582[/C][C] 0.9165[/C][C] 0.5418[/C][/ROW]
[ROW][C]50[/C][C] 0.4138[/C][C] 0.8277[/C][C] 0.5862[/C][/ROW]
[ROW][C]51[/C][C] 0.3828[/C][C] 0.7657[/C][C] 0.6172[/C][/ROW]
[ROW][C]52[/C][C] 0.3695[/C][C] 0.739[/C][C] 0.6305[/C][/ROW]
[ROW][C]53[/C][C] 0.2942[/C][C] 0.5883[/C][C] 0.7058[/C][/ROW]
[ROW][C]54[/C][C] 0.5056[/C][C] 0.9888[/C][C] 0.4944[/C][/ROW]
[ROW][C]55[/C][C] 0.4192[/C][C] 0.8383[/C][C] 0.5808[/C][/ROW]
[ROW][C]56[/C][C] 0.3737[/C][C] 0.7474[/C][C] 0.6263[/C][/ROW]
[ROW][C]57[/C][C] 0.3794[/C][C] 0.7588[/C][C] 0.6206[/C][/ROW]
[ROW][C]58[/C][C] 0.3634[/C][C] 0.7268[/C][C] 0.6366[/C][/ROW]
[ROW][C]59[/C][C] 0.4872[/C][C] 0.9744[/C][C] 0.5128[/C][/ROW]
[ROW][C]60[/C][C] 0.4468[/C][C] 0.8935[/C][C] 0.5532[/C][/ROW]
[ROW][C]61[/C][C] 0.4332[/C][C] 0.8663[/C][C] 0.5668[/C][/ROW]
[ROW][C]62[/C][C] 0.5551[/C][C] 0.8898[/C][C] 0.4449[/C][/ROW]
[ROW][C]63[/C][C] 0.3925[/C][C] 0.7849[/C][C] 0.6075[/C][/ROW]
[/TABLE]
Source: https://freestatistics.org/blog/index.php?pk=310551&T=6

Globally Unique Identifier (entire table): ba.freestatistics.org/blog/index.php?pk=310551&T=6

As an alternative you can also use a QR Code:  

The GUIDs for individual cells are displayed in the table below:

Goldfeld-Quandt test for Heteroskedasticity
p-valuesAlternative Hypothesis
breakpoint indexgreater2-sidedless
7 0.6962 0.6075 0.3038
8 0.5715 0.8569 0.4285
9 0.4986 0.9971 0.5014
10 0.544 0.9119 0.456
11 0.4463 0.8927 0.5537
12 0.3368 0.6736 0.6632
13 0.4715 0.9429 0.5285
14 0.3864 0.7729 0.6136
15 0.4464 0.8927 0.5536
16 0.4425 0.885 0.5575
17 0.4524 0.9047 0.5476
18 0.4146 0.8291 0.5854
19 0.5064 0.9873 0.4936
20 0.4623 0.9245 0.5377
21 0.4577 0.9154 0.5423
22 0.4019 0.8037 0.5981
23 0.3445 0.689 0.6555
24 0.3207 0.6414 0.6793
25 0.2842 0.5684 0.7158
26 0.4691 0.9383 0.5309
27 0.4168 0.8336 0.5832
28 0.393 0.7861 0.607
29 0.4102 0.8204 0.5898
30 0.3497 0.6994 0.6503
31 0.2857 0.5713 0.7143
32 0.3472 0.6943 0.6528
33 0.3162 0.6325 0.6838
34 0.2818 0.5636 0.7182
35 0.2655 0.531 0.7345
36 0.2278 0.4557 0.7722
37 0.1965 0.393 0.8035
38 0.1676 0.3352 0.8324
39 0.1403 0.2806 0.8597
40 0.1252 0.2504 0.8748
41 0.1181 0.2362 0.8819
42 0.2902 0.5804 0.7098
43 0.2604 0.5207 0.7396
44 0.215 0.43 0.785
45 0.2063 0.4127 0.7937
46 0.2154 0.4307 0.7846
47 0.1725 0.3449 0.8275
48 0.4644 0.9288 0.5356
49 0.4582 0.9165 0.5418
50 0.4138 0.8277 0.5862
51 0.3828 0.7657 0.6172
52 0.3695 0.739 0.6305
53 0.2942 0.5883 0.7058
54 0.5056 0.9888 0.4944
55 0.4192 0.8383 0.5808
56 0.3737 0.7474 0.6263
57 0.3794 0.7588 0.6206
58 0.3634 0.7268 0.6366
59 0.4872 0.9744 0.5128
60 0.4468 0.8935 0.5532
61 0.4332 0.8663 0.5668
62 0.5551 0.8898 0.4449
63 0.3925 0.7849 0.6075


Meta Analysis of Goldfeld-Quandt test for Heteroskedasticity
Description# significant tests% significant testsOK/NOK
1% type I error level0 0OK
5% type I error level00OK
10% type I error level00OK

\begin{tabular}{lllllllll}
\hline
Meta Analysis of Goldfeld-Quandt test for Heteroskedasticity \tabularnewline
Description & # significant tests & % significant tests & OK/NOK \tabularnewline
1% type I error level & 0 &  0 & OK \tabularnewline
5% type I error level & 0 & 0 & OK \tabularnewline
10% type I error level & 0 & 0 & OK \tabularnewline
\hline
\end{tabular}
%Source: https://freestatistics.org/blog/index.php?pk=310551&T=7

[TABLE]
[ROW][C]Meta Analysis of Goldfeld-Quandt test for Heteroskedasticity[/C][/ROW]
[ROW][C]Description[/C][C]# significant tests[/C][C]% significant tests[/C][C]OK/NOK[/C][/ROW]
[ROW][C]1% type I error level[/C][C]0[/C][C] 0[/C][C]OK[/C][/ROW]
[ROW][C]5% type I error level[/C][C]0[/C][C]0[/C][C]OK[/C][/ROW]
[ROW][C]10% type I error level[/C][C]0[/C][C]0[/C][C]OK[/C][/ROW]
[/TABLE]
Source: https://freestatistics.org/blog/index.php?pk=310551&T=7

Globally Unique Identifier (entire table): ba.freestatistics.org/blog/index.php?pk=310551&T=7

As an alternative you can also use a QR Code:  

The GUIDs for individual cells are displayed in the table below:

Meta Analysis of Goldfeld-Quandt test for Heteroskedasticity
Description# significant tests% significant testsOK/NOK
1% type I error level0 0OK
5% type I error level00OK
10% type I error level00OK


Ramsey RESET F-Test for powers (2 and 3) of fitted values
> reset_test_fitted
	RESET test
data:  mylm
RESET = 3.0067, df1 = 2, df2 = 64, p-value = 0.05649
Ramsey RESET F-Test for powers (2 and 3) of regressors
> reset_test_regressors
	RESET test
data:  mylm
RESET = 1.6546, df1 = 6, df2 = 60, p-value = 0.148
Ramsey RESET F-Test for powers (2 and 3) of principal components
> reset_test_principal_components
	RESET test
data:  mylm
RESET = 0.88407, df1 = 2, df2 = 64, p-value = 0.4181

\begin{tabular}{lllllllll}
\hline
Ramsey RESET F-Test for powers (2 and 3) of fitted values \tabularnewline
> reset_test_fitted
	RESET test
data:  mylm
RESET = 3.0067, df1 = 2, df2 = 64, p-value = 0.05649
\tabularnewline Ramsey RESET F-Test for powers (2 and 3) of regressors \tabularnewline
> reset_test_regressors
	RESET test
data:  mylm
RESET = 1.6546, df1 = 6, df2 = 60, p-value = 0.148
\tabularnewline Ramsey RESET F-Test for powers (2 and 3) of principal components \tabularnewline
> reset_test_principal_components
	RESET test
data:  mylm
RESET = 0.88407, df1 = 2, df2 = 64, p-value = 0.4181
\tabularnewline \hline \end{tabular} %Source: https://freestatistics.org/blog/index.php?pk=310551&T=8

[TABLE]
[ROW][C]Ramsey RESET F-Test for powers (2 and 3) of fitted values[/C][/ROW]
[ROW][C]
> reset_test_fitted
	RESET test
data:  mylm
RESET = 3.0067, df1 = 2, df2 = 64, p-value = 0.05649
[/C][/ROW] [ROW][C]Ramsey RESET F-Test for powers (2 and 3) of regressors[/C][/ROW] [ROW][C]
> reset_test_regressors
	RESET test
data:  mylm
RESET = 1.6546, df1 = 6, df2 = 60, p-value = 0.148
[/C][/ROW] [ROW][C]Ramsey RESET F-Test for powers (2 and 3) of principal components[/C][/ROW] [ROW][C]
> reset_test_principal_components
	RESET test
data:  mylm
RESET = 0.88407, df1 = 2, df2 = 64, p-value = 0.4181
[/C][/ROW] [/TABLE] Source: https://freestatistics.org/blog/index.php?pk=310551&T=8

Globally Unique Identifier (entire table): ba.freestatistics.org/blog/index.php?pk=310551&T=8

As an alternative you can also use a QR Code:  

The GUIDs for individual cells are displayed in the table below:

Ramsey RESET F-Test for powers (2 and 3) of fitted values
> reset_test_fitted
	RESET test
data:  mylm
RESET = 3.0067, df1 = 2, df2 = 64, p-value = 0.05649
Ramsey RESET F-Test for powers (2 and 3) of regressors
> reset_test_regressors
	RESET test
data:  mylm
RESET = 1.6546, df1 = 6, df2 = 60, p-value = 0.148
Ramsey RESET F-Test for powers (2 and 3) of principal components
> reset_test_principal_components
	RESET test
data:  mylm
RESET = 0.88407, df1 = 2, df2 = 64, p-value = 0.4181


Variance Inflation Factors (Multicollinearity)
> vif
     Inw      Ink      OPC 
1.066261 1.338066 1.264394 

\begin{tabular}{lllllllll}
\hline
Variance Inflation Factors (Multicollinearity) \tabularnewline
> vif
     Inw      Ink      OPC 
1.066261 1.338066 1.264394 
\tabularnewline \hline \end{tabular} %Source: https://freestatistics.org/blog/index.php?pk=310551&T=9

[TABLE]
[ROW][C]Variance Inflation Factors (Multicollinearity)[/C][/ROW]
[ROW][C]
> vif
     Inw      Ink      OPC 
1.066261 1.338066 1.264394 
[/C][/ROW] [/TABLE] Source: https://freestatistics.org/blog/index.php?pk=310551&T=9

Globally Unique Identifier (entire table): ba.freestatistics.org/blog/index.php?pk=310551&T=9

As an alternative you can also use a QR Code:  

The GUIDs for individual cells are displayed in the table below:

Variance Inflation Factors (Multicollinearity)
> vif
     Inw      Ink      OPC 
1.066261 1.338066 1.264394 


Parameters (Session):
par1 = FALSE ; par2 = 0.0 ; par3 = 1 ; par4 = 0 ; par5 = 12 ; par6 = 3 ; par7 = 1 ; par8 = 1 ; par9 = 1 ;
Parameters (R input):
par1 = 3 ; par2 = Do not include Seasonal Dummies ; par3 = No Linear Trend ; par4 = 0 ; par5 = 0 ; par6 = 12 ;
R code (references can be found in the software module):
library(lattice)
library(lmtest)
library(car)
library(MASS)
n25 <- 25 #minimum number of obs. for Goldfeld-Quandt test
mywarning <- ''
par6 <- as.numeric(par6)
if(is.na(par6)) {
par6 <- 12
mywarning = 'Warning: you did not specify the seasonality. The seasonal period was set to s = 12.'
}
par1 <- as.numeric(par1)
if(is.na(par1)) {
par1 <- 1
mywarning = 'Warning: you did not specify the column number of the endogenous series! The first column was selected by default.'
}
if (par4=='') par4 <- 0
par4 <- as.numeric(par4)
if (!is.numeric(par4)) par4 <- 0
if (par5=='') par5 <- 0
par5 <- as.numeric(par5)
if (!is.numeric(par5)) par5 <- 0
x <- na.omit(t(y))
k <- length(x[1,])
n <- length(x[,1])
x1 <- cbind(x[,par1], x[,1:k!=par1])
mycolnames <- c(colnames(x)[par1], colnames(x)[1:k!=par1])
colnames(x1) <- mycolnames #colnames(x)[par1]
x <- x1
if (par3 == 'First Differences'){
(n <- n -1)
x2 <- array(0, dim=c(n,k), dimnames=list(1:n, paste('(1-B)',colnames(x),sep='')))
for (i in 1:n) {
for (j in 1:k) {
x2[i,j] <- x[i+1,j] - x[i,j]
}
}
x <- x2
}
if (par3 == 'Seasonal Differences (s)'){
(n <- n - par6)
x2 <- array(0, dim=c(n,k), dimnames=list(1:n, paste('(1-Bs)',colnames(x),sep='')))
for (i in 1:n) {
for (j in 1:k) {
x2[i,j] <- x[i+par6,j] - x[i,j]
}
}
x <- x2
}
if (par3 == 'First and Seasonal Differences (s)'){
(n <- n -1)
x2 <- array(0, dim=c(n,k), dimnames=list(1:n, paste('(1-B)',colnames(x),sep='')))
for (i in 1:n) {
for (j in 1:k) {
x2[i,j] <- x[i+1,j] - x[i,j]
}
}
x <- x2
(n <- n - par6)
x2 <- array(0, dim=c(n,k), dimnames=list(1:n, paste('(1-Bs)',colnames(x),sep='')))
for (i in 1:n) {
for (j in 1:k) {
x2[i,j] <- x[i+par6,j] - x[i,j]
}
}
x <- x2
}
if(par4 > 0) {
x2 <- array(0, dim=c(n-par4,par4), dimnames=list(1:(n-par4), paste(colnames(x)[par1],'(t-',1:par4,')',sep='')))
for (i in 1:(n-par4)) {
for (j in 1:par4) {
x2[i,j] <- x[i+par4-j,par1]
}
}
x <- cbind(x[(par4+1):n,], x2)
n <- n - par4
}
if(par5 > 0) {
x2 <- array(0, dim=c(n-par5*par6,par5), dimnames=list(1:(n-par5*par6), paste(colnames(x)[par1],'(t-',1:par5,'s)',sep='')))
for (i in 1:(n-par5*par6)) {
for (j in 1:par5) {
x2[i,j] <- x[i+par5*par6-j*par6,par1]
}
}
x <- cbind(x[(par5*par6+1):n,], x2)
n <- n - par5*par6
}
if (par2 == 'Include Seasonal Dummies'){
x2 <- array(0, dim=c(n,par6-1), dimnames=list(1:n, paste('M', seq(1:(par6-1)), sep ='')))
for (i in 1:(par6-1)){
x2[seq(i,n,par6),i] <- 1
}
x <- cbind(x, x2)
}
if (par2 == 'Include Monthly Dummies'){
x2 <- array(0, dim=c(n,11), dimnames=list(1:n, paste('M', seq(1:11), sep ='')))
for (i in 1:11){
x2[seq(i,n,12),i] <- 1
}
x <- cbind(x, x2)
}
if (par2 == 'Include Quarterly Dummies'){
x2 <- array(0, dim=c(n,3), dimnames=list(1:n, paste('Q', seq(1:3), sep ='')))
for (i in 1:3){
x2[seq(i,n,4),i] <- 1
}
x <- cbind(x, x2)
}
(k <- length(x[n,]))
if (par3 == 'Linear Trend'){
x <- cbind(x, c(1:n))
colnames(x)[k+1] <- 't'
}
print(x)
(k <- length(x[n,]))
head(x)
df <- as.data.frame(x)
(mylm <- lm(df))
(mysum <- summary(mylm))
if (n > n25) {
kp3 <- k + 3
nmkm3 <- n - k - 3
gqarr <- array(NA, dim=c(nmkm3-kp3+1,3))
numgqtests <- 0
numsignificant1 <- 0
numsignificant5 <- 0
numsignificant10 <- 0
for (mypoint in kp3:nmkm3) {
j <- 0
numgqtests <- numgqtests + 1
for (myalt in c('greater', 'two.sided', 'less')) {
j <- j + 1
gqarr[mypoint-kp3+1,j] <- gqtest(mylm, point=mypoint, alternative=myalt)$p.value
}
if (gqarr[mypoint-kp3+1,2] < 0.01) numsignificant1 <- numsignificant1 + 1
if (gqarr[mypoint-kp3+1,2] < 0.05) numsignificant5 <- numsignificant5 + 1
if (gqarr[mypoint-kp3+1,2] < 0.10) numsignificant10 <- numsignificant10 + 1
}
gqarr
}
bitmap(file='test0.png')
plot(x[,1], type='l', main='Actuals and Interpolation', ylab='value of Actuals and Interpolation (dots)', xlab='time or index')
points(x[,1]-mysum$resid)
grid()
dev.off()
bitmap(file='test1.png')
plot(mysum$resid, type='b', pch=19, main='Residuals', ylab='value of Residuals', xlab='time or index')
grid()
dev.off()
bitmap(file='test2.png')
sresid <- studres(mylm)
hist(sresid, freq=FALSE, main='Distribution of Studentized Residuals')
xfit<-seq(min(sresid),max(sresid),length=40)
yfit<-dnorm(xfit)
lines(xfit, yfit)
grid()
dev.off()
bitmap(file='test3.png')
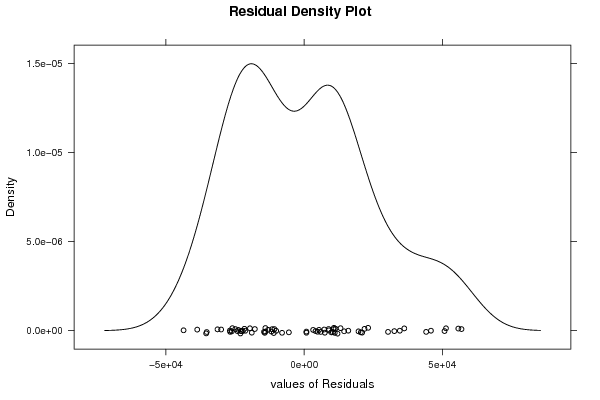
densityplot(~mysum$resid,col='black',main='Residual Density Plot', xlab='values of Residuals')
dev.off()
bitmap(file='test4.png')
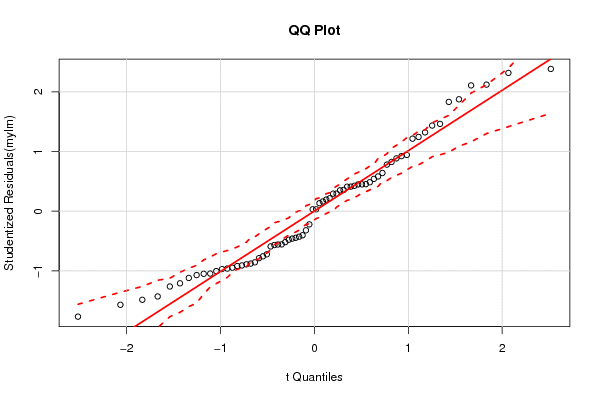
qqPlot(mylm, main='QQ Plot')
grid()
dev.off()
(myerror <- as.ts(mysum$resid))
bitmap(file='test5.png')
dum <- cbind(lag(myerror,k=1),myerror)
dum
dum1 <- dum[2:length(myerror),]
dum1
z <- as.data.frame(dum1)
print(z)
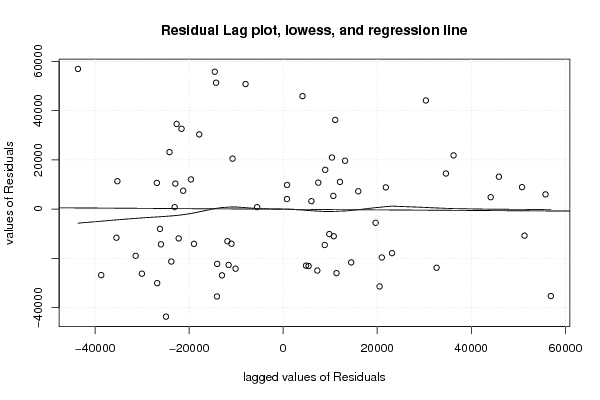
plot(z,main=paste('Residual Lag plot, lowess, and regression line'), ylab='values of Residuals', xlab='lagged values of Residuals')
lines(lowess(z))
abline(lm(z))
grid()
dev.off()
bitmap(file='test6.png')
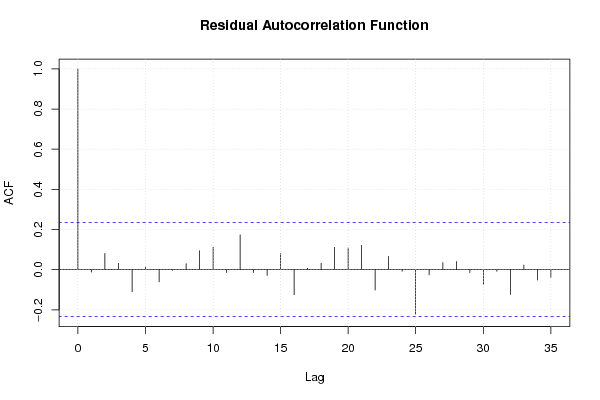
acf(mysum$resid, lag.max=length(mysum$resid)/2, main='Residual Autocorrelation Function')
grid()
dev.off()
bitmap(file='test7.png')
pacf(mysum$resid, lag.max=length(mysum$resid)/2, main='Residual Partial Autocorrelation Function')
grid()
dev.off()
bitmap(file='test8.png')
opar <- par(mfrow = c(2,2), oma = c(0, 0, 1.1, 0))
plot(mylm, las = 1, sub='Residual Diagnostics')
par(opar)
dev.off()
if (n > n25) {
bitmap(file='test9.png')
plot(kp3:nmkm3,gqarr[,2], main='Goldfeld-Quandt test',ylab='2-sided p-value',xlab='breakpoint')
grid()
dev.off()
}
load(file='createtable')
a<-table.start()
a<-table.row.start(a)
a<-table.element(a, 'Multiple Linear Regression - Estimated Regression Equation', 1, TRUE)
a<-table.row.end(a)
myeq <- colnames(x)[1]
myeq <- paste(myeq, '[t] = ', sep='')
for (i in 1:k){
if (mysum$coefficients[i,1] > 0) myeq <- paste(myeq, '+', '')
myeq <- paste(myeq, signif(mysum$coefficients[i,1],6), sep=' ')
if (rownames(mysum$coefficients)[i] != '(Intercept)') {
myeq <- paste(myeq, rownames(mysum$coefficients)[i], sep='')
if (rownames(mysum$coefficients)[i] != 't') myeq <- paste(myeq, '[t]', sep='')
}
}
myeq <- paste(myeq, ' + e[t]')
a<-table.row.start(a)
a<-table.element(a, myeq)
a<-table.row.end(a)
a<-table.row.start(a)
a<-table.element(a, mywarning)
a<-table.row.end(a)
a<-table.end(a)
table.save(a,file='mytable1.tab')
a<-table.start()
a<-table.row.start(a)
a<-table.element(a,'Multiple Linear Regression - Ordinary Least Squares', 6, TRUE)
a<-table.row.end(a)
a<-table.row.start(a)
a<-table.element(a,'Variable',header=TRUE)
a<-table.element(a,'Parameter',header=TRUE)
a<-table.element(a,'S.D.',header=TRUE)
a<-table.element(a,'T-STAT
H0: parameter = 0',header=TRUE)
a<-table.element(a,'2-tail p-value',header=TRUE)
a<-table.element(a,'1-tail p-value',header=TRUE)
a<-table.row.end(a)
for (i in 1:k){
a<-table.row.start(a)
a<-table.element(a,rownames(mysum$coefficients)[i],header=TRUE)
a<-table.element(a,formatC(signif(mysum$coefficients[i,1],5),format='g',flag='+'))
a<-table.element(a,formatC(signif(mysum$coefficients[i,2],5),format='g',flag=' '))
a<-table.element(a,formatC(signif(mysum$coefficients[i,3],4),format='e',flag='+'))
a<-table.element(a,formatC(signif(mysum$coefficients[i,4],4),format='g',flag=' '))
a<-table.element(a,formatC(signif(mysum$coefficients[i,4]/2,4),format='g',flag=' '))
a<-table.row.end(a)
}
a<-table.end(a)
table.save(a,file='mytable2.tab')
a<-table.start()
a<-table.row.start(a)
a<-table.element(a, 'Multiple Linear Regression - Regression Statistics', 2, TRUE)
a<-table.row.end(a)
a<-table.row.start(a)
a<-table.element(a, 'Multiple R',1,TRUE)
a<-table.element(a,formatC(signif(sqrt(mysum$r.squared),6),format='g',flag=' '))
a<-table.row.end(a)
a<-table.row.start(a)
a<-table.element(a, 'R-squared',1,TRUE)
a<-table.element(a,formatC(signif(mysum$r.squared,6),format='g',flag=' '))
a<-table.row.end(a)
a<-table.row.start(a)
a<-table.element(a, 'Adjusted R-squared',1,TRUE)
a<-table.element(a,formatC(signif(mysum$adj.r.squared,6),format='g',flag=' '))
a<-table.row.end(a)
a<-table.row.start(a)
a<-table.element(a, 'F-TEST (value)',1,TRUE)
a<-table.element(a,formatC(signif(mysum$fstatistic[1],6),format='g',flag=' '))
a<-table.row.end(a)
a<-table.row.start(a)
a<-table.element(a, 'F-TEST (DF numerator)',1,TRUE)
a<-table.element(a, signif(mysum$fstatistic[2],6))
a<-table.row.end(a)
a<-table.row.start(a)
a<-table.element(a, 'F-TEST (DF denominator)',1,TRUE)
a<-table.element(a, signif(mysum$fstatistic[3],6))
a<-table.row.end(a)
a<-table.row.start(a)
a<-table.element(a, 'p-value',1,TRUE)
a<-table.element(a,formatC(signif(1-pf(mysum$fstatistic[1],mysum$fstatistic[2],mysum$fstatistic[3]),6),format='g',flag=' '))
a<-table.row.end(a)
a<-table.row.start(a)
a<-table.element(a, 'Multiple Linear Regression - Residual Statistics', 2, TRUE)
a<-table.row.end(a)
a<-table.row.start(a)
a<-table.element(a, 'Residual Standard Deviation',1,TRUE)
a<-table.element(a,formatC(signif(mysum$sigma,6),format='g',flag=' '))
a<-table.row.end(a)
a<-table.row.start(a)
a<-table.element(a, 'Sum Squared Residuals',1,TRUE)
a<-table.element(a,formatC(signif(sum(myerror*myerror),6),format='g',flag=' '))
a<-table.row.end(a)
a<-table.end(a)
table.save(a,file='mytable3.tab')
myr <- as.numeric(mysum$resid)
myr
a <-table.start()
a <- table.row.start(a)
a <- table.element(a,'Menu of Residual Diagnostics',2,TRUE)
a <- table.row.end(a)
a <- table.row.start(a)
a <- table.element(a,'Description',1,TRUE)
a <- table.element(a,'Link',1,TRUE)
a <- table.row.end(a)
a <- table.row.start(a)
a <-table.element(a,'Histogram',1,header=TRUE)
a <- table.element(a,hyperlink( paste('https://supernova.wessa.net/rwasp_histogram.wasp?convertgetintopost=1&data=',paste(as.character(mysum$resid),sep='',collapse=' '),sep='') ,'Compute','Click here to examine the Residuals.'),1)
a <- table.row.end(a)
a <- table.row.start(a)
a <-table.element(a,'Central Tendency',1,header=TRUE)
a <- table.element(a,hyperlink( paste('https://supernova.wessa.net/rwasp_centraltendency.wasp?convertgetintopost=1&data=',paste(as.character(mysum$resid),sep='',collapse=' '),sep='') ,'Compute','Click here to examine the Residuals.'),1)
a <- table.row.end(a)
a <- table.row.start(a)
a <-table.element(a,'QQ Plot',1,header=TRUE)
a <- table.element(a,hyperlink( paste('https://supernova.wessa.net/rwasp_fitdistrnorm.wasp?convertgetintopost=1&data=',paste(as.character(mysum$resid),sep='',collapse=' '),sep='') ,'Compute','Click here to examine the Residuals.'),1)
a <- table.row.end(a)
a <- table.row.start(a)
a <-table.element(a,'Kernel Density Plot',1,header=TRUE)
a <- table.element(a,hyperlink( paste('https://supernova.wessa.net/rwasp_density.wasp?convertgetintopost=1&data=',paste(as.character(mysum$resid),sep='',collapse=' '),sep='') ,'Compute','Click here to examine the Residuals.'),1)
a <- table.row.end(a)
a <- table.row.start(a)
a <-table.element(a,'Skewness/Kurtosis Test',1,header=TRUE)
a <- table.element(a,hyperlink( paste('https://supernova.wessa.net/rwasp_skewness_kurtosis.wasp?convertgetintopost=1&data=',paste(as.character(mysum$resid),sep='',collapse=' '),sep='') ,'Compute','Click here to examine the Residuals.'),1)
a <- table.row.end(a)
a <- table.row.start(a)
a <-table.element(a,'Skewness-Kurtosis Plot',1,header=TRUE)
a <- table.element(a,hyperlink( paste('https://supernova.wessa.net/rwasp_skewness_kurtosis_plot.wasp?convertgetintopost=1&data=',paste(as.character(mysum$resid),sep='',collapse=' '),sep='') ,'Compute','Click here to examine the Residuals.'),1)
a <- table.row.end(a)
a <- table.row.start(a)
a <-table.element(a,'Harrell-Davis Plot',1,header=TRUE)
a <- table.element(a,hyperlink( paste('https://supernova.wessa.net/rwasp_harrell_davis.wasp?convertgetintopost=1&data=',paste(as.character(mysum$resid),sep='',collapse=' '),sep='') ,'Compute','Click here to examine the Residuals.'),1)
a <- table.row.end(a)
a <- table.row.start(a)
a <-table.element(a,'Bootstrap Plot -- Central Tendency',1,header=TRUE)
a <- table.element(a,hyperlink( paste('https://supernova.wessa.net/rwasp_bootstrapplot1.wasp?convertgetintopost=1&data=',paste(as.character(mysum$resid),sep='',collapse=' '),sep='') ,'Compute','Click here to examine the Residuals.'),1)
a <- table.row.end(a)
a <- table.row.start(a)
a <-table.element(a,'Blocked Bootstrap Plot -- Central Tendency',1,header=TRUE)
a <- table.element(a,hyperlink( paste('https://supernova.wessa.net/rwasp_bootstrapplot.wasp?convertgetintopost=1&data=',paste(as.character(mysum$resid),sep='',collapse=' '),sep='') ,'Compute','Click here to examine the Residuals.'),1)
a <- table.row.end(a)
a <- table.row.start(a)
a <-table.element(a,'(Partial) Autocorrelation Plot',1,header=TRUE)
a <- table.element(a,hyperlink( paste('https://supernova.wessa.net/rwasp_autocorrelation.wasp?convertgetintopost=1&data=',paste(as.character(mysum$resid),sep='',collapse=' '),sep='') ,'Compute','Click here to examine the Residuals.'),1)
a <- table.row.end(a)
a <- table.row.start(a)
a <-table.element(a,'Spectral Analysis',1,header=TRUE)
a <- table.element(a,hyperlink( paste('https://supernova.wessa.net/rwasp_spectrum.wasp?convertgetintopost=1&data=',paste(as.character(mysum$resid),sep='',collapse=' '),sep='') ,'Compute','Click here to examine the Residuals.'),1)
a <- table.row.end(a)
a <- table.row.start(a)
a <-table.element(a,'Tukey lambda PPCC Plot',1,header=TRUE)
a <- table.element(a,hyperlink( paste('https://supernova.wessa.net/rwasp_tukeylambda.wasp?convertgetintopost=1&data=',paste(as.character(mysum$resid),sep='',collapse=' '),sep='') ,'Compute','Click here to examine the Residuals.'),1)
a <- table.row.end(a)
a <- table.row.start(a)
a <-table.element(a,'Box-Cox Normality Plot',1,header=TRUE)
a <- table.element(a,hyperlink( paste('https://supernova.wessa.net/rwasp_boxcoxnorm.wasp?convertgetintopost=1&data=',paste(as.character(mysum$resid),sep='',collapse=' '),sep='') ,'Compute','Click here to examine the Residuals.'),1)
a <- table.row.end(a)
a <- table.row.start(a)
a <- table.element(a,'Summary Statistics',1,header=TRUE)
a <- table.element(a,hyperlink( paste('https://supernova.wessa.net/rwasp_summary1.wasp?convertgetintopost=1&data=',paste(as.character(mysum$resid),sep='',collapse=' '),sep='') ,'Compute','Click here to examine the Residuals.'),1)
a <- table.row.end(a)
a<-table.end(a)
table.save(a,file='mytable7.tab')
if(n < 200) {
a<-table.start()
a<-table.row.start(a)
a<-table.element(a, 'Multiple Linear Regression - Actuals, Interpolation, and Residuals', 4, TRUE)
a<-table.row.end(a)
a<-table.row.start(a)
a<-table.element(a, 'Time or Index', 1, TRUE)
a<-table.element(a, 'Actuals', 1, TRUE)
a<-table.element(a, 'Interpolation
Forecast', 1, TRUE)
a<-table.element(a, 'Residuals
Prediction Error', 1, TRUE)
a<-table.row.end(a)
for (i in 1:n) {
a<-table.row.start(a)
a<-table.element(a,i, 1, TRUE)
a<-table.element(a,formatC(signif(x[i],6),format='g',flag=' '))
a<-table.element(a,formatC(signif(x[i]-mysum$resid[i],6),format='g',flag=' '))
a<-table.element(a,formatC(signif(mysum$resid[i],6),format='g',flag=' '))
a<-table.row.end(a)
}
a<-table.end(a)
table.save(a,file='mytable4.tab')
if (n > n25) {
a<-table.start()
a<-table.row.start(a)
a<-table.element(a,'Goldfeld-Quandt test for Heteroskedasticity',4,TRUE)
a<-table.row.end(a)
a<-table.row.start(a)
a<-table.element(a,'p-values',header=TRUE)
a<-table.element(a,'Alternative Hypothesis',3,header=TRUE)
a<-table.row.end(a)
a<-table.row.start(a)
a<-table.element(a,'breakpoint index',header=TRUE)
a<-table.element(a,'greater',header=TRUE)
a<-table.element(a,'2-sided',header=TRUE)
a<-table.element(a,'less',header=TRUE)
a<-table.row.end(a)
for (mypoint in kp3:nmkm3) {
a<-table.row.start(a)
a<-table.element(a,mypoint,header=TRUE)
a<-table.element(a,formatC(signif(gqarr[mypoint-kp3+1,1],6),format='g',flag=' '))
a<-table.element(a,formatC(signif(gqarr[mypoint-kp3+1,2],6),format='g',flag=' '))
a<-table.element(a,formatC(signif(gqarr[mypoint-kp3+1,3],6),format='g',flag=' '))
a<-table.row.end(a)
}
a<-table.end(a)
table.save(a,file='mytable5.tab')
a<-table.start()
a<-table.row.start(a)
a<-table.element(a,'Meta Analysis of Goldfeld-Quandt test for Heteroskedasticity',4,TRUE)
a<-table.row.end(a)
a<-table.row.start(a)
a<-table.element(a,'Description',header=TRUE)
a<-table.element(a,'# significant tests',header=TRUE)
a<-table.element(a,'% significant tests',header=TRUE)
a<-table.element(a,'OK/NOK',header=TRUE)
a<-table.row.end(a)
a<-table.row.start(a)
a<-table.element(a,'1% type I error level',header=TRUE)
a<-table.element(a,signif(numsignificant1,6))
a<-table.element(a,formatC(signif(numsignificant1/numgqtests,6),format='g',flag=' '))
if (numsignificant1/numgqtests < 0.01) dum <- 'OK' else dum <- 'NOK'
a<-table.element(a,dum)
a<-table.row.end(a)
a<-table.row.start(a)
a<-table.element(a,'5% type I error level',header=TRUE)
a<-table.element(a,signif(numsignificant5,6))
a<-table.element(a,signif(numsignificant5/numgqtests,6))
if (numsignificant5/numgqtests < 0.05) dum <- 'OK' else dum <- 'NOK'
a<-table.element(a,dum)
a<-table.row.end(a)
a<-table.row.start(a)
a<-table.element(a,'10% type I error level',header=TRUE)
a<-table.element(a,signif(numsignificant10,6))
a<-table.element(a,signif(numsignificant10/numgqtests,6))
if (numsignificant10/numgqtests < 0.1) dum <- 'OK' else dum <- 'NOK'
a<-table.element(a,dum)
a<-table.row.end(a)
a<-table.end(a)
table.save(a,file='mytable6.tab')
}
}
a<-table.start()
a<-table.row.start(a)
a<-table.element(a,'Ramsey RESET F-Test for powers (2 and 3) of fitted values',1,TRUE)
a<-table.row.end(a)
a<-table.row.start(a)
reset_test_fitted <- resettest(mylm,power=2:3,type='fitted')
a<-table.element(a,paste('
',RC.texteval('reset_test_fitted'),'
',sep=''))
a<-table.row.end(a)
a<-table.row.start(a)
a<-table.element(a,'Ramsey RESET F-Test for powers (2 and 3) of regressors',1,TRUE)
a<-table.row.end(a)
a<-table.row.start(a)
reset_test_regressors <- resettest(mylm,power=2:3,type='regressor')
a<-table.element(a,paste('
',RC.texteval('reset_test_regressors'),'
',sep=''))
a<-table.row.end(a)
a<-table.row.start(a)
a<-table.element(a,'Ramsey RESET F-Test for powers (2 and 3) of principal components',1,TRUE)
a<-table.row.end(a)
a<-table.row.start(a)
reset_test_principal_components <- resettest(mylm,power=2:3,type='princomp')
a<-table.element(a,paste('
',RC.texteval('reset_test_principal_components'),'
',sep=''))
a<-table.row.end(a)
a<-table.end(a)
table.save(a,file='mytable8.tab')
a<-table.start()
a<-table.row.start(a)
a<-table.element(a,'Variance Inflation Factors (Multicollinearity)',1,TRUE)
a<-table.row.end(a)
a<-table.row.start(a)
vif <- vif(mylm)
a<-table.element(a,paste('
',RC.texteval('vif'),'
',sep=''))
a<-table.row.end(a)
a<-table.end(a)
table.save(a,file='mytable9.tab')