Free Statistics

of Irreproducible Research!

Author's title

Author*The author of this computation has been verified*
R Software Modulerwasp_autocorrelation.wasp
Title produced by software(Partial) Autocorrelation Function
Date of computationWed, 20 Dec 2017 16:28:40 +0100
Cite this page as followsStatistical Computations at FreeStatistics.org, Office for Research Development and Education, URL https://freestatistics.org/blog/index.php?v=date/2017/Dec/20/t15137837518c36axqr49uip86.htm/, Retrieved Tue, 14 May 2024 18:46:11 +0000
Statistical Computations at FreeStatistics.org, Office for Research Development and Education, URL https://freestatistics.org/blog/index.php?pk=310530, Retrieved Tue, 14 May 2024 18:46:11 +0000
QR Codes:

Original text written by user:
IsPrivate?No (this computation is public)
User-defined keywords
Estimated Impact90
Family? (F = Feedback message, R = changed R code, M = changed R Module, P = changed Parameters, D = changed Data)
-       [(Partial) Autocorrelation Function] [autocorrelatie] [2017-12-20 15:28:40] [84592a6ba07caf36916a6fee2e3505cc] [Current]
Feedback Forum

Post a new message
Dataseries X:
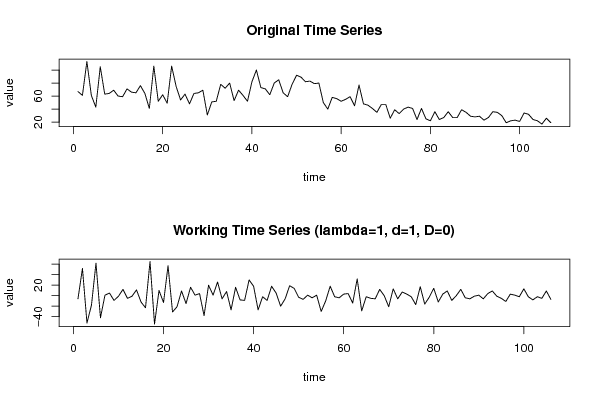
67
61
113
61
43
105
63
64
69
60
59
71
66
65
76
64
41
106
52
62
49
106
75
54
63
48
64
65
69
31
51
52
78
72
80
53
69
61
52
82
100
73
71
62
80
85
65
59
78
92
89
82
83
79
80
50
40
58
56
52
55
59
45
77
48
46
41
35
47
47
26
39
33
40
43
41
24
41
25
22
36
24
27
36
27
27
39
35
29
28
29
23
27
36
35
30
19
22
23
21
34
32
24
22
17
26
19


Summary of computational transaction
Raw Input view raw input (R code)
Raw Outputview raw output of R engine
Computing time2 seconds
R ServerBig Analytics Cloud Computing Center

\begin{tabular}{lllllllll}
\hline
Summary of computational transaction \tabularnewline
Raw Input view raw input (R code)  \tabularnewline
Raw Outputview raw output of R engine  \tabularnewline
Computing time2 seconds \tabularnewline
R ServerBig Analytics Cloud Computing Center \tabularnewline
\hline
\end{tabular}
%Source: https://freestatistics.org/blog/index.php?pk=310530&T=0

[TABLE]
[ROW]
Summary of computational transaction[/C][/ROW] [ROW]Raw Input[/C] view raw input (R code) [/C][/ROW] [ROW]Raw Output[/C]view raw output of R engine [/C][/ROW] [ROW]Computing time[/C]2 seconds[/C][/ROW] [ROW]R Server[/C]Big Analytics Cloud Computing Center[/C][/ROW] [/TABLE] Source: https://freestatistics.org/blog/index.php?pk=310530&T=0

Globally Unique Identifier (entire table): ba.freestatistics.org/blog/index.php?pk=310530&T=0

As an alternative you can also use a QR Code:  

The GUIDs for individual cells are displayed in the table below:

Summary of computational transaction
Raw Input view raw input (R code)
Raw Outputview raw output of R engine
Computing time2 seconds
R ServerBig Analytics Cloud Computing Center


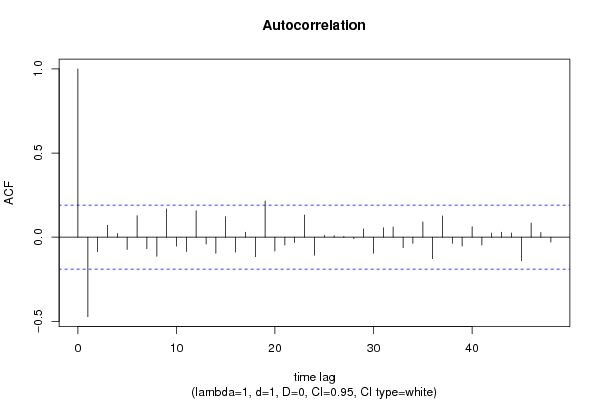
Autocorrelation Function
Time lag kACF(k)T-STATP-value
1-0.472594-4.86562e-06
2-0.087074-0.89650.186014
30.0703440.72420.235258
40.0215780.22220.412308
5-0.072978-0.75140.227053
60.1278781.31660.095408
7-0.068161-0.70180.242182
8-0.113541-1.1690.122517
90.1677451.7270.043537
10-0.053372-0.54950.291909
11-0.084962-0.87470.191847
120.1570551.6170.054428
13-0.040317-0.41510.339459
14-0.095261-0.98080.164469
150.1221841.2580.105584
16-0.087893-0.90490.183782
170.0294170.30290.381294
18-0.115976-1.19410.117562
190.2146522.210.014628
20-0.081921-0.84340.200445
21-0.047117-0.48510.314303
22-0.031965-0.32910.371363
230.1321371.36040.08829
24-0.107488-1.10670.135474
250.0100610.10360.458846
260.0082340.08480.466301
270.0034990.0360.485664
28-0.009049-0.09320.462974
290.0482110.49640.310334
30-0.09599-0.98830.162634
310.0551350.56760.285737
320.0609480.62750.26584
33-0.062406-0.64250.260963
34-0.036777-0.37860.352854
350.089740.92390.178812
36-0.127729-1.31510.095665
370.1259081.29630.098843
38-0.036515-0.37590.353855
39-0.052192-0.53730.296078
400.061450.63270.264157
41-0.046591-0.47970.31622
420.0242130.24930.40181
430.0295650.30440.380712
440.0242940.25010.401488
45-0.140419-1.44570.075605
460.083450.85920.196094
470.0278470.28670.38745
48-0.028403-0.29240.385266

\begin{tabular}{lllllllll}
\hline
Autocorrelation Function \tabularnewline
Time lag k & ACF(k) & T-STAT & P-value \tabularnewline
1 & -0.472594 & -4.8656 & 2e-06 \tabularnewline
2 & -0.087074 & -0.8965 & 0.186014 \tabularnewline
3 & 0.070344 & 0.7242 & 0.235258 \tabularnewline
4 & 0.021578 & 0.2222 & 0.412308 \tabularnewline
5 & -0.072978 & -0.7514 & 0.227053 \tabularnewline
6 & 0.127878 & 1.3166 & 0.095408 \tabularnewline
7 & -0.068161 & -0.7018 & 0.242182 \tabularnewline
8 & -0.113541 & -1.169 & 0.122517 \tabularnewline
9 & 0.167745 & 1.727 & 0.043537 \tabularnewline
10 & -0.053372 & -0.5495 & 0.291909 \tabularnewline
11 & -0.084962 & -0.8747 & 0.191847 \tabularnewline
12 & 0.157055 & 1.617 & 0.054428 \tabularnewline
13 & -0.040317 & -0.4151 & 0.339459 \tabularnewline
14 & -0.095261 & -0.9808 & 0.164469 \tabularnewline
15 & 0.122184 & 1.258 & 0.105584 \tabularnewline
16 & -0.087893 & -0.9049 & 0.183782 \tabularnewline
17 & 0.029417 & 0.3029 & 0.381294 \tabularnewline
18 & -0.115976 & -1.1941 & 0.117562 \tabularnewline
19 & 0.214652 & 2.21 & 0.014628 \tabularnewline
20 & -0.081921 & -0.8434 & 0.200445 \tabularnewline
21 & -0.047117 & -0.4851 & 0.314303 \tabularnewline
22 & -0.031965 & -0.3291 & 0.371363 \tabularnewline
23 & 0.132137 & 1.3604 & 0.08829 \tabularnewline
24 & -0.107488 & -1.1067 & 0.135474 \tabularnewline
25 & 0.010061 & 0.1036 & 0.458846 \tabularnewline
26 & 0.008234 & 0.0848 & 0.466301 \tabularnewline
27 & 0.003499 & 0.036 & 0.485664 \tabularnewline
28 & -0.009049 & -0.0932 & 0.462974 \tabularnewline
29 & 0.048211 & 0.4964 & 0.310334 \tabularnewline
30 & -0.09599 & -0.9883 & 0.162634 \tabularnewline
31 & 0.055135 & 0.5676 & 0.285737 \tabularnewline
32 & 0.060948 & 0.6275 & 0.26584 \tabularnewline
33 & -0.062406 & -0.6425 & 0.260963 \tabularnewline
34 & -0.036777 & -0.3786 & 0.352854 \tabularnewline
35 & 0.08974 & 0.9239 & 0.178812 \tabularnewline
36 & -0.127729 & -1.3151 & 0.095665 \tabularnewline
37 & 0.125908 & 1.2963 & 0.098843 \tabularnewline
38 & -0.036515 & -0.3759 & 0.353855 \tabularnewline
39 & -0.052192 & -0.5373 & 0.296078 \tabularnewline
40 & 0.06145 & 0.6327 & 0.264157 \tabularnewline
41 & -0.046591 & -0.4797 & 0.31622 \tabularnewline
42 & 0.024213 & 0.2493 & 0.40181 \tabularnewline
43 & 0.029565 & 0.3044 & 0.380712 \tabularnewline
44 & 0.024294 & 0.2501 & 0.401488 \tabularnewline
45 & -0.140419 & -1.4457 & 0.075605 \tabularnewline
46 & 0.08345 & 0.8592 & 0.196094 \tabularnewline
47 & 0.027847 & 0.2867 & 0.38745 \tabularnewline
48 & -0.028403 & -0.2924 & 0.385266 \tabularnewline
\hline
\end{tabular}
%Source: https://freestatistics.org/blog/index.php?pk=310530&T=1

[TABLE]
[ROW][C]Autocorrelation Function[/C][/ROW]
[ROW][C]Time lag k[/C][C]ACF(k)[/C][C]T-STAT[/C][C]P-value[/C][/ROW]
[ROW][C]1[/C][C]-0.472594[/C][C]-4.8656[/C][C]2e-06[/C][/ROW]
[ROW][C]2[/C][C]-0.087074[/C][C]-0.8965[/C][C]0.186014[/C][/ROW]
[ROW][C]3[/C][C]0.070344[/C][C]0.7242[/C][C]0.235258[/C][/ROW]
[ROW][C]4[/C][C]0.021578[/C][C]0.2222[/C][C]0.412308[/C][/ROW]
[ROW][C]5[/C][C]-0.072978[/C][C]-0.7514[/C][C]0.227053[/C][/ROW]
[ROW][C]6[/C][C]0.127878[/C][C]1.3166[/C][C]0.095408[/C][/ROW]
[ROW][C]7[/C][C]-0.068161[/C][C]-0.7018[/C][C]0.242182[/C][/ROW]
[ROW][C]8[/C][C]-0.113541[/C][C]-1.169[/C][C]0.122517[/C][/ROW]
[ROW][C]9[/C][C]0.167745[/C][C]1.727[/C][C]0.043537[/C][/ROW]
[ROW][C]10[/C][C]-0.053372[/C][C]-0.5495[/C][C]0.291909[/C][/ROW]
[ROW][C]11[/C][C]-0.084962[/C][C]-0.8747[/C][C]0.191847[/C][/ROW]
[ROW][C]12[/C][C]0.157055[/C][C]1.617[/C][C]0.054428[/C][/ROW]
[ROW][C]13[/C][C]-0.040317[/C][C]-0.4151[/C][C]0.339459[/C][/ROW]
[ROW][C]14[/C][C]-0.095261[/C][C]-0.9808[/C][C]0.164469[/C][/ROW]
[ROW][C]15[/C][C]0.122184[/C][C]1.258[/C][C]0.105584[/C][/ROW]
[ROW][C]16[/C][C]-0.087893[/C][C]-0.9049[/C][C]0.183782[/C][/ROW]
[ROW][C]17[/C][C]0.029417[/C][C]0.3029[/C][C]0.381294[/C][/ROW]
[ROW][C]18[/C][C]-0.115976[/C][C]-1.1941[/C][C]0.117562[/C][/ROW]
[ROW][C]19[/C][C]0.214652[/C][C]2.21[/C][C]0.014628[/C][/ROW]
[ROW][C]20[/C][C]-0.081921[/C][C]-0.8434[/C][C]0.200445[/C][/ROW]
[ROW][C]21[/C][C]-0.047117[/C][C]-0.4851[/C][C]0.314303[/C][/ROW]
[ROW][C]22[/C][C]-0.031965[/C][C]-0.3291[/C][C]0.371363[/C][/ROW]
[ROW][C]23[/C][C]0.132137[/C][C]1.3604[/C][C]0.08829[/C][/ROW]
[ROW][C]24[/C][C]-0.107488[/C][C]-1.1067[/C][C]0.135474[/C][/ROW]
[ROW][C]25[/C][C]0.010061[/C][C]0.1036[/C][C]0.458846[/C][/ROW]
[ROW][C]26[/C][C]0.008234[/C][C]0.0848[/C][C]0.466301[/C][/ROW]
[ROW][C]27[/C][C]0.003499[/C][C]0.036[/C][C]0.485664[/C][/ROW]
[ROW][C]28[/C][C]-0.009049[/C][C]-0.0932[/C][C]0.462974[/C][/ROW]
[ROW][C]29[/C][C]0.048211[/C][C]0.4964[/C][C]0.310334[/C][/ROW]
[ROW][C]30[/C][C]-0.09599[/C][C]-0.9883[/C][C]0.162634[/C][/ROW]
[ROW][C]31[/C][C]0.055135[/C][C]0.5676[/C][C]0.285737[/C][/ROW]
[ROW][C]32[/C][C]0.060948[/C][C]0.6275[/C][C]0.26584[/C][/ROW]
[ROW][C]33[/C][C]-0.062406[/C][C]-0.6425[/C][C]0.260963[/C][/ROW]
[ROW][C]34[/C][C]-0.036777[/C][C]-0.3786[/C][C]0.352854[/C][/ROW]
[ROW][C]35[/C][C]0.08974[/C][C]0.9239[/C][C]0.178812[/C][/ROW]
[ROW][C]36[/C][C]-0.127729[/C][C]-1.3151[/C][C]0.095665[/C][/ROW]
[ROW][C]37[/C][C]0.125908[/C][C]1.2963[/C][C]0.098843[/C][/ROW]
[ROW][C]38[/C][C]-0.036515[/C][C]-0.3759[/C][C]0.353855[/C][/ROW]
[ROW][C]39[/C][C]-0.052192[/C][C]-0.5373[/C][C]0.296078[/C][/ROW]
[ROW][C]40[/C][C]0.06145[/C][C]0.6327[/C][C]0.264157[/C][/ROW]
[ROW][C]41[/C][C]-0.046591[/C][C]-0.4797[/C][C]0.31622[/C][/ROW]
[ROW][C]42[/C][C]0.024213[/C][C]0.2493[/C][C]0.40181[/C][/ROW]
[ROW][C]43[/C][C]0.029565[/C][C]0.3044[/C][C]0.380712[/C][/ROW]
[ROW][C]44[/C][C]0.024294[/C][C]0.2501[/C][C]0.401488[/C][/ROW]
[ROW][C]45[/C][C]-0.140419[/C][C]-1.4457[/C][C]0.075605[/C][/ROW]
[ROW][C]46[/C][C]0.08345[/C][C]0.8592[/C][C]0.196094[/C][/ROW]
[ROW][C]47[/C][C]0.027847[/C][C]0.2867[/C][C]0.38745[/C][/ROW]
[ROW][C]48[/C][C]-0.028403[/C][C]-0.2924[/C][C]0.385266[/C][/ROW]
[/TABLE]
Source: https://freestatistics.org/blog/index.php?pk=310530&T=1

Globally Unique Identifier (entire table): ba.freestatistics.org/blog/index.php?pk=310530&T=1

As an alternative you can also use a QR Code:  

The GUIDs for individual cells are displayed in the table below:

Autocorrelation Function
Time lag kACF(k)T-STATP-value
1-0.472594-4.86562e-06
2-0.087074-0.89650.186014
30.0703440.72420.235258
40.0215780.22220.412308
5-0.072978-0.75140.227053
60.1278781.31660.095408
7-0.068161-0.70180.242182
8-0.113541-1.1690.122517
90.1677451.7270.043537
10-0.053372-0.54950.291909
11-0.084962-0.87470.191847
120.1570551.6170.054428
13-0.040317-0.41510.339459
14-0.095261-0.98080.164469
150.1221841.2580.105584
16-0.087893-0.90490.183782
170.0294170.30290.381294
18-0.115976-1.19410.117562
190.2146522.210.014628
20-0.081921-0.84340.200445
21-0.047117-0.48510.314303
22-0.031965-0.32910.371363
230.1321371.36040.08829
24-0.107488-1.10670.135474
250.0100610.10360.458846
260.0082340.08480.466301
270.0034990.0360.485664
28-0.009049-0.09320.462974
290.0482110.49640.310334
30-0.09599-0.98830.162634
310.0551350.56760.285737
320.0609480.62750.26584
33-0.062406-0.64250.260963
34-0.036777-0.37860.352854
350.089740.92390.178812
36-0.127729-1.31510.095665
370.1259081.29630.098843
38-0.036515-0.37590.353855
39-0.052192-0.53730.296078
400.061450.63270.264157
41-0.046591-0.47970.31622
420.0242130.24930.40181
430.0295650.30440.380712
440.0242940.25010.401488
45-0.140419-1.44570.075605
460.083450.85920.196094
470.0278470.28670.38745
48-0.028403-0.29240.385266


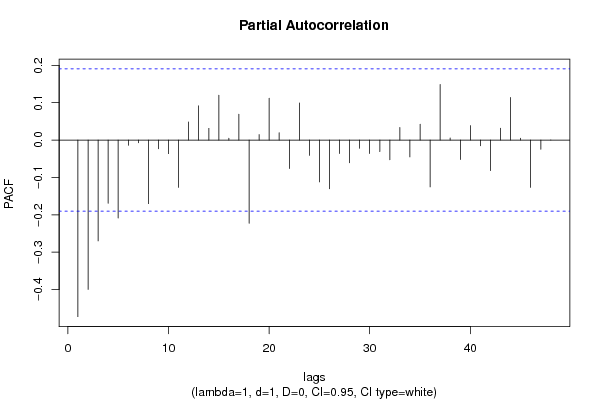
Partial Autocorrelation Function
Time lag kPACF(k)T-STATP-value
1-0.472594-4.86562e-06
2-0.399686-4.1153.8e-05
3-0.269915-2.77890.003226
4-0.168932-1.73930.042446
5-0.208416-2.14580.017087
6-0.013763-0.14170.443794
7-0.007295-0.07510.470138
8-0.170218-1.75250.04129
9-0.023372-0.24060.405153
10-0.03624-0.37310.354905
11-0.126693-1.30440.097464
120.0483070.49730.309986
130.0916210.94330.173836
140.0313360.32260.373809
150.120041.23590.109616
160.004960.05110.479685
170.0691740.71220.238957
18-0.222568-2.29150.011957
190.0146290.15060.440282
200.1121581.15470.125397
210.0194370.20010.420887
22-0.075984-0.78230.21789
230.0990571.01990.155059
24-0.040875-0.42080.337364
25-0.111846-1.15150.126053
26-0.130376-1.34230.091182
27-0.035958-0.37020.355984
28-0.060803-0.6260.266329
29-0.021955-0.2260.410803
30-0.035999-0.37060.355827
31-0.03084-0.31750.375738
32-0.05275-0.54310.294101
330.0336870.34680.364702
34-0.045075-0.46410.321774
350.0424630.43720.331435
36-0.12528-1.28980.099957
370.1489051.53310.064119
380.0055460.05710.477288
39-0.051991-0.53530.296788
400.0386210.39760.345852
41-0.01525-0.1570.43777
42-0.081708-0.84120.201055
430.0317860.32730.372059
440.1137631.17130.122059
450.0050630.05210.479265
46-0.126714-1.30460.097428
47-0.024587-0.25310.400327
482.5e-053e-040.499896

\begin{tabular}{lllllllll}
\hline
Partial Autocorrelation Function \tabularnewline
Time lag k & PACF(k) & T-STAT & P-value \tabularnewline
1 & -0.472594 & -4.8656 & 2e-06 \tabularnewline
2 & -0.399686 & -4.115 & 3.8e-05 \tabularnewline
3 & -0.269915 & -2.7789 & 0.003226 \tabularnewline
4 & -0.168932 & -1.7393 & 0.042446 \tabularnewline
5 & -0.208416 & -2.1458 & 0.017087 \tabularnewline
6 & -0.013763 & -0.1417 & 0.443794 \tabularnewline
7 & -0.007295 & -0.0751 & 0.470138 \tabularnewline
8 & -0.170218 & -1.7525 & 0.04129 \tabularnewline
9 & -0.023372 & -0.2406 & 0.405153 \tabularnewline
10 & -0.03624 & -0.3731 & 0.354905 \tabularnewline
11 & -0.126693 & -1.3044 & 0.097464 \tabularnewline
12 & 0.048307 & 0.4973 & 0.309986 \tabularnewline
13 & 0.091621 & 0.9433 & 0.173836 \tabularnewline
14 & 0.031336 & 0.3226 & 0.373809 \tabularnewline
15 & 0.12004 & 1.2359 & 0.109616 \tabularnewline
16 & 0.00496 & 0.0511 & 0.479685 \tabularnewline
17 & 0.069174 & 0.7122 & 0.238957 \tabularnewline
18 & -0.222568 & -2.2915 & 0.011957 \tabularnewline
19 & 0.014629 & 0.1506 & 0.440282 \tabularnewline
20 & 0.112158 & 1.1547 & 0.125397 \tabularnewline
21 & 0.019437 & 0.2001 & 0.420887 \tabularnewline
22 & -0.075984 & -0.7823 & 0.21789 \tabularnewline
23 & 0.099057 & 1.0199 & 0.155059 \tabularnewline
24 & -0.040875 & -0.4208 & 0.337364 \tabularnewline
25 & -0.111846 & -1.1515 & 0.126053 \tabularnewline
26 & -0.130376 & -1.3423 & 0.091182 \tabularnewline
27 & -0.035958 & -0.3702 & 0.355984 \tabularnewline
28 & -0.060803 & -0.626 & 0.266329 \tabularnewline
29 & -0.021955 & -0.226 & 0.410803 \tabularnewline
30 & -0.035999 & -0.3706 & 0.355827 \tabularnewline
31 & -0.03084 & -0.3175 & 0.375738 \tabularnewline
32 & -0.05275 & -0.5431 & 0.294101 \tabularnewline
33 & 0.033687 & 0.3468 & 0.364702 \tabularnewline
34 & -0.045075 & -0.4641 & 0.321774 \tabularnewline
35 & 0.042463 & 0.4372 & 0.331435 \tabularnewline
36 & -0.12528 & -1.2898 & 0.099957 \tabularnewline
37 & 0.148905 & 1.5331 & 0.064119 \tabularnewline
38 & 0.005546 & 0.0571 & 0.477288 \tabularnewline
39 & -0.051991 & -0.5353 & 0.296788 \tabularnewline
40 & 0.038621 & 0.3976 & 0.345852 \tabularnewline
41 & -0.01525 & -0.157 & 0.43777 \tabularnewline
42 & -0.081708 & -0.8412 & 0.201055 \tabularnewline
43 & 0.031786 & 0.3273 & 0.372059 \tabularnewline
44 & 0.113763 & 1.1713 & 0.122059 \tabularnewline
45 & 0.005063 & 0.0521 & 0.479265 \tabularnewline
46 & -0.126714 & -1.3046 & 0.097428 \tabularnewline
47 & -0.024587 & -0.2531 & 0.400327 \tabularnewline
48 & 2.5e-05 & 3e-04 & 0.499896 \tabularnewline
\hline
\end{tabular}
%Source: https://freestatistics.org/blog/index.php?pk=310530&T=2

[TABLE]
[ROW][C]Partial Autocorrelation Function[/C][/ROW]
[ROW][C]Time lag k[/C][C]PACF(k)[/C][C]T-STAT[/C][C]P-value[/C][/ROW]
[ROW][C]1[/C][C]-0.472594[/C][C]-4.8656[/C][C]2e-06[/C][/ROW]
[ROW][C]2[/C][C]-0.399686[/C][C]-4.115[/C][C]3.8e-05[/C][/ROW]
[ROW][C]3[/C][C]-0.269915[/C][C]-2.7789[/C][C]0.003226[/C][/ROW]
[ROW][C]4[/C][C]-0.168932[/C][C]-1.7393[/C][C]0.042446[/C][/ROW]
[ROW][C]5[/C][C]-0.208416[/C][C]-2.1458[/C][C]0.017087[/C][/ROW]
[ROW][C]6[/C][C]-0.013763[/C][C]-0.1417[/C][C]0.443794[/C][/ROW]
[ROW][C]7[/C][C]-0.007295[/C][C]-0.0751[/C][C]0.470138[/C][/ROW]
[ROW][C]8[/C][C]-0.170218[/C][C]-1.7525[/C][C]0.04129[/C][/ROW]
[ROW][C]9[/C][C]-0.023372[/C][C]-0.2406[/C][C]0.405153[/C][/ROW]
[ROW][C]10[/C][C]-0.03624[/C][C]-0.3731[/C][C]0.354905[/C][/ROW]
[ROW][C]11[/C][C]-0.126693[/C][C]-1.3044[/C][C]0.097464[/C][/ROW]
[ROW][C]12[/C][C]0.048307[/C][C]0.4973[/C][C]0.309986[/C][/ROW]
[ROW][C]13[/C][C]0.091621[/C][C]0.9433[/C][C]0.173836[/C][/ROW]
[ROW][C]14[/C][C]0.031336[/C][C]0.3226[/C][C]0.373809[/C][/ROW]
[ROW][C]15[/C][C]0.12004[/C][C]1.2359[/C][C]0.109616[/C][/ROW]
[ROW][C]16[/C][C]0.00496[/C][C]0.0511[/C][C]0.479685[/C][/ROW]
[ROW][C]17[/C][C]0.069174[/C][C]0.7122[/C][C]0.238957[/C][/ROW]
[ROW][C]18[/C][C]-0.222568[/C][C]-2.2915[/C][C]0.011957[/C][/ROW]
[ROW][C]19[/C][C]0.014629[/C][C]0.1506[/C][C]0.440282[/C][/ROW]
[ROW][C]20[/C][C]0.112158[/C][C]1.1547[/C][C]0.125397[/C][/ROW]
[ROW][C]21[/C][C]0.019437[/C][C]0.2001[/C][C]0.420887[/C][/ROW]
[ROW][C]22[/C][C]-0.075984[/C][C]-0.7823[/C][C]0.21789[/C][/ROW]
[ROW][C]23[/C][C]0.099057[/C][C]1.0199[/C][C]0.155059[/C][/ROW]
[ROW][C]24[/C][C]-0.040875[/C][C]-0.4208[/C][C]0.337364[/C][/ROW]
[ROW][C]25[/C][C]-0.111846[/C][C]-1.1515[/C][C]0.126053[/C][/ROW]
[ROW][C]26[/C][C]-0.130376[/C][C]-1.3423[/C][C]0.091182[/C][/ROW]
[ROW][C]27[/C][C]-0.035958[/C][C]-0.3702[/C][C]0.355984[/C][/ROW]
[ROW][C]28[/C][C]-0.060803[/C][C]-0.626[/C][C]0.266329[/C][/ROW]
[ROW][C]29[/C][C]-0.021955[/C][C]-0.226[/C][C]0.410803[/C][/ROW]
[ROW][C]30[/C][C]-0.035999[/C][C]-0.3706[/C][C]0.355827[/C][/ROW]
[ROW][C]31[/C][C]-0.03084[/C][C]-0.3175[/C][C]0.375738[/C][/ROW]
[ROW][C]32[/C][C]-0.05275[/C][C]-0.5431[/C][C]0.294101[/C][/ROW]
[ROW][C]33[/C][C]0.033687[/C][C]0.3468[/C][C]0.364702[/C][/ROW]
[ROW][C]34[/C][C]-0.045075[/C][C]-0.4641[/C][C]0.321774[/C][/ROW]
[ROW][C]35[/C][C]0.042463[/C][C]0.4372[/C][C]0.331435[/C][/ROW]
[ROW][C]36[/C][C]-0.12528[/C][C]-1.2898[/C][C]0.099957[/C][/ROW]
[ROW][C]37[/C][C]0.148905[/C][C]1.5331[/C][C]0.064119[/C][/ROW]
[ROW][C]38[/C][C]0.005546[/C][C]0.0571[/C][C]0.477288[/C][/ROW]
[ROW][C]39[/C][C]-0.051991[/C][C]-0.5353[/C][C]0.296788[/C][/ROW]
[ROW][C]40[/C][C]0.038621[/C][C]0.3976[/C][C]0.345852[/C][/ROW]
[ROW][C]41[/C][C]-0.01525[/C][C]-0.157[/C][C]0.43777[/C][/ROW]
[ROW][C]42[/C][C]-0.081708[/C][C]-0.8412[/C][C]0.201055[/C][/ROW]
[ROW][C]43[/C][C]0.031786[/C][C]0.3273[/C][C]0.372059[/C][/ROW]
[ROW][C]44[/C][C]0.113763[/C][C]1.1713[/C][C]0.122059[/C][/ROW]
[ROW][C]45[/C][C]0.005063[/C][C]0.0521[/C][C]0.479265[/C][/ROW]
[ROW][C]46[/C][C]-0.126714[/C][C]-1.3046[/C][C]0.097428[/C][/ROW]
[ROW][C]47[/C][C]-0.024587[/C][C]-0.2531[/C][C]0.400327[/C][/ROW]
[ROW][C]48[/C][C]2.5e-05[/C][C]3e-04[/C][C]0.499896[/C][/ROW]
[/TABLE]
Source: https://freestatistics.org/blog/index.php?pk=310530&T=2

Globally Unique Identifier (entire table): ba.freestatistics.org/blog/index.php?pk=310530&T=2

As an alternative you can also use a QR Code:  

The GUIDs for individual cells are displayed in the table below:

Partial Autocorrelation Function
Time lag kPACF(k)T-STATP-value
1-0.472594-4.86562e-06
2-0.399686-4.1153.8e-05
3-0.269915-2.77890.003226
4-0.168932-1.73930.042446
5-0.208416-2.14580.017087
6-0.013763-0.14170.443794
7-0.007295-0.07510.470138
8-0.170218-1.75250.04129
9-0.023372-0.24060.405153
10-0.03624-0.37310.354905
11-0.126693-1.30440.097464
120.0483070.49730.309986
130.0916210.94330.173836
140.0313360.32260.373809
150.120041.23590.109616
160.004960.05110.479685
170.0691740.71220.238957
18-0.222568-2.29150.011957
190.0146290.15060.440282
200.1121581.15470.125397
210.0194370.20010.420887
22-0.075984-0.78230.21789
230.0990571.01990.155059
24-0.040875-0.42080.337364
25-0.111846-1.15150.126053
26-0.130376-1.34230.091182
27-0.035958-0.37020.355984
28-0.060803-0.6260.266329
29-0.021955-0.2260.410803
30-0.035999-0.37060.355827
31-0.03084-0.31750.375738
32-0.05275-0.54310.294101
330.0336870.34680.364702
34-0.045075-0.46410.321774
350.0424630.43720.331435
36-0.12528-1.28980.099957
370.1489051.53310.064119
380.0055460.05710.477288
39-0.051991-0.53530.296788
400.0386210.39760.345852
41-0.01525-0.1570.43777
42-0.081708-0.84120.201055
430.0317860.32730.372059
440.1137631.17130.122059
450.0050630.05210.479265
46-0.126714-1.30460.097428
47-0.024587-0.25310.400327
482.5e-053e-040.499896


Parameters (Session):
par1 = 48 ; par2 = 1 ; par3 = 1 ; par4 = 0 ; par5 = 12 ; par6 = White Noise ; par7 = 0.95 ;
Parameters (R input):
par1 = 48 ; par2 = 1 ; par3 = 1 ; par4 = 0 ; par5 = 12 ; par6 = White Noise ; par7 = 0.95 ; par8 = ;
R code (references can be found in the software module):
if (par1 == 'Default') {
par1 = 10*log10(length(x))
} else {
par1 <- as.numeric(par1)
}
par2 <- as.numeric(par2)
par3 <- as.numeric(par3)
par4 <- as.numeric(par4)
par5 <- as.numeric(par5)
if (par6 == 'White Noise') par6 <- 'white' else par6 <- 'ma'
par7 <- as.numeric(par7)
if (par8 != '') par8 <- as.numeric(par8)
x <- na.omit(x)
ox <- x
if (par8 == '') {
if (par2 == 0) {
x <- log(x)
} else {
x <- (x ^ par2 - 1) / par2
}
} else {
x <- log(x,base=par8)
}
if (par3 > 0) x <- diff(x,lag=1,difference=par3)
if (par4 > 0) x <- diff(x,lag=par5,difference=par4)
bitmap(file='picts.png')
op <- par(mfrow=c(2,1))
plot(ox,type='l',main='Original Time Series',xlab='time',ylab='value')
if (par8=='') {
mytitle <- paste('Working Time Series (lambda=',par2,', d=',par3,', D=',par4,')',sep='')
mysub <- paste('(lambda=',par2,', d=',par3,', D=',par4,', CI=', par7, ', CI type=',par6,')',sep='')
} else {
mytitle <- paste('Working Time Series (base=',par8,', d=',par3,', D=',par4,')',sep='')
mysub <- paste('(base=',par8,', d=',par3,', D=',par4,', CI=', par7, ', CI type=',par6,')',sep='')
}
plot(x,type='l', main=mytitle,xlab='time',ylab='value')
par(op)
dev.off()
bitmap(file='pic1.png')
racf <- acf(x, par1, main='Autocorrelation', xlab='time lag', ylab='ACF', ci.type=par6, ci=par7, sub=mysub)
dev.off()
bitmap(file='pic2.png')
rpacf <- pacf(x,par1,main='Partial Autocorrelation',xlab='lags',ylab='PACF',sub=mysub)
dev.off()
(myacf <- c(racf$acf))
(mypacf <- c(rpacf$acf))
lengthx <- length(x)
sqrtn <- sqrt(lengthx)
load(file='createtable')
a<-table.start()
a<-table.row.start(a)
a<-table.element(a,'Autocorrelation Function',4,TRUE)
a<-table.row.end(a)
a<-table.row.start(a)
a<-table.element(a,'Time lag k',header=TRUE)
a<-table.element(a,'ACF(k)',header=TRUE)
a<-table.element(a,'T-STAT',header=TRUE)
a<-table.element(a,'P-value',header=TRUE)
a<-table.row.end(a)
for (i in 2:(par1+1)) {
a<-table.row.start(a)
a<-table.element(a,i-1,header=TRUE)
a<-table.element(a,round(myacf[i],6))
mytstat <- myacf[i]*sqrtn
a<-table.element(a,round(mytstat,4))
a<-table.element(a,round(1-pt(abs(mytstat),lengthx),6))
a<-table.row.end(a)
}
a<-table.end(a)
table.save(a,file='mytable.tab')
a<-table.start()
a<-table.row.start(a)
a<-table.element(a,'Partial Autocorrelation Function',4,TRUE)
a<-table.row.end(a)
a<-table.row.start(a)
a<-table.element(a,'Time lag k',header=TRUE)
a<-table.element(a,'PACF(k)',header=TRUE)
a<-table.element(a,'T-STAT',header=TRUE)
a<-table.element(a,'P-value',header=TRUE)
a<-table.row.end(a)
for (i in 1:par1) {
a<-table.row.start(a)
a<-table.element(a,i,header=TRUE)
a<-table.element(a,round(mypacf[i],6))
mytstat <- mypacf[i]*sqrtn
a<-table.element(a,round(mytstat,4))
a<-table.element(a,round(1-pt(abs(mytstat),lengthx),6))
a<-table.row.end(a)
}
a<-table.end(a)
table.save(a,file='mytable1.tab')