Free Statistics

of Irreproducible Research!

Author's title

Author*The author of this computation has been verified*
R Software Modulerwasp_decompose.wasp
Title produced by softwareClassical Decomposition
Date of computationWed, 20 Dec 2017 15:38:16 +0100
Cite this page as followsStatistical Computations at FreeStatistics.org, Office for Research Development and Education, URL https://freestatistics.org/blog/index.php?v=date/2017/Dec/20/t1513781428dfnpnqlt7uwz7n2.htm/, Retrieved Tue, 14 May 2024 07:59:57 +0000
Statistical Computations at FreeStatistics.org, Office for Research Development and Education, URL https://freestatistics.org/blog/index.php?pk=310510, Retrieved Tue, 14 May 2024 07:59:57 +0000
QR Codes:

Original text written by user:
IsPrivate?No (this computation is public)
User-defined keywords
Estimated Impact125
Family? (F = Feedback message, R = changed R code, M = changed R Module, P = changed Parameters, D = changed Data)
-       [Classical Decomposition] [] [2017-12-20 14:38:16] [735c2f340331127bedaa54429b3079f9] [Current]
Feedback Forum

Post a new message
Dataseries X:
58.1
60.3
66.7
63.7
71.7
68.8
61.8
68.7
69.7
76.4
73.8
70.2
67.8
64
73.4
67.8
74.8
73.3
72
76.1
73
80.5
76.1
71.3
71
67.9
74.4
73.6
74.3
73.1
74.5
73.7
76.3
82
73.7
77.2


Summary of computational transaction
Raw Input view raw input (R code)
Raw Outputview raw output of R engine
Computing time2 seconds
R ServerBig Analytics Cloud Computing Center

\begin{tabular}{lllllllll}
\hline
Summary of computational transaction \tabularnewline
Raw Input view raw input (R code)  \tabularnewline
Raw Outputview raw output of R engine  \tabularnewline
Computing time2 seconds \tabularnewline
R ServerBig Analytics Cloud Computing Center \tabularnewline
\hline
\end{tabular}
%Source: https://freestatistics.org/blog/index.php?pk=310510&T=0

[TABLE]
[ROW]
Summary of computational transaction[/C][/ROW] [ROW]Raw Input[/C] view raw input (R code) [/C][/ROW] [ROW]Raw Output[/C]view raw output of R engine [/C][/ROW] [ROW]Computing time[/C]2 seconds[/C][/ROW] [ROW]R Server[/C]Big Analytics Cloud Computing Center[/C][/ROW] [/TABLE] Source: https://freestatistics.org/blog/index.php?pk=310510&T=0

Globally Unique Identifier (entire table): ba.freestatistics.org/blog/index.php?pk=310510&T=0

As an alternative you can also use a QR Code:  

The GUIDs for individual cells are displayed in the table below:

Summary of computational transaction
Raw Input view raw input (R code)
Raw Outputview raw output of R engine
Computing time2 seconds
R ServerBig Analytics Cloud Computing Center


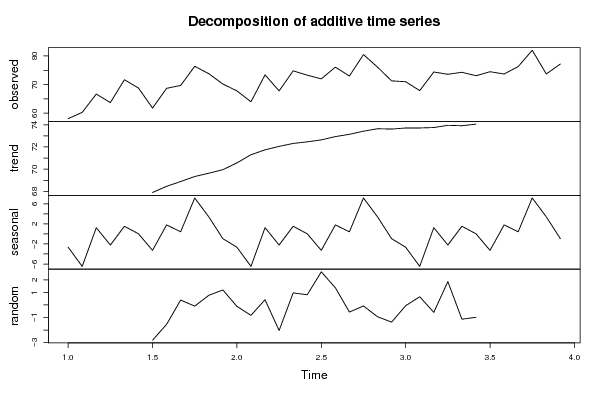
Classical Decomposition by Moving Averages
tObservationsFitTrendSeasonalRandom
158.1NANA-2.65035NA
260.3NANA-6.4691NA
366.7NANA1.23924NA
463.7NANA-2.21493NA
571.7NANA1.52049NA
668.8NANA0.0267361NA
761.864.616367.8958-3.27951-2.81632
868.770.247668.45421.7934-1.54757
969.769.312268.88750.4246530.387847
1076.476.495569.33757.15799-0.0954861
1173.873.035169.63753.397570.764931
1270.269.00869.9542-0.9461811.19201
1367.867.916370.5667-2.65035-0.116319
146464.830971.3-6.4691-0.830903
1573.472.985171.74581.239240.414931
1667.869.839272.0542-2.21493-2.03924
1774.873.841372.32081.520490.958681
1873.372.489272.46250.02673610.810764
197269.362272.6417-3.279512.63785
2076.174.730972.93751.79341.3691
217373.566373.14170.424653-0.566319
2280.580.58373.4257.15799-0.0829861
2376.177.043473.64583.39757-0.943403
2471.372.670573.6167-0.946181-1.37049
257171.062273.7125-2.65035-0.0621528
2667.967.247673.7167-6.46910.652431
2774.474.993473.75421.23924-0.593403
2873.671.739273.9542-2.214931.86076
2974.375.437273.91671.52049-1.13715
3073.174.089274.06250.0267361-0.989236
3174.5NANA-3.27951NA
3273.7NANA1.7934NA
3376.3NANA0.424653NA
3482NANA7.15799NA
3573.7NANA3.39757NA
3677.2NANA-0.946181NA

\begin{tabular}{lllllllll}
\hline
Classical Decomposition by Moving Averages \tabularnewline
t & Observations & Fit & Trend & Seasonal & Random \tabularnewline
1 & 58.1 & NA & NA & -2.65035 & NA \tabularnewline
2 & 60.3 & NA & NA & -6.4691 & NA \tabularnewline
3 & 66.7 & NA & NA & 1.23924 & NA \tabularnewline
4 & 63.7 & NA & NA & -2.21493 & NA \tabularnewline
5 & 71.7 & NA & NA & 1.52049 & NA \tabularnewline
6 & 68.8 & NA & NA & 0.0267361 & NA \tabularnewline
7 & 61.8 & 64.6163 & 67.8958 & -3.27951 & -2.81632 \tabularnewline
8 & 68.7 & 70.2476 & 68.4542 & 1.7934 & -1.54757 \tabularnewline
9 & 69.7 & 69.3122 & 68.8875 & 0.424653 & 0.387847 \tabularnewline
10 & 76.4 & 76.4955 & 69.3375 & 7.15799 & -0.0954861 \tabularnewline
11 & 73.8 & 73.0351 & 69.6375 & 3.39757 & 0.764931 \tabularnewline
12 & 70.2 & 69.008 & 69.9542 & -0.946181 & 1.19201 \tabularnewline
13 & 67.8 & 67.9163 & 70.5667 & -2.65035 & -0.116319 \tabularnewline
14 & 64 & 64.8309 & 71.3 & -6.4691 & -0.830903 \tabularnewline
15 & 73.4 & 72.9851 & 71.7458 & 1.23924 & 0.414931 \tabularnewline
16 & 67.8 & 69.8392 & 72.0542 & -2.21493 & -2.03924 \tabularnewline
17 & 74.8 & 73.8413 & 72.3208 & 1.52049 & 0.958681 \tabularnewline
18 & 73.3 & 72.4892 & 72.4625 & 0.0267361 & 0.810764 \tabularnewline
19 & 72 & 69.3622 & 72.6417 & -3.27951 & 2.63785 \tabularnewline
20 & 76.1 & 74.7309 & 72.9375 & 1.7934 & 1.3691 \tabularnewline
21 & 73 & 73.5663 & 73.1417 & 0.424653 & -0.566319 \tabularnewline
22 & 80.5 & 80.583 & 73.425 & 7.15799 & -0.0829861 \tabularnewline
23 & 76.1 & 77.0434 & 73.6458 & 3.39757 & -0.943403 \tabularnewline
24 & 71.3 & 72.6705 & 73.6167 & -0.946181 & -1.37049 \tabularnewline
25 & 71 & 71.0622 & 73.7125 & -2.65035 & -0.0621528 \tabularnewline
26 & 67.9 & 67.2476 & 73.7167 & -6.4691 & 0.652431 \tabularnewline
27 & 74.4 & 74.9934 & 73.7542 & 1.23924 & -0.593403 \tabularnewline
28 & 73.6 & 71.7392 & 73.9542 & -2.21493 & 1.86076 \tabularnewline
29 & 74.3 & 75.4372 & 73.9167 & 1.52049 & -1.13715 \tabularnewline
30 & 73.1 & 74.0892 & 74.0625 & 0.0267361 & -0.989236 \tabularnewline
31 & 74.5 & NA & NA & -3.27951 & NA \tabularnewline
32 & 73.7 & NA & NA & 1.7934 & NA \tabularnewline
33 & 76.3 & NA & NA & 0.424653 & NA \tabularnewline
34 & 82 & NA & NA & 7.15799 & NA \tabularnewline
35 & 73.7 & NA & NA & 3.39757 & NA \tabularnewline
36 & 77.2 & NA & NA & -0.946181 & NA \tabularnewline
\hline
\end{tabular}
%Source: https://freestatistics.org/blog/index.php?pk=310510&T=1

[TABLE]
[ROW][C]Classical Decomposition by Moving Averages[/C][/ROW]
[ROW][C]t[/C][C]Observations[/C][C]Fit[/C][C]Trend[/C][C]Seasonal[/C][C]Random[/C][/ROW]
[ROW][C]1[/C][C]58.1[/C][C]NA[/C][C]NA[/C][C]-2.65035[/C][C]NA[/C][/ROW]
[ROW][C]2[/C][C]60.3[/C][C]NA[/C][C]NA[/C][C]-6.4691[/C][C]NA[/C][/ROW]
[ROW][C]3[/C][C]66.7[/C][C]NA[/C][C]NA[/C][C]1.23924[/C][C]NA[/C][/ROW]
[ROW][C]4[/C][C]63.7[/C][C]NA[/C][C]NA[/C][C]-2.21493[/C][C]NA[/C][/ROW]
[ROW][C]5[/C][C]71.7[/C][C]NA[/C][C]NA[/C][C]1.52049[/C][C]NA[/C][/ROW]
[ROW][C]6[/C][C]68.8[/C][C]NA[/C][C]NA[/C][C]0.0267361[/C][C]NA[/C][/ROW]
[ROW][C]7[/C][C]61.8[/C][C]64.6163[/C][C]67.8958[/C][C]-3.27951[/C][C]-2.81632[/C][/ROW]
[ROW][C]8[/C][C]68.7[/C][C]70.2476[/C][C]68.4542[/C][C]1.7934[/C][C]-1.54757[/C][/ROW]
[ROW][C]9[/C][C]69.7[/C][C]69.3122[/C][C]68.8875[/C][C]0.424653[/C][C]0.387847[/C][/ROW]
[ROW][C]10[/C][C]76.4[/C][C]76.4955[/C][C]69.3375[/C][C]7.15799[/C][C]-0.0954861[/C][/ROW]
[ROW][C]11[/C][C]73.8[/C][C]73.0351[/C][C]69.6375[/C][C]3.39757[/C][C]0.764931[/C][/ROW]
[ROW][C]12[/C][C]70.2[/C][C]69.008[/C][C]69.9542[/C][C]-0.946181[/C][C]1.19201[/C][/ROW]
[ROW][C]13[/C][C]67.8[/C][C]67.9163[/C][C]70.5667[/C][C]-2.65035[/C][C]-0.116319[/C][/ROW]
[ROW][C]14[/C][C]64[/C][C]64.8309[/C][C]71.3[/C][C]-6.4691[/C][C]-0.830903[/C][/ROW]
[ROW][C]15[/C][C]73.4[/C][C]72.9851[/C][C]71.7458[/C][C]1.23924[/C][C]0.414931[/C][/ROW]
[ROW][C]16[/C][C]67.8[/C][C]69.8392[/C][C]72.0542[/C][C]-2.21493[/C][C]-2.03924[/C][/ROW]
[ROW][C]17[/C][C]74.8[/C][C]73.8413[/C][C]72.3208[/C][C]1.52049[/C][C]0.958681[/C][/ROW]
[ROW][C]18[/C][C]73.3[/C][C]72.4892[/C][C]72.4625[/C][C]0.0267361[/C][C]0.810764[/C][/ROW]
[ROW][C]19[/C][C]72[/C][C]69.3622[/C][C]72.6417[/C][C]-3.27951[/C][C]2.63785[/C][/ROW]
[ROW][C]20[/C][C]76.1[/C][C]74.7309[/C][C]72.9375[/C][C]1.7934[/C][C]1.3691[/C][/ROW]
[ROW][C]21[/C][C]73[/C][C]73.5663[/C][C]73.1417[/C][C]0.424653[/C][C]-0.566319[/C][/ROW]
[ROW][C]22[/C][C]80.5[/C][C]80.583[/C][C]73.425[/C][C]7.15799[/C][C]-0.0829861[/C][/ROW]
[ROW][C]23[/C][C]76.1[/C][C]77.0434[/C][C]73.6458[/C][C]3.39757[/C][C]-0.943403[/C][/ROW]
[ROW][C]24[/C][C]71.3[/C][C]72.6705[/C][C]73.6167[/C][C]-0.946181[/C][C]-1.37049[/C][/ROW]
[ROW][C]25[/C][C]71[/C][C]71.0622[/C][C]73.7125[/C][C]-2.65035[/C][C]-0.0621528[/C][/ROW]
[ROW][C]26[/C][C]67.9[/C][C]67.2476[/C][C]73.7167[/C][C]-6.4691[/C][C]0.652431[/C][/ROW]
[ROW][C]27[/C][C]74.4[/C][C]74.9934[/C][C]73.7542[/C][C]1.23924[/C][C]-0.593403[/C][/ROW]
[ROW][C]28[/C][C]73.6[/C][C]71.7392[/C][C]73.9542[/C][C]-2.21493[/C][C]1.86076[/C][/ROW]
[ROW][C]29[/C][C]74.3[/C][C]75.4372[/C][C]73.9167[/C][C]1.52049[/C][C]-1.13715[/C][/ROW]
[ROW][C]30[/C][C]73.1[/C][C]74.0892[/C][C]74.0625[/C][C]0.0267361[/C][C]-0.989236[/C][/ROW]
[ROW][C]31[/C][C]74.5[/C][C]NA[/C][C]NA[/C][C]-3.27951[/C][C]NA[/C][/ROW]
[ROW][C]32[/C][C]73.7[/C][C]NA[/C][C]NA[/C][C]1.7934[/C][C]NA[/C][/ROW]
[ROW][C]33[/C][C]76.3[/C][C]NA[/C][C]NA[/C][C]0.424653[/C][C]NA[/C][/ROW]
[ROW][C]34[/C][C]82[/C][C]NA[/C][C]NA[/C][C]7.15799[/C][C]NA[/C][/ROW]
[ROW][C]35[/C][C]73.7[/C][C]NA[/C][C]NA[/C][C]3.39757[/C][C]NA[/C][/ROW]
[ROW][C]36[/C][C]77.2[/C][C]NA[/C][C]NA[/C][C]-0.946181[/C][C]NA[/C][/ROW]
[/TABLE]
Source: https://freestatistics.org/blog/index.php?pk=310510&T=1

Globally Unique Identifier (entire table): ba.freestatistics.org/blog/index.php?pk=310510&T=1

As an alternative you can also use a QR Code:  

The GUIDs for individual cells are displayed in the table below:

Classical Decomposition by Moving Averages
tObservationsFitTrendSeasonalRandom
158.1NANA-2.65035NA
260.3NANA-6.4691NA
366.7NANA1.23924NA
463.7NANA-2.21493NA
571.7NANA1.52049NA
668.8NANA0.0267361NA
761.864.616367.8958-3.27951-2.81632
868.770.247668.45421.7934-1.54757
969.769.312268.88750.4246530.387847
1076.476.495569.33757.15799-0.0954861
1173.873.035169.63753.397570.764931
1270.269.00869.9542-0.9461811.19201
1367.867.916370.5667-2.65035-0.116319
146464.830971.3-6.4691-0.830903
1573.472.985171.74581.239240.414931
1667.869.839272.0542-2.21493-2.03924
1774.873.841372.32081.520490.958681
1873.372.489272.46250.02673610.810764
197269.362272.6417-3.279512.63785
2076.174.730972.93751.79341.3691
217373.566373.14170.424653-0.566319
2280.580.58373.4257.15799-0.0829861
2376.177.043473.64583.39757-0.943403
2471.372.670573.6167-0.946181-1.37049
257171.062273.7125-2.65035-0.0621528
2667.967.247673.7167-6.46910.652431
2774.474.993473.75421.23924-0.593403
2873.671.739273.9542-2.214931.86076
2974.375.437273.91671.52049-1.13715
3073.174.089274.06250.0267361-0.989236
3174.5NANA-3.27951NA
3273.7NANA1.7934NA
3376.3NANA0.424653NA
3482NANA7.15799NA
3573.7NANA3.39757NA
3677.2NANA-0.946181NA


Parameters (Session):
par1 = additive ; par2 = 12 ;
Parameters (R input):
par1 = additive ; par2 = 12 ;
R code (references can be found in the software module):
par2 <- '12'
par1 <- 'additive'
par2 <- as.numeric(par2)
x <- ts(x,freq=par2)
m <- decompose(x,type=par1)
m$figure
bitmap(file='test1.png')
plot(m)
dev.off()
mylagmax <- length(x)/2
bitmap(file='test2.png')
op <- par(mfrow = c(2,2))
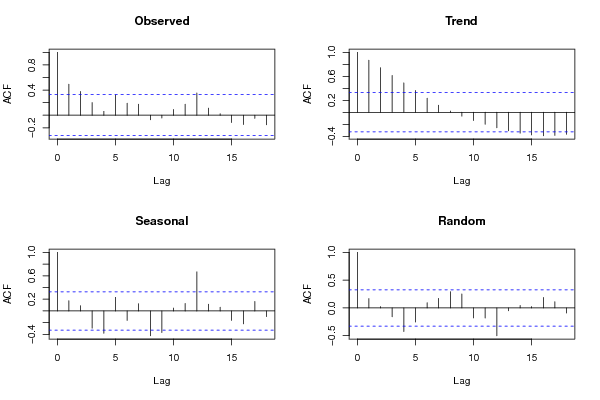
acf(as.numeric(x),lag.max = mylagmax,main='Observed')
acf(as.numeric(m$trend),na.action=na.pass,lag.max = mylagmax,main='Trend')
acf(as.numeric(m$seasonal),na.action=na.pass,lag.max = mylagmax,main='Seasonal')
acf(as.numeric(m$random),na.action=na.pass,lag.max = mylagmax,main='Random')
par(op)
dev.off()
bitmap(file='test3.png')
op <- par(mfrow = c(2,2))
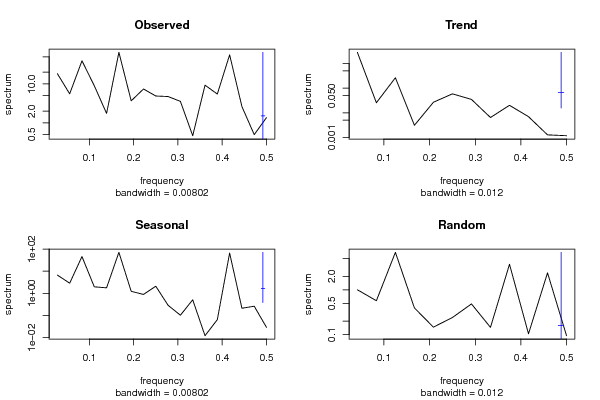
spectrum(as.numeric(x),main='Observed')
spectrum(as.numeric(m$trend[!is.na(m$trend)]),main='Trend')
spectrum(as.numeric(m$seasonal[!is.na(m$seasonal)]),main='Seasonal')
spectrum(as.numeric(m$random[!is.na(m$random)]),main='Random')
par(op)
dev.off()
bitmap(file='test4.png')
op <- par(mfrow = c(2,2))
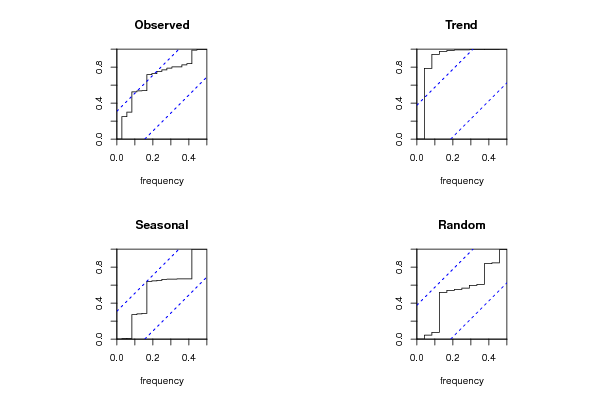
cpgram(as.numeric(x),main='Observed')
cpgram(as.numeric(m$trend[!is.na(m$trend)]),main='Trend')
cpgram(as.numeric(m$seasonal[!is.na(m$seasonal)]),main='Seasonal')
cpgram(as.numeric(m$random[!is.na(m$random)]),main='Random')
par(op)
dev.off()
load(file='createtable')
a<-table.start()
a<-table.row.start(a)
a<-table.element(a,'Classical Decomposition by Moving Averages',6,TRUE)
a<-table.row.end(a)
a<-table.row.start(a)
a<-table.element(a,'t',header=TRUE)
a<-table.element(a,'Observations',header=TRUE)
a<-table.element(a,'Fit',header=TRUE)
a<-table.element(a,'Trend',header=TRUE)
a<-table.element(a,'Seasonal',header=TRUE)
a<-table.element(a,'Random',header=TRUE)
a<-table.row.end(a)
for (i in 1:length(m$trend)) {
a<-table.row.start(a)
a<-table.element(a,i,header=TRUE)
a<-table.element(a,x[i])
if (par1 == 'additive') a<-table.element(a,signif(m$trend[i]+m$seasonal[i],6)) else a<-table.element(a,signif(m$trend[i]*m$seasonal[i],6))
a<-table.element(a,signif(m$trend[i],6))
a<-table.element(a,signif(m$seasonal[i],6))
a<-table.element(a,signif(m$random[i],6))
a<-table.row.end(a)
}
a<-table.end(a)
table.save(a,file='mytable.tab')