Free Statistics

of Irreproducible Research!

Author's title

Author*The author of this computation has been verified*
R Software Modulerwasp_qqplot.wasp
Title produced by softwareQQPlot and Histogram
Date of computationTue, 19 Dec 2017 18:54:46 +0100
Cite this page as followsStatistical Computations at FreeStatistics.org, Office for Research Development and Education, URL https://freestatistics.org/blog/index.php?v=date/2017/Dec/19/t1513706297gfpl4pf4ialtmks.htm/, Retrieved Wed, 15 May 2024 04:11:04 +0000
Statistical Computations at FreeStatistics.org, Office for Research Development and Education, URL https://freestatistics.org/blog/index.php?pk=310389, Retrieved Wed, 15 May 2024 04:11:04 +0000
QR Codes:

Original text written by user:
IsPrivate?No (this computation is public)
User-defined keywords
Estimated Impact86
Family? (F = Feedback message, R = changed R code, M = changed R Module, P = changed Parameters, D = changed Data)
-       [QQPlot and Histogram] [] [2017-12-19 17:54:46] [fda4350e119ddbaf0177fa3308cc9af4] [Current]
Feedback Forum

Post a new message
Dataseries X:
1077
120
121
121
127
129
130
131
132
132
136
137
137
141
142
144
149
152
158
159
161
189
190
192
200
208
208
216
222
242
249
290
305
306
344
610
741
782
120
124
124
125
126
127
128
131
133
135
135
137
139
140
142
142
143
145
147
148
150
153
154
157
158
175
178
178
190
191
192
192
193
195
195
207
218
219
224
227
228
234
234
242
244
259
273
286
291
343
568
134
134
138
140
142
144
155
167
177
179
179
182
210
224
248
273
293
410
430
452
454
520
586
617
659
759
924
941
Dataseries Y:
0
0
121
111
114
14
99
122
132
0
136
3
9
1
142
2
136
136
0
128
141
31
6
0
164
0
0
0
184
11
3
275
276
40
335
449
470
782
47
1
0
101
0
4
0
120
0
5
24
81
24
18
0
0
0
88
21
27
108
21
152
0
17
0
17
21
188
167
178
71
14
19
16
0
218
30
9
0
209
0
108
0
0
240
0
33
5
0
104
43
75
114
119
112
131
138
147
0
3
0
4
201
201
9
255
0
11
415
0
451
520
556
407
644
0
15
917


Summary of computational transaction
Raw Input view raw input (R code)
Raw Outputview raw output of R engine
Computing time4 seconds
R ServerBig Analytics Cloud Computing Center

\begin{tabular}{lllllllll}
\hline
Summary of computational transaction \tabularnewline
Raw Input view raw input (R code)  \tabularnewline
Raw Outputview raw output of R engine  \tabularnewline
Computing time4 seconds \tabularnewline
R ServerBig Analytics Cloud Computing Center \tabularnewline
\hline
\end{tabular}
%Source: https://freestatistics.org/blog/index.php?pk=310389&T=0

[TABLE]
[ROW]
Summary of computational transaction[/C][/ROW] [ROW]Raw Input[/C] view raw input (R code) [/C][/ROW] [ROW]Raw Output[/C]view raw output of R engine [/C][/ROW] [ROW]Computing time[/C]4 seconds[/C][/ROW] [ROW]R Server[/C]Big Analytics Cloud Computing Center[/C][/ROW] [/TABLE] Source: https://freestatistics.org/blog/index.php?pk=310389&T=0

Globally Unique Identifier (entire table): ba.freestatistics.org/blog/index.php?pk=310389&T=0

As an alternative you can also use a QR Code:  

The GUIDs for individual cells are displayed in the table below:

Summary of computational transaction
Raw Input view raw input (R code)
Raw Outputview raw output of R engine
Computing time4 seconds
R ServerBig Analytics Cloud Computing Center


Descriptive Statistics
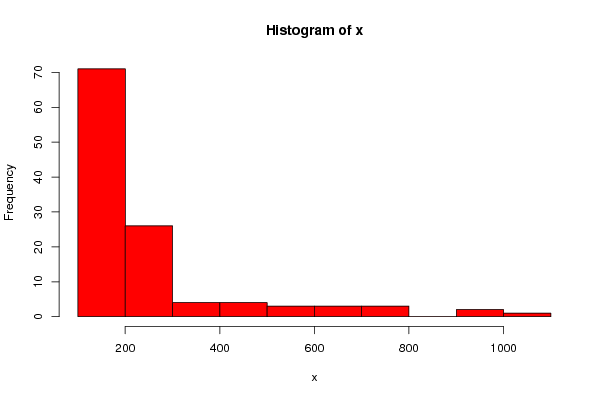
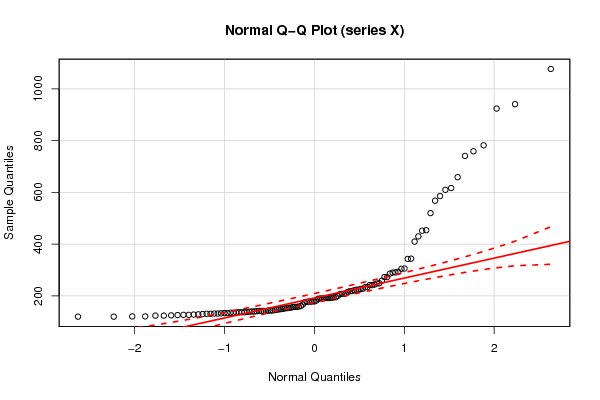
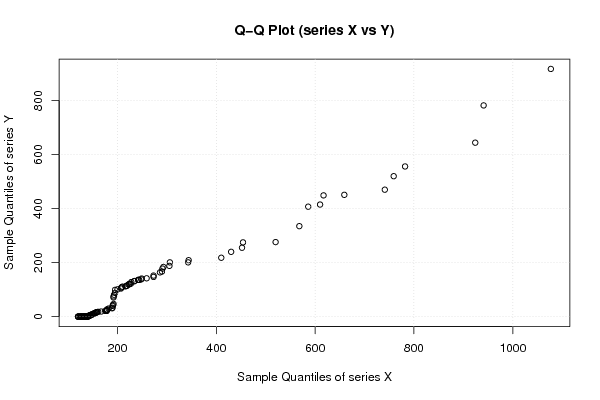
mean of X246.495726495727
standard deviation of X186.437824707273
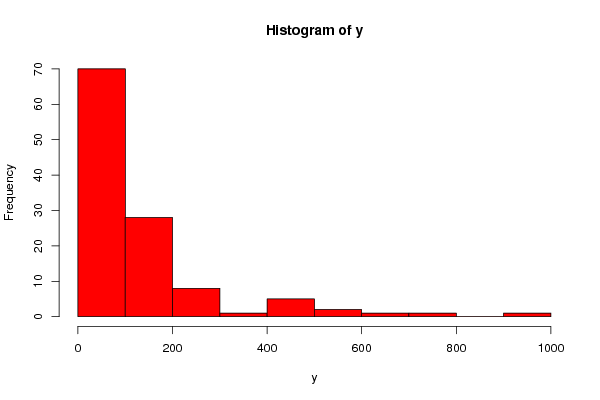
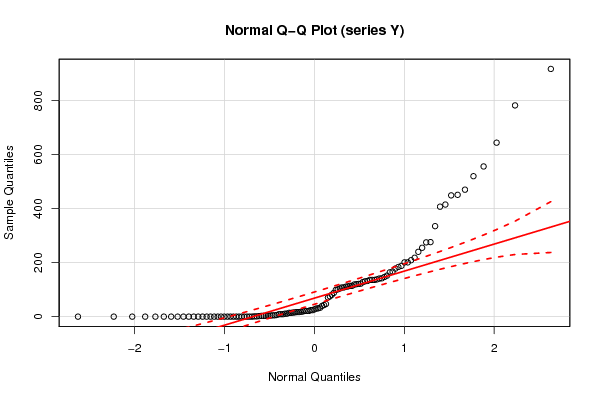
mean of Y107.410256410256
standard deviation of Y165.775770548038

\begin{tabular}{lllllllll}
\hline
Descriptive Statistics \tabularnewline
mean of X & 246.495726495727 \tabularnewline
standard deviation of X & 186.437824707273 \tabularnewline
mean of Y & 107.410256410256 \tabularnewline
standard deviation of Y & 165.775770548038 \tabularnewline
\hline
\end{tabular}
%Source: https://freestatistics.org/blog/index.php?pk=310389&T=1

[TABLE]
[ROW][C]Descriptive Statistics[/C][/ROW]
[ROW][C]mean of X[/C][C]246.495726495727[/C][/ROW]
[ROW][C]standard deviation of X[/C][C]186.437824707273[/C][/ROW]
[ROW][C]mean of Y[/C][C]107.410256410256[/C][/ROW]
[ROW][C]standard deviation of Y[/C][C]165.775770548038[/C][/ROW]
[/TABLE]
Source: https://freestatistics.org/blog/index.php?pk=310389&T=1

Globally Unique Identifier (entire table): ba.freestatistics.org/blog/index.php?pk=310389&T=1

As an alternative you can also use a QR Code:  

The GUIDs for individual cells are displayed in the table below:

Descriptive Statistics
mean of X246.495726495727
standard deviation of X186.437824707273
mean of Y107.410256410256
standard deviation of Y165.775770548038


Parameters (Session):
par1 = kendall ;
Parameters (R input):
par1 = 0 ;
R code (references can be found in the software module):
par1 <- '0'
library(car)
if(par1 == '') par1 <- 0
par1 <- as.numeric(par1)
if (par1 < 0) par1 <- 0
bitmap(file='test1.png')
if(par1 > 0) {
myhist<-hist(x, breaks=par1, col=2,main='Histogram (series X)')
} else {
myhist <- hist(x, col=2)
}
dev.off()
bitmap(file='test1a.png')
if(par1 > 0) {
myhist<-hist(y, breaks=par1, col=2,main='Histogram (series Y)')
} else {
myhist <- hist(y, col=2)
}
dev.off()
bitmap(file='test2.png')
qqPlot(x,main='Normal Q-Q Plot (series X)',ylab='Sample Quantiles',xlab='Normal Quantiles')
dev.off()
bitmap(file='test2a.png')
qqPlot(y,main='Normal Q-Q Plot (series Y)',ylab='Sample Quantiles',xlab='Normal Quantiles')
dev.off()
bitmap(file='test3.png')
qqplot(x,y,main='Q-Q Plot (series X vs Y)',ylab='Sample Quantiles of series Y',xlab='Sample Quantiles of series X')
qqline(x,y)
grid()
dev.off()
load(file='createtable')
a<-table.start()
a<-table.row.start(a)
a<-table.element(a,'Descriptive Statistics',2,TRUE)
a<-table.row.end(a)
a<-table.row.start(a)
a<-table.element(a,'mean of X',header=TRUE)
a<-table.element(a,mean(x))
a<-table.row.end(a)
a<-table.row.start(a)
a<-table.element(a,'standard deviation of X',header=TRUE)
a<-table.element(a,sd(x))
a<-table.row.end(a)
a<-table.row.start(a)
a<-table.element(a,'mean of Y',header=TRUE)
a<-table.element(a,mean(y))
a<-table.row.end(a)
a<-table.row.start(a)
a<-table.element(a,'standard deviation of Y',header=TRUE)
a<-table.element(a,sd(y))
a<-table.row.end(a)
a<-table.end(a)
table.save(a,file='mytable.tab')