Free Statistics

of Irreproducible Research!

Author's title

Author*The author of this computation has been verified*
R Software Modulerwasp_autocorrelation.wasp
Title produced by software(Partial) Autocorrelation Function
Date of computationTue, 19 Dec 2017 17:03:15 +0100
Cite this page as followsStatistical Computations at FreeStatistics.org, Office for Research Development and Education, URL https://freestatistics.org/blog/index.php?v=date/2017/Dec/19/t1513699423spbeic30hfwezr8.htm/, Retrieved Wed, 15 May 2024 11:53:25 +0000
Statistical Computations at FreeStatistics.org, Office for Research Development and Education, URL https://freestatistics.org/blog/index.php?pk=310366, Retrieved Wed, 15 May 2024 11:53:25 +0000
QR Codes:

Original text written by user:
IsPrivate?No (this computation is public)
User-defined keywords
Estimated Impact61
Family? (F = Feedback message, R = changed R code, M = changed R Module, P = changed Parameters, D = changed Data)
-       [(Partial) Autocorrelation Function] [n] [2017-12-19 16:03:15] [a98cfedcb2213d624216c666f97af8d4] [Current]
Feedback Forum

Post a new message
Dataseries X:
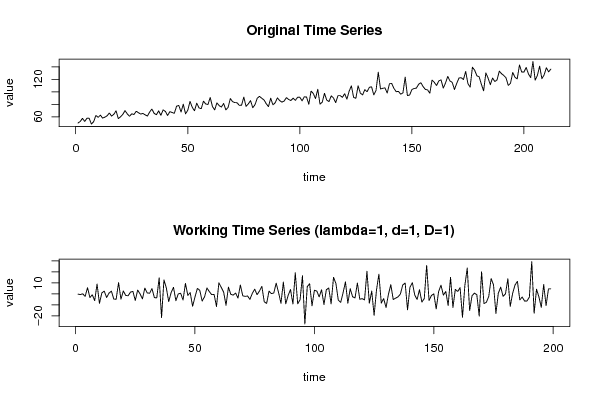
50
52.4
57.5
52.5
57.5
57.6
48.3
52
62.1
59.1
62.6
57.9
59.3
61.5
66
61.1
63.8
69.6
57
59.9
63.8
69.8
64.6
60.8
64.7
63.6
68.8
66.4
64.4
65.3
63
61.1
67.7
72.3
65.4
63.2
69.4
62.3
71
68.6
62
68.2
66.8
65.5
76.9
78.1
67.6
80.1
64.7
70.4
84.6
75.1
69.6
81.8
74.2
72.9
84.9
80.5
79.6
90.8
76.5
70.9
82.3
77.8
75.6
81.3
71
75.1
89.2
84.1
82.7
82.4
78.2
78.5
91.5
76.6
80.6
85.9
74.5
79.4
89.7
92.7
89.6
87
80.9
76.2
89.7
79.1
82.4
90.3
85.8
83.5
85.1
90.6
87.7
86
89.7
86.2
91.1
91.3
85.5
92
91.5
80
100.9
97.3
89.1
104
80.2
83.3
97.5
86.8
84.3
93.4
90.2
82.5
93.7
93.9
91.1
96.9
88.2
100.9
109.5
91
89.5
109.6
97.9
94.9
103.5
100
107.1
108
95
102.2
131.4
104.5
105.6
106.1
98
113
113.2
105.4
100.1
100.7
96.1
98.2
123.5
93.9
94.8
103.5
105.3
105.8
112
114.5
108.3
103.8
103
97.7
118.7
115.1
110
117.3
119.1
105.9
114.1
124.6
117.3
115
103.6
113.4
122
122.5
119.6
132.6
113
107.5
139.3
134.6
125.6
124
111.9
101.5
130.2
121.9
111.3
122
116.4
119.1
133
128.9
126.1
122.3
110.2
113.6
131
123.2
120.7
142.8
131.7
131.6
139
128.5
122.7
148.4
118.6
126.3
141
120.9
127
138.5
131.9
136.3


Summary of computational transaction
Raw Input view raw input (R code)
Raw Outputview raw output of R engine
Computing time1 seconds
R ServerBig Analytics Cloud Computing Center

\begin{tabular}{lllllllll}
\hline
Summary of computational transaction \tabularnewline
Raw Input view raw input (R code)  \tabularnewline
Raw Outputview raw output of R engine  \tabularnewline
Computing time1 seconds \tabularnewline
R ServerBig Analytics Cloud Computing Center \tabularnewline
\hline
\end{tabular}
%Source: https://freestatistics.org/blog/index.php?pk=310366&T=0

[TABLE]
[ROW]
Summary of computational transaction[/C][/ROW] [ROW]Raw Input[/C] view raw input (R code) [/C][/ROW] [ROW]Raw Output[/C]view raw output of R engine [/C][/ROW] [ROW]Computing time[/C]1 seconds[/C][/ROW] [ROW]R Server[/C]Big Analytics Cloud Computing Center[/C][/ROW] [/TABLE] Source: https://freestatistics.org/blog/index.php?pk=310366&T=0

Globally Unique Identifier (entire table): ba.freestatistics.org/blog/index.php?pk=310366&T=0

As an alternative you can also use a QR Code:  

The GUIDs for individual cells are displayed in the table below:

Summary of computational transaction
Raw Input view raw input (R code)
Raw Outputview raw output of R engine
Computing time1 seconds
R ServerBig Analytics Cloud Computing Center


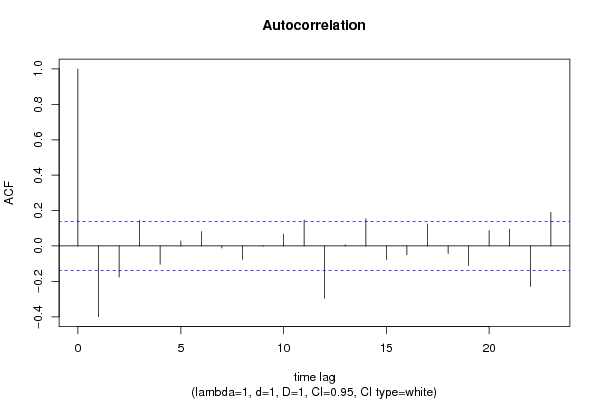
Autocorrelation Function
Time lag kACF(k)T-STATP-value
1-0.399179-5.63110
2-0.174985-2.46850.007206
30.142232.00640.023084
4-0.102485-1.44570.074913
50.0286480.40410.343275
60.0811731.14510.126774
7-0.01136-0.16020.436424
8-0.075905-1.07080.142785
9-0.001176-0.01660.493389
100.0667420.94150.173791
110.1464072.06530.020094
12-0.295165-4.16382.3e-05
130.0073850.10420.458565
140.1539582.17180.015525
15-0.076003-1.07220.142475
16-0.048983-0.6910.245187
170.1239421.74840.040967
18-0.04282-0.6040.273251
19-0.11013-1.55360.060937
200.0868351.2250.111018
210.094921.3390.091047
22-0.228365-3.22150.000745
230.1908782.69270.003846

\begin{tabular}{lllllllll}
\hline
Autocorrelation Function \tabularnewline
Time lag k & ACF(k) & T-STAT & P-value \tabularnewline
1 & -0.399179 & -5.6311 & 0 \tabularnewline
2 & -0.174985 & -2.4685 & 0.007206 \tabularnewline
3 & 0.14223 & 2.0064 & 0.023084 \tabularnewline
4 & -0.102485 & -1.4457 & 0.074913 \tabularnewline
5 & 0.028648 & 0.4041 & 0.343275 \tabularnewline
6 & 0.081173 & 1.1451 & 0.126774 \tabularnewline
7 & -0.01136 & -0.1602 & 0.436424 \tabularnewline
8 & -0.075905 & -1.0708 & 0.142785 \tabularnewline
9 & -0.001176 & -0.0166 & 0.493389 \tabularnewline
10 & 0.066742 & 0.9415 & 0.173791 \tabularnewline
11 & 0.146407 & 2.0653 & 0.020094 \tabularnewline
12 & -0.295165 & -4.1638 & 2.3e-05 \tabularnewline
13 & 0.007385 & 0.1042 & 0.458565 \tabularnewline
14 & 0.153958 & 2.1718 & 0.015525 \tabularnewline
15 & -0.076003 & -1.0722 & 0.142475 \tabularnewline
16 & -0.048983 & -0.691 & 0.245187 \tabularnewline
17 & 0.123942 & 1.7484 & 0.040967 \tabularnewline
18 & -0.04282 & -0.604 & 0.273251 \tabularnewline
19 & -0.11013 & -1.5536 & 0.060937 \tabularnewline
20 & 0.086835 & 1.225 & 0.111018 \tabularnewline
21 & 0.09492 & 1.339 & 0.091047 \tabularnewline
22 & -0.228365 & -3.2215 & 0.000745 \tabularnewline
23 & 0.190878 & 2.6927 & 0.003846 \tabularnewline
\hline
\end{tabular}
%Source: https://freestatistics.org/blog/index.php?pk=310366&T=1

[TABLE]
[ROW][C]Autocorrelation Function[/C][/ROW]
[ROW][C]Time lag k[/C][C]ACF(k)[/C][C]T-STAT[/C][C]P-value[/C][/ROW]
[ROW][C]1[/C][C]-0.399179[/C][C]-5.6311[/C][C]0[/C][/ROW]
[ROW][C]2[/C][C]-0.174985[/C][C]-2.4685[/C][C]0.007206[/C][/ROW]
[ROW][C]3[/C][C]0.14223[/C][C]2.0064[/C][C]0.023084[/C][/ROW]
[ROW][C]4[/C][C]-0.102485[/C][C]-1.4457[/C][C]0.074913[/C][/ROW]
[ROW][C]5[/C][C]0.028648[/C][C]0.4041[/C][C]0.343275[/C][/ROW]
[ROW][C]6[/C][C]0.081173[/C][C]1.1451[/C][C]0.126774[/C][/ROW]
[ROW][C]7[/C][C]-0.01136[/C][C]-0.1602[/C][C]0.436424[/C][/ROW]
[ROW][C]8[/C][C]-0.075905[/C][C]-1.0708[/C][C]0.142785[/C][/ROW]
[ROW][C]9[/C][C]-0.001176[/C][C]-0.0166[/C][C]0.493389[/C][/ROW]
[ROW][C]10[/C][C]0.066742[/C][C]0.9415[/C][C]0.173791[/C][/ROW]
[ROW][C]11[/C][C]0.146407[/C][C]2.0653[/C][C]0.020094[/C][/ROW]
[ROW][C]12[/C][C]-0.295165[/C][C]-4.1638[/C][C]2.3e-05[/C][/ROW]
[ROW][C]13[/C][C]0.007385[/C][C]0.1042[/C][C]0.458565[/C][/ROW]
[ROW][C]14[/C][C]0.153958[/C][C]2.1718[/C][C]0.015525[/C][/ROW]
[ROW][C]15[/C][C]-0.076003[/C][C]-1.0722[/C][C]0.142475[/C][/ROW]
[ROW][C]16[/C][C]-0.048983[/C][C]-0.691[/C][C]0.245187[/C][/ROW]
[ROW][C]17[/C][C]0.123942[/C][C]1.7484[/C][C]0.040967[/C][/ROW]
[ROW][C]18[/C][C]-0.04282[/C][C]-0.604[/C][C]0.273251[/C][/ROW]
[ROW][C]19[/C][C]-0.11013[/C][C]-1.5536[/C][C]0.060937[/C][/ROW]
[ROW][C]20[/C][C]0.086835[/C][C]1.225[/C][C]0.111018[/C][/ROW]
[ROW][C]21[/C][C]0.09492[/C][C]1.339[/C][C]0.091047[/C][/ROW]
[ROW][C]22[/C][C]-0.228365[/C][C]-3.2215[/C][C]0.000745[/C][/ROW]
[ROW][C]23[/C][C]0.190878[/C][C]2.6927[/C][C]0.003846[/C][/ROW]
[/TABLE]
Source: https://freestatistics.org/blog/index.php?pk=310366&T=1

Globally Unique Identifier (entire table): ba.freestatistics.org/blog/index.php?pk=310366&T=1

As an alternative you can also use a QR Code:  

The GUIDs for individual cells are displayed in the table below:

Autocorrelation Function
Time lag kACF(k)T-STATP-value
1-0.399179-5.63110
2-0.174985-2.46850.007206
30.142232.00640.023084
4-0.102485-1.44570.074913
50.0286480.40410.343275
60.0811731.14510.126774
7-0.01136-0.16020.436424
8-0.075905-1.07080.142785
9-0.001176-0.01660.493389
100.0667420.94150.173791
110.1464072.06530.020094
12-0.295165-4.16382.3e-05
130.0073850.10420.458565
140.1539582.17180.015525
15-0.076003-1.07220.142475
16-0.048983-0.6910.245187
170.1239421.74840.040967
18-0.04282-0.6040.273251
19-0.11013-1.55360.060937
200.0868351.2250.111018
210.094921.3390.091047
22-0.228365-3.22150.000745
230.1908782.69270.003846


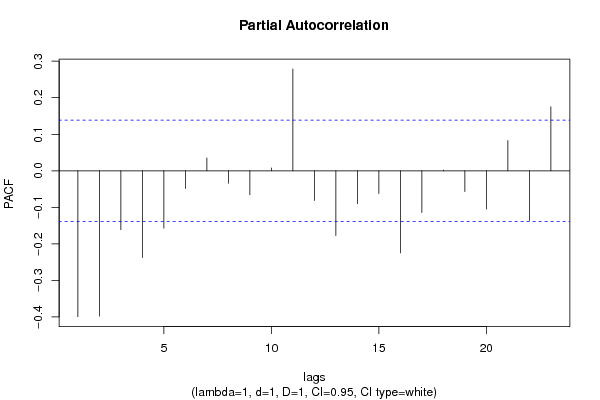
Partial Autocorrelation Function
Time lag kPACF(k)T-STATP-value
1-0.399179-5.63110
2-0.3977-5.61030
3-0.161304-2.27550.011972
4-0.237545-3.3510.000482
5-0.156979-2.21450.013966
6-0.048239-0.68050.24849
70.0348390.49150.311819
8-0.03406-0.48050.315706
9-0.065491-0.92390.178337
100.0075510.10650.457637
110.2787573.93245.8e-05
12-0.081377-1.1480.12618
13-0.176937-2.4960.006686
14-0.090351-1.27460.101975
15-0.062077-0.87570.191124
16-0.22464-3.16890.000886
17-0.114257-1.61180.054296
180.0018260.02580.489739
19-0.056568-0.7980.212913
20-0.104783-1.47810.070475
210.0825321.16430.122857
22-0.136211-1.92150.028049
230.1753492.47360.007107

\begin{tabular}{lllllllll}
\hline
Partial Autocorrelation Function \tabularnewline
Time lag k & PACF(k) & T-STAT & P-value \tabularnewline
1 & -0.399179 & -5.6311 & 0 \tabularnewline
2 & -0.3977 & -5.6103 & 0 \tabularnewline
3 & -0.161304 & -2.2755 & 0.011972 \tabularnewline
4 & -0.237545 & -3.351 & 0.000482 \tabularnewline
5 & -0.156979 & -2.2145 & 0.013966 \tabularnewline
6 & -0.048239 & -0.6805 & 0.24849 \tabularnewline
7 & 0.034839 & 0.4915 & 0.311819 \tabularnewline
8 & -0.03406 & -0.4805 & 0.315706 \tabularnewline
9 & -0.065491 & -0.9239 & 0.178337 \tabularnewline
10 & 0.007551 & 0.1065 & 0.457637 \tabularnewline
11 & 0.278757 & 3.9324 & 5.8e-05 \tabularnewline
12 & -0.081377 & -1.148 & 0.12618 \tabularnewline
13 & -0.176937 & -2.496 & 0.006686 \tabularnewline
14 & -0.090351 & -1.2746 & 0.101975 \tabularnewline
15 & -0.062077 & -0.8757 & 0.191124 \tabularnewline
16 & -0.22464 & -3.1689 & 0.000886 \tabularnewline
17 & -0.114257 & -1.6118 & 0.054296 \tabularnewline
18 & 0.001826 & 0.0258 & 0.489739 \tabularnewline
19 & -0.056568 & -0.798 & 0.212913 \tabularnewline
20 & -0.104783 & -1.4781 & 0.070475 \tabularnewline
21 & 0.082532 & 1.1643 & 0.122857 \tabularnewline
22 & -0.136211 & -1.9215 & 0.028049 \tabularnewline
23 & 0.175349 & 2.4736 & 0.007107 \tabularnewline
\hline
\end{tabular}
%Source: https://freestatistics.org/blog/index.php?pk=310366&T=2

[TABLE]
[ROW][C]Partial Autocorrelation Function[/C][/ROW]
[ROW][C]Time lag k[/C][C]PACF(k)[/C][C]T-STAT[/C][C]P-value[/C][/ROW]
[ROW][C]1[/C][C]-0.399179[/C][C]-5.6311[/C][C]0[/C][/ROW]
[ROW][C]2[/C][C]-0.3977[/C][C]-5.6103[/C][C]0[/C][/ROW]
[ROW][C]3[/C][C]-0.161304[/C][C]-2.2755[/C][C]0.011972[/C][/ROW]
[ROW][C]4[/C][C]-0.237545[/C][C]-3.351[/C][C]0.000482[/C][/ROW]
[ROW][C]5[/C][C]-0.156979[/C][C]-2.2145[/C][C]0.013966[/C][/ROW]
[ROW][C]6[/C][C]-0.048239[/C][C]-0.6805[/C][C]0.24849[/C][/ROW]
[ROW][C]7[/C][C]0.034839[/C][C]0.4915[/C][C]0.311819[/C][/ROW]
[ROW][C]8[/C][C]-0.03406[/C][C]-0.4805[/C][C]0.315706[/C][/ROW]
[ROW][C]9[/C][C]-0.065491[/C][C]-0.9239[/C][C]0.178337[/C][/ROW]
[ROW][C]10[/C][C]0.007551[/C][C]0.1065[/C][C]0.457637[/C][/ROW]
[ROW][C]11[/C][C]0.278757[/C][C]3.9324[/C][C]5.8e-05[/C][/ROW]
[ROW][C]12[/C][C]-0.081377[/C][C]-1.148[/C][C]0.12618[/C][/ROW]
[ROW][C]13[/C][C]-0.176937[/C][C]-2.496[/C][C]0.006686[/C][/ROW]
[ROW][C]14[/C][C]-0.090351[/C][C]-1.2746[/C][C]0.101975[/C][/ROW]
[ROW][C]15[/C][C]-0.062077[/C][C]-0.8757[/C][C]0.191124[/C][/ROW]
[ROW][C]16[/C][C]-0.22464[/C][C]-3.1689[/C][C]0.000886[/C][/ROW]
[ROW][C]17[/C][C]-0.114257[/C][C]-1.6118[/C][C]0.054296[/C][/ROW]
[ROW][C]18[/C][C]0.001826[/C][C]0.0258[/C][C]0.489739[/C][/ROW]
[ROW][C]19[/C][C]-0.056568[/C][C]-0.798[/C][C]0.212913[/C][/ROW]
[ROW][C]20[/C][C]-0.104783[/C][C]-1.4781[/C][C]0.070475[/C][/ROW]
[ROW][C]21[/C][C]0.082532[/C][C]1.1643[/C][C]0.122857[/C][/ROW]
[ROW][C]22[/C][C]-0.136211[/C][C]-1.9215[/C][C]0.028049[/C][/ROW]
[ROW][C]23[/C][C]0.175349[/C][C]2.4736[/C][C]0.007107[/C][/ROW]
[/TABLE]
Source: https://freestatistics.org/blog/index.php?pk=310366&T=2

Globally Unique Identifier (entire table): ba.freestatistics.org/blog/index.php?pk=310366&T=2

As an alternative you can also use a QR Code:  

The GUIDs for individual cells are displayed in the table below:

Partial Autocorrelation Function
Time lag kPACF(k)T-STATP-value
1-0.399179-5.63110
2-0.3977-5.61030
3-0.161304-2.27550.011972
4-0.237545-3.3510.000482
5-0.156979-2.21450.013966
6-0.048239-0.68050.24849
70.0348390.49150.311819
8-0.03406-0.48050.315706
9-0.065491-0.92390.178337
100.0075510.10650.457637
110.2787573.93245.8e-05
12-0.081377-1.1480.12618
13-0.176937-2.4960.006686
14-0.090351-1.27460.101975
15-0.062077-0.87570.191124
16-0.22464-3.16890.000886
17-0.114257-1.61180.054296
180.0018260.02580.489739
19-0.056568-0.7980.212913
20-0.104783-1.47810.070475
210.0825321.16430.122857
22-0.136211-1.92150.028049
230.1753492.47360.007107


Parameters (Session):
par1 = Default ; par2 = 1 ; par3 = 1 ; par4 = 1 ; par5 = 12 ; par6 = White Noise ; par7 = 0.95 ;
Parameters (R input):
par1 = Default ; par2 = 1 ; par3 = 1 ; par4 = 1 ; par5 = 12 ; par6 = White Noise ; par7 = 0.95 ; par8 = ;
R code (references can be found in the software module):
if (par1 == 'Default') {
par1 = 10*log10(length(x))
} else {
par1 <- as.numeric(par1)
}
par2 <- as.numeric(par2)
par3 <- as.numeric(par3)
par4 <- as.numeric(par4)
par5 <- as.numeric(par5)
if (par6 == 'White Noise') par6 <- 'white' else par6 <- 'ma'
par7 <- as.numeric(par7)
if (par8 != '') par8 <- as.numeric(par8)
x <- na.omit(x)
ox <- x
if (par8 == '') {
if (par2 == 0) {
x <- log(x)
} else {
x <- (x ^ par2 - 1) / par2
}
} else {
x <- log(x,base=par8)
}
if (par3 > 0) x <- diff(x,lag=1,difference=par3)
if (par4 > 0) x <- diff(x,lag=par5,difference=par4)
bitmap(file='picts.png')
op <- par(mfrow=c(2,1))
plot(ox,type='l',main='Original Time Series',xlab='time',ylab='value')
if (par8=='') {
mytitle <- paste('Working Time Series (lambda=',par2,', d=',par3,', D=',par4,')',sep='')
mysub <- paste('(lambda=',par2,', d=',par3,', D=',par4,', CI=', par7, ', CI type=',par6,')',sep='')
} else {
mytitle <- paste('Working Time Series (base=',par8,', d=',par3,', D=',par4,')',sep='')
mysub <- paste('(base=',par8,', d=',par3,', D=',par4,', CI=', par7, ', CI type=',par6,')',sep='')
}
plot(x,type='l', main=mytitle,xlab='time',ylab='value')
par(op)
dev.off()
bitmap(file='pic1.png')
racf <- acf(x, par1, main='Autocorrelation', xlab='time lag', ylab='ACF', ci.type=par6, ci=par7, sub=mysub)
dev.off()
bitmap(file='pic2.png')
rpacf <- pacf(x,par1,main='Partial Autocorrelation',xlab='lags',ylab='PACF',sub=mysub)
dev.off()
(myacf <- c(racf$acf))
(mypacf <- c(rpacf$acf))
lengthx <- length(x)
sqrtn <- sqrt(lengthx)
load(file='createtable')
a<-table.start()
a<-table.row.start(a)
a<-table.element(a,'Autocorrelation Function',4,TRUE)
a<-table.row.end(a)
a<-table.row.start(a)
a<-table.element(a,'Time lag k',header=TRUE)
a<-table.element(a,'ACF(k)',header=TRUE)
a<-table.element(a,'T-STAT',header=TRUE)
a<-table.element(a,'P-value',header=TRUE)
a<-table.row.end(a)
for (i in 2:(par1+1)) {
a<-table.row.start(a)
a<-table.element(a,i-1,header=TRUE)
a<-table.element(a,round(myacf[i],6))
mytstat <- myacf[i]*sqrtn
a<-table.element(a,round(mytstat,4))
a<-table.element(a,round(1-pt(abs(mytstat),lengthx),6))
a<-table.row.end(a)
}
a<-table.end(a)
table.save(a,file='mytable.tab')
a<-table.start()
a<-table.row.start(a)
a<-table.element(a,'Partial Autocorrelation Function',4,TRUE)
a<-table.row.end(a)
a<-table.row.start(a)
a<-table.element(a,'Time lag k',header=TRUE)
a<-table.element(a,'PACF(k)',header=TRUE)
a<-table.element(a,'T-STAT',header=TRUE)
a<-table.element(a,'P-value',header=TRUE)
a<-table.row.end(a)
for (i in 1:par1) {
a<-table.row.start(a)
a<-table.element(a,i,header=TRUE)
a<-table.element(a,round(mypacf[i],6))
mytstat <- mypacf[i]*sqrtn
a<-table.element(a,round(mytstat,4))
a<-table.element(a,round(1-pt(abs(mytstat),lengthx),6))
a<-table.row.end(a)
}
a<-table.end(a)
table.save(a,file='mytable1.tab')