Free Statistics

of Irreproducible Research!

Author's title

Author*The author of this computation has been verified*
R Software Modulerwasp_autocorrelation.wasp
Title produced by software(Partial) Autocorrelation Function
Date of computationTue, 19 Dec 2017 15:58:42 +0100
Cite this page as followsStatistical Computations at FreeStatistics.org, Office for Research Development and Education, URL https://freestatistics.org/blog/index.php?v=date/2017/Dec/19/t1513695632c4s3z7n3o3qv702.htm/, Retrieved Wed, 15 May 2024 01:00:44 +0000
Statistical Computations at FreeStatistics.org, Office for Research Development and Education, URL https://freestatistics.org/blog/index.php?pk=310358, Retrieved Wed, 15 May 2024 01:00:44 +0000
QR Codes:

Original text written by user:
IsPrivate?No (this computation is public)
User-defined keywords
Estimated Impact104
Family? (F = Feedback message, R = changed R code, M = changed R Module, P = changed Parameters, D = changed Data)
-       [(Partial) Autocorrelation Function] [Non-durable consu...] [2017-12-19 14:58:42] [a98cfedcb2213d624216c666f97af8d4] [Current]
Feedback Forum

Post a new message
Dataseries X:
50
52.4
57.5
52.5
57.5
57.6
48.3
52
62.1
59.1
62.6
57.9
59.3
61.5
66
61.1
63.8
69.6
57
59.9
63.8
69.8
64.6
60.8
64.7
63.6
68.8
66.4
64.4
65.3
63
61.1
67.7
72.3
65.4
63.2
69.4
62.3
71
68.6
62
68.2
66.8
65.5
76.9
78.1
67.6
80.1
64.7
70.4
84.6
75.1
69.6
81.8
74.2
72.9
84.9
80.5
79.6
90.8
76.5
70.9
82.3
77.8
75.6
81.3
71
75.1
89.2
84.1
82.7
82.4
78.2
78.5
91.5
76.6
80.6
85.9
74.5
79.4
89.7
92.7
89.6
87
80.9
76.2
89.7
79.1
82.4
90.3
85.8
83.5
85.1
90.6
87.7
86
89.7
86.2
91.1
91.3
85.5
92
91.5
80
100.9
97.3
89.1
104
80.2
83.3
97.5
86.8
84.3
93.4
90.2
82.5
93.7
93.9
91.1
96.9
88.2
100.9
109.5
91
89.5
109.6
97.9
94.9
103.5
100
107.1
108
95
102.2
131.4
104.5
105.6
106.1
98
113
113.2
105.4
100.1
100.7
96.1
98.2
123.5
93.9
94.8
103.5
105.3
105.8
112
114.5
108.3
103.8
103
97.7
118.7
115.1
110
117.3
119.1
105.9
114.1
124.6
117.3
115
103.6
113.4
122
122.5
119.6
132.6
113
107.5
139.3
134.6
125.6
124
111.9
101.5
130.2
121.9
111.3
122
116.4
119.1
133
128.9
126.1
122.3
110.2
113.6
131
123.2
120.7
142.8
131.7
131.6
139
128.5
122.7
148.4
118.6
126.3
141
120.9
127
138.5
131.9
136.3


Summary of computational transaction
Raw Input view raw input (R code)
Raw Outputview raw output of R engine
Computing time2 seconds
R ServerBig Analytics Cloud Computing Center

\begin{tabular}{lllllllll}
\hline
Summary of computational transaction \tabularnewline
Raw Input view raw input (R code)  \tabularnewline
Raw Outputview raw output of R engine  \tabularnewline
Computing time2 seconds \tabularnewline
R ServerBig Analytics Cloud Computing Center \tabularnewline
\hline
\end{tabular}
%Source: https://freestatistics.org/blog/index.php?pk=310358&T=0

[TABLE]
[ROW]
Summary of computational transaction[/C][/ROW] [ROW]Raw Input[/C] view raw input (R code) [/C][/ROW] [ROW]Raw Output[/C]view raw output of R engine [/C][/ROW] [ROW]Computing time[/C]2 seconds[/C][/ROW] [ROW]R Server[/C]Big Analytics Cloud Computing Center[/C][/ROW] [/TABLE] Source: https://freestatistics.org/blog/index.php?pk=310358&T=0

Globally Unique Identifier (entire table): ba.freestatistics.org/blog/index.php?pk=310358&T=0

As an alternative you can also use a QR Code:  

The GUIDs for individual cells are displayed in the table below:

Summary of computational transaction
Raw Input view raw input (R code)
Raw Outputview raw output of R engine
Computing time2 seconds
R ServerBig Analytics Cloud Computing Center


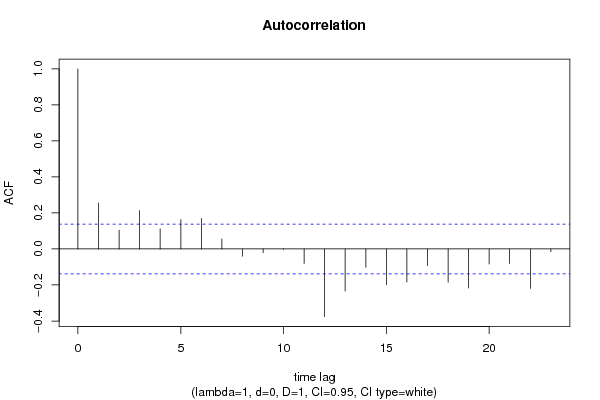
Autocorrelation Function
Time lag kACF(k)T-STATP-value
10.2550683.60720.000195
20.1040971.47220.071276
30.2137573.0230.001415
40.1116221.57860.058007
50.1631432.30720.011034
60.1691562.39220.008836
70.0559470.79120.214879
8-0.039918-0.56450.286513
9-0.020143-0.28490.388023
10-0.002467-0.03490.486101
11-0.080007-1.13150.129606
12-0.375859-5.31550
13-0.23389-3.30770.000558
14-0.101357-1.43340.076652
15-0.198225-2.80330.002778
16-0.183035-2.58850.005174
17-0.092626-1.30990.095861
18-0.184253-2.60570.004929
19-0.21722-3.0720.001211
20-0.083882-1.18630.118461
21-0.081014-1.14570.126642
22-0.218724-3.09320.001131
23-0.015836-0.2240.411511

\begin{tabular}{lllllllll}
\hline
Autocorrelation Function \tabularnewline
Time lag k & ACF(k) & T-STAT & P-value \tabularnewline
1 & 0.255068 & 3.6072 & 0.000195 \tabularnewline
2 & 0.104097 & 1.4722 & 0.071276 \tabularnewline
3 & 0.213757 & 3.023 & 0.001415 \tabularnewline
4 & 0.111622 & 1.5786 & 0.058007 \tabularnewline
5 & 0.163143 & 2.3072 & 0.011034 \tabularnewline
6 & 0.169156 & 2.3922 & 0.008836 \tabularnewline
7 & 0.055947 & 0.7912 & 0.214879 \tabularnewline
8 & -0.039918 & -0.5645 & 0.286513 \tabularnewline
9 & -0.020143 & -0.2849 & 0.388023 \tabularnewline
10 & -0.002467 & -0.0349 & 0.486101 \tabularnewline
11 & -0.080007 & -1.1315 & 0.129606 \tabularnewline
12 & -0.375859 & -5.3155 & 0 \tabularnewline
13 & -0.23389 & -3.3077 & 0.000558 \tabularnewline
14 & -0.101357 & -1.4334 & 0.076652 \tabularnewline
15 & -0.198225 & -2.8033 & 0.002778 \tabularnewline
16 & -0.183035 & -2.5885 & 0.005174 \tabularnewline
17 & -0.092626 & -1.3099 & 0.095861 \tabularnewline
18 & -0.184253 & -2.6057 & 0.004929 \tabularnewline
19 & -0.21722 & -3.072 & 0.001211 \tabularnewline
20 & -0.083882 & -1.1863 & 0.118461 \tabularnewline
21 & -0.081014 & -1.1457 & 0.126642 \tabularnewline
22 & -0.218724 & -3.0932 & 0.001131 \tabularnewline
23 & -0.015836 & -0.224 & 0.411511 \tabularnewline
\hline
\end{tabular}
%Source: https://freestatistics.org/blog/index.php?pk=310358&T=1

[TABLE]
[ROW][C]Autocorrelation Function[/C][/ROW]
[ROW][C]Time lag k[/C][C]ACF(k)[/C][C]T-STAT[/C][C]P-value[/C][/ROW]
[ROW][C]1[/C][C]0.255068[/C][C]3.6072[/C][C]0.000195[/C][/ROW]
[ROW][C]2[/C][C]0.104097[/C][C]1.4722[/C][C]0.071276[/C][/ROW]
[ROW][C]3[/C][C]0.213757[/C][C]3.023[/C][C]0.001415[/C][/ROW]
[ROW][C]4[/C][C]0.111622[/C][C]1.5786[/C][C]0.058007[/C][/ROW]
[ROW][C]5[/C][C]0.163143[/C][C]2.3072[/C][C]0.011034[/C][/ROW]
[ROW][C]6[/C][C]0.169156[/C][C]2.3922[/C][C]0.008836[/C][/ROW]
[ROW][C]7[/C][C]0.055947[/C][C]0.7912[/C][C]0.214879[/C][/ROW]
[ROW][C]8[/C][C]-0.039918[/C][C]-0.5645[/C][C]0.286513[/C][/ROW]
[ROW][C]9[/C][C]-0.020143[/C][C]-0.2849[/C][C]0.388023[/C][/ROW]
[ROW][C]10[/C][C]-0.002467[/C][C]-0.0349[/C][C]0.486101[/C][/ROW]
[ROW][C]11[/C][C]-0.080007[/C][C]-1.1315[/C][C]0.129606[/C][/ROW]
[ROW][C]12[/C][C]-0.375859[/C][C]-5.3155[/C][C]0[/C][/ROW]
[ROW][C]13[/C][C]-0.23389[/C][C]-3.3077[/C][C]0.000558[/C][/ROW]
[ROW][C]14[/C][C]-0.101357[/C][C]-1.4334[/C][C]0.076652[/C][/ROW]
[ROW][C]15[/C][C]-0.198225[/C][C]-2.8033[/C][C]0.002778[/C][/ROW]
[ROW][C]16[/C][C]-0.183035[/C][C]-2.5885[/C][C]0.005174[/C][/ROW]
[ROW][C]17[/C][C]-0.092626[/C][C]-1.3099[/C][C]0.095861[/C][/ROW]
[ROW][C]18[/C][C]-0.184253[/C][C]-2.6057[/C][C]0.004929[/C][/ROW]
[ROW][C]19[/C][C]-0.21722[/C][C]-3.072[/C][C]0.001211[/C][/ROW]
[ROW][C]20[/C][C]-0.083882[/C][C]-1.1863[/C][C]0.118461[/C][/ROW]
[ROW][C]21[/C][C]-0.081014[/C][C]-1.1457[/C][C]0.126642[/C][/ROW]
[ROW][C]22[/C][C]-0.218724[/C][C]-3.0932[/C][C]0.001131[/C][/ROW]
[ROW][C]23[/C][C]-0.015836[/C][C]-0.224[/C][C]0.411511[/C][/ROW]
[/TABLE]
Source: https://freestatistics.org/blog/index.php?pk=310358&T=1

Globally Unique Identifier (entire table): ba.freestatistics.org/blog/index.php?pk=310358&T=1

As an alternative you can also use a QR Code:  

The GUIDs for individual cells are displayed in the table below:

Autocorrelation Function
Time lag kACF(k)T-STATP-value
10.2550683.60720.000195
20.1040971.47220.071276
30.2137573.0230.001415
40.1116221.57860.058007
50.1631432.30720.011034
60.1691562.39220.008836
70.0559470.79120.214879
8-0.039918-0.56450.286513
9-0.020143-0.28490.388023
10-0.002467-0.03490.486101
11-0.080007-1.13150.129606
12-0.375859-5.31550
13-0.23389-3.30770.000558
14-0.101357-1.43340.076652
15-0.198225-2.80330.002778
16-0.183035-2.58850.005174
17-0.092626-1.30990.095861
18-0.184253-2.60570.004929
19-0.21722-3.0720.001211
20-0.083882-1.18630.118461
21-0.081014-1.14570.126642
22-0.218724-3.09320.001131
23-0.015836-0.2240.411511


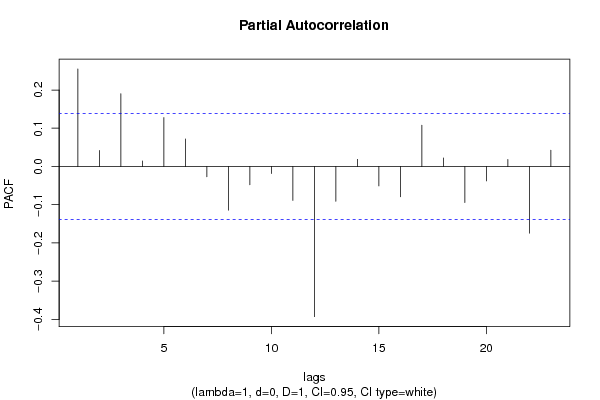
Partial Autocorrelation Function
Time lag kPACF(k)T-STATP-value
10.2550683.60720.000195
20.0417540.59050.277764
30.1903592.69210.003851
40.0144720.20470.419021
50.1277771.8070.036129
60.0717181.01420.155846
7-0.026911-0.38060.351961
8-0.114329-1.61690.053743
9-0.047974-0.67850.249135
10-0.018333-0.25930.397847
11-0.088786-1.25560.105359
12-0.392876-5.55610
13-0.091232-1.29020.099233
140.0185610.26250.396604
15-0.050891-0.71970.236274
16-0.079167-1.11960.132117
170.1076271.52210.064785
180.0220110.31130.377955
19-0.094158-1.33160.092255
20-0.037728-0.53360.297119
210.0181890.25720.398633
22-0.174428-2.46680.007237
230.0425080.60120.27421

\begin{tabular}{lllllllll}
\hline
Partial Autocorrelation Function \tabularnewline
Time lag k & PACF(k) & T-STAT & P-value \tabularnewline
1 & 0.255068 & 3.6072 & 0.000195 \tabularnewline
2 & 0.041754 & 0.5905 & 0.277764 \tabularnewline
3 & 0.190359 & 2.6921 & 0.003851 \tabularnewline
4 & 0.014472 & 0.2047 & 0.419021 \tabularnewline
5 & 0.127777 & 1.807 & 0.036129 \tabularnewline
6 & 0.071718 & 1.0142 & 0.155846 \tabularnewline
7 & -0.026911 & -0.3806 & 0.351961 \tabularnewline
8 & -0.114329 & -1.6169 & 0.053743 \tabularnewline
9 & -0.047974 & -0.6785 & 0.249135 \tabularnewline
10 & -0.018333 & -0.2593 & 0.397847 \tabularnewline
11 & -0.088786 & -1.2556 & 0.105359 \tabularnewline
12 & -0.392876 & -5.5561 & 0 \tabularnewline
13 & -0.091232 & -1.2902 & 0.099233 \tabularnewline
14 & 0.018561 & 0.2625 & 0.396604 \tabularnewline
15 & -0.050891 & -0.7197 & 0.236274 \tabularnewline
16 & -0.079167 & -1.1196 & 0.132117 \tabularnewline
17 & 0.107627 & 1.5221 & 0.064785 \tabularnewline
18 & 0.022011 & 0.3113 & 0.377955 \tabularnewline
19 & -0.094158 & -1.3316 & 0.092255 \tabularnewline
20 & -0.037728 & -0.5336 & 0.297119 \tabularnewline
21 & 0.018189 & 0.2572 & 0.398633 \tabularnewline
22 & -0.174428 & -2.4668 & 0.007237 \tabularnewline
23 & 0.042508 & 0.6012 & 0.27421 \tabularnewline
\hline
\end{tabular}
%Source: https://freestatistics.org/blog/index.php?pk=310358&T=2

[TABLE]
[ROW][C]Partial Autocorrelation Function[/C][/ROW]
[ROW][C]Time lag k[/C][C]PACF(k)[/C][C]T-STAT[/C][C]P-value[/C][/ROW]
[ROW][C]1[/C][C]0.255068[/C][C]3.6072[/C][C]0.000195[/C][/ROW]
[ROW][C]2[/C][C]0.041754[/C][C]0.5905[/C][C]0.277764[/C][/ROW]
[ROW][C]3[/C][C]0.190359[/C][C]2.6921[/C][C]0.003851[/C][/ROW]
[ROW][C]4[/C][C]0.014472[/C][C]0.2047[/C][C]0.419021[/C][/ROW]
[ROW][C]5[/C][C]0.127777[/C][C]1.807[/C][C]0.036129[/C][/ROW]
[ROW][C]6[/C][C]0.071718[/C][C]1.0142[/C][C]0.155846[/C][/ROW]
[ROW][C]7[/C][C]-0.026911[/C][C]-0.3806[/C][C]0.351961[/C][/ROW]
[ROW][C]8[/C][C]-0.114329[/C][C]-1.6169[/C][C]0.053743[/C][/ROW]
[ROW][C]9[/C][C]-0.047974[/C][C]-0.6785[/C][C]0.249135[/C][/ROW]
[ROW][C]10[/C][C]-0.018333[/C][C]-0.2593[/C][C]0.397847[/C][/ROW]
[ROW][C]11[/C][C]-0.088786[/C][C]-1.2556[/C][C]0.105359[/C][/ROW]
[ROW][C]12[/C][C]-0.392876[/C][C]-5.5561[/C][C]0[/C][/ROW]
[ROW][C]13[/C][C]-0.091232[/C][C]-1.2902[/C][C]0.099233[/C][/ROW]
[ROW][C]14[/C][C]0.018561[/C][C]0.2625[/C][C]0.396604[/C][/ROW]
[ROW][C]15[/C][C]-0.050891[/C][C]-0.7197[/C][C]0.236274[/C][/ROW]
[ROW][C]16[/C][C]-0.079167[/C][C]-1.1196[/C][C]0.132117[/C][/ROW]
[ROW][C]17[/C][C]0.107627[/C][C]1.5221[/C][C]0.064785[/C][/ROW]
[ROW][C]18[/C][C]0.022011[/C][C]0.3113[/C][C]0.377955[/C][/ROW]
[ROW][C]19[/C][C]-0.094158[/C][C]-1.3316[/C][C]0.092255[/C][/ROW]
[ROW][C]20[/C][C]-0.037728[/C][C]-0.5336[/C][C]0.297119[/C][/ROW]
[ROW][C]21[/C][C]0.018189[/C][C]0.2572[/C][C]0.398633[/C][/ROW]
[ROW][C]22[/C][C]-0.174428[/C][C]-2.4668[/C][C]0.007237[/C][/ROW]
[ROW][C]23[/C][C]0.042508[/C][C]0.6012[/C][C]0.27421[/C][/ROW]
[/TABLE]
Source: https://freestatistics.org/blog/index.php?pk=310358&T=2

Globally Unique Identifier (entire table): ba.freestatistics.org/blog/index.php?pk=310358&T=2

As an alternative you can also use a QR Code:  

The GUIDs for individual cells are displayed in the table below:

Partial Autocorrelation Function
Time lag kPACF(k)T-STATP-value
10.2550683.60720.000195
20.0417540.59050.277764
30.1903592.69210.003851
40.0144720.20470.419021
50.1277771.8070.036129
60.0717181.01420.155846
7-0.026911-0.38060.351961
8-0.114329-1.61690.053743
9-0.047974-0.67850.249135
10-0.018333-0.25930.397847
11-0.088786-1.25560.105359
12-0.392876-5.55610
13-0.091232-1.29020.099233
140.0185610.26250.396604
15-0.050891-0.71970.236274
16-0.079167-1.11960.132117
170.1076271.52210.064785
180.0220110.31130.377955
19-0.094158-1.33160.092255
20-0.037728-0.53360.297119
210.0181890.25720.398633
22-0.174428-2.46680.007237
230.0425080.60120.27421


Parameters (Session):
par1 = Default ; par2 = 1 ; par3 = 0 ; par4 = 1 ; par5 = 12 ; par6 = White Noise ; par7 = 0.95 ;
Parameters (R input):
par1 = Default ; par2 = 1 ; par3 = 0 ; par4 = 1 ; par5 = 12 ; par6 = White Noise ; par7 = 0.95 ; par8 = ;
R code (references can be found in the software module):
if (par1 == 'Default') {
par1 = 10*log10(length(x))
} else {
par1 <- as.numeric(par1)
}
par2 <- as.numeric(par2)
par3 <- as.numeric(par3)
par4 <- as.numeric(par4)
par5 <- as.numeric(par5)
if (par6 == 'White Noise') par6 <- 'white' else par6 <- 'ma'
par7 <- as.numeric(par7)
if (par8 != '') par8 <- as.numeric(par8)
x <- na.omit(x)
ox <- x
if (par8 == '') {
if (par2 == 0) {
x <- log(x)
} else {
x <- (x ^ par2 - 1) / par2
}
} else {
x <- log(x,base=par8)
}
if (par3 > 0) x <- diff(x,lag=1,difference=par3)
if (par4 > 0) x <- diff(x,lag=par5,difference=par4)
bitmap(file='picts.png')
op <- par(mfrow=c(2,1))
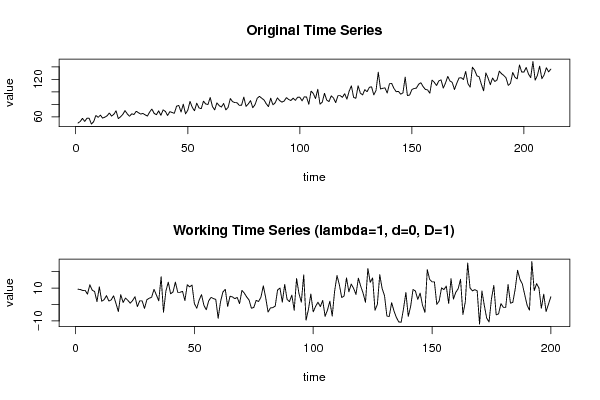
plot(ox,type='l',main='Original Time Series',xlab='time',ylab='value')
if (par8=='') {
mytitle <- paste('Working Time Series (lambda=',par2,', d=',par3,', D=',par4,')',sep='')
mysub <- paste('(lambda=',par2,', d=',par3,', D=',par4,', CI=', par7, ', CI type=',par6,')',sep='')
} else {
mytitle <- paste('Working Time Series (base=',par8,', d=',par3,', D=',par4,')',sep='')
mysub <- paste('(base=',par8,', d=',par3,', D=',par4,', CI=', par7, ', CI type=',par6,')',sep='')
}
plot(x,type='l', main=mytitle,xlab='time',ylab='value')
par(op)
dev.off()
bitmap(file='pic1.png')
racf <- acf(x, par1, main='Autocorrelation', xlab='time lag', ylab='ACF', ci.type=par6, ci=par7, sub=mysub)
dev.off()
bitmap(file='pic2.png')
rpacf <- pacf(x,par1,main='Partial Autocorrelation',xlab='lags',ylab='PACF',sub=mysub)
dev.off()
(myacf <- c(racf$acf))
(mypacf <- c(rpacf$acf))
lengthx <- length(x)
sqrtn <- sqrt(lengthx)
load(file='createtable')
a<-table.start()
a<-table.row.start(a)
a<-table.element(a,'Autocorrelation Function',4,TRUE)
a<-table.row.end(a)
a<-table.row.start(a)
a<-table.element(a,'Time lag k',header=TRUE)
a<-table.element(a,'ACF(k)',header=TRUE)
a<-table.element(a,'T-STAT',header=TRUE)
a<-table.element(a,'P-value',header=TRUE)
a<-table.row.end(a)
for (i in 2:(par1+1)) {
a<-table.row.start(a)
a<-table.element(a,i-1,header=TRUE)
a<-table.element(a,round(myacf[i],6))
mytstat <- myacf[i]*sqrtn
a<-table.element(a,round(mytstat,4))
a<-table.element(a,round(1-pt(abs(mytstat),lengthx),6))
a<-table.row.end(a)
}
a<-table.end(a)
table.save(a,file='mytable.tab')
a<-table.start()
a<-table.row.start(a)
a<-table.element(a,'Partial Autocorrelation Function',4,TRUE)
a<-table.row.end(a)
a<-table.row.start(a)
a<-table.element(a,'Time lag k',header=TRUE)
a<-table.element(a,'PACF(k)',header=TRUE)
a<-table.element(a,'T-STAT',header=TRUE)
a<-table.element(a,'P-value',header=TRUE)
a<-table.row.end(a)
for (i in 1:par1) {
a<-table.row.start(a)
a<-table.element(a,i,header=TRUE)
a<-table.element(a,round(mypacf[i],6))
mytstat <- mypacf[i]*sqrtn
a<-table.element(a,round(mytstat,4))
a<-table.element(a,round(1-pt(abs(mytstat),lengthx),6))
a<-table.row.end(a)
}
a<-table.end(a)
table.save(a,file='mytable1.tab')