Free Statistics

of Irreproducible Research!

Author's title

Author*The author of this computation has been verified*
R Software Modulerwasp_autocorrelation.wasp
Title produced by software(Partial) Autocorrelation Function
Date of computationTue, 19 Dec 2017 14:50:14 +0100
Cite this page as followsStatistical Computations at FreeStatistics.org, Office for Research Development and Education, URL https://freestatistics.org/blog/index.php?v=date/2017/Dec/19/t1513691424rakv04sn8mmclir.htm/, Retrieved Wed, 15 May 2024 17:03:45 +0000
Statistical Computations at FreeStatistics.org, Office for Research Development and Education, URL https://freestatistics.org/blog/index.php?pk=310349, Retrieved Wed, 15 May 2024 17:03:45 +0000
QR Codes:

Original text written by user:
IsPrivate?No (this computation is public)
User-defined keywords
Estimated Impact64
Family? (F = Feedback message, R = changed R code, M = changed R Module, P = changed Parameters, D = changed Data)
-       [(Partial) Autocorrelation Function] [] [2017-12-19 13:50:14] [3c3f1142cbd5b1dfc6913e0ceac18617] [Current]
Feedback Forum

Post a new message
Dataseries X:
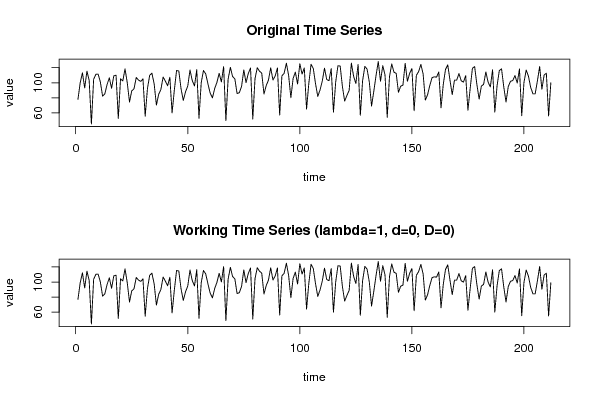
78
100.1
113.2
93.1
115.4
103.3
45.1
104.7
111.3
111.5
100.9
82.1
85.4
97.7
106.6
92.6
109.2
110
52.5
105.3
102.3
118.5
100
74.4
89.2
91.9
107
103.6
101.8
105.1
55.5
92.1
109.8
112.7
98.5
70.3
84.5
91.1
107.6
102.2
96
107.3
59.9
90.2
116.3
115.6
92
76.5
87.9
95.8
116.9
102.9
95.8
117.3
52.8
100.1
116.3
111.8
98.5
86.2
79.9
92.3
100.5
112.5
101.1
121.5
49.6
104.8
120.4
108.3
105.2
85.7
86.8
95.1
117
100.1
112.3
119.6
51.8
105.5
119.9
115.4
112.8
85.1
96.2
103.6
119.9
103.7
109
119.6
57
109.2
112.6
126
109.7
80.1
105.8
114.1
98.3
125.3
111.6
119.7
65
99
124.5
119
98.8
81.8
90.3
102
119.3
104.3
102.8
118.8
60.9
101
122.6
122.2
95
75.6
83.1
89.8
126.1
108.6
98.9
124.3
56.8
102.7
121.7
118.2
101
69
88.6
109.6
128.2
102
122.7
110.5
54
108.1
125
114.1
112.4
87.3
95.4
96.9
125.8
102
112.5
118.9
62.7
110
114.7
124.4
111.9
77
84.1
96.5
106.8
107.9
107.5
114.3
66.6
97.9
117.8
123.8
103.3
84.2
103.6
103.6
112.2
102.7
100.8
109.4
63.5
92.3
119.2
121.5
97.6
78.3
95.6
97.9
114.4
100.9
94.4
117.2
61
95.8
116.2
118.5
94.3
74.4
94.9
102
102.9
109.5
99.7
118.3
56.2
100.3
116.9
108.7
93.9
85.3
85.3
102.4
121.6
91.4
110.2
112.7
55.7
100.1


Summary of computational transaction
Raw Input view raw input (R code)
Raw Outputview raw output of R engine
Computing time2 seconds
R ServerBig Analytics Cloud Computing Center

\begin{tabular}{lllllllll}
\hline
Summary of computational transaction \tabularnewline
Raw Input view raw input (R code)  \tabularnewline
Raw Outputview raw output of R engine  \tabularnewline
Computing time2 seconds \tabularnewline
R ServerBig Analytics Cloud Computing Center \tabularnewline
\hline
\end{tabular}
%Source: https://freestatistics.org/blog/index.php?pk=310349&T=0

[TABLE]
[ROW]
Summary of computational transaction[/C][/ROW] [ROW]Raw Input[/C] view raw input (R code) [/C][/ROW] [ROW]Raw Output[/C]view raw output of R engine [/C][/ROW] [ROW]Computing time[/C]2 seconds[/C][/ROW] [ROW]R Server[/C]Big Analytics Cloud Computing Center[/C][/ROW] [/TABLE] Source: https://freestatistics.org/blog/index.php?pk=310349&T=0

Globally Unique Identifier (entire table): ba.freestatistics.org/blog/index.php?pk=310349&T=0

As an alternative you can also use a QR Code:  

The GUIDs for individual cells are displayed in the table below:

Summary of computational transaction
Raw Input view raw input (R code)
Raw Outputview raw output of R engine
Computing time2 seconds
R ServerBig Analytics Cloud Computing Center


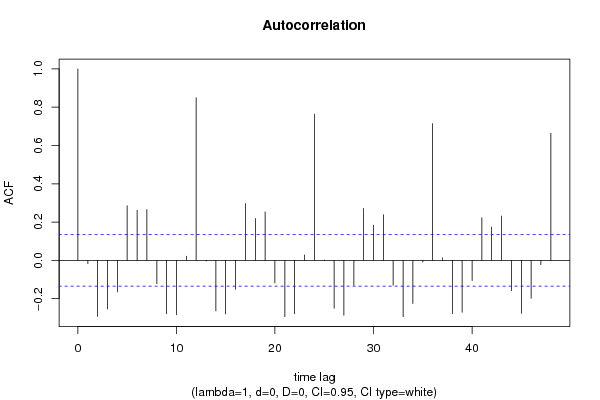
Autocorrelation Function
Time lag kACF(k)T-STATP-value
1-0.016781-0.24430.403604
2-0.292453-4.25821.5e-05
3-0.253955-3.69760.000139
4-0.164536-2.39570.00873
50.2855394.15752.3e-05
60.2620893.81618.9e-05
70.2651933.86137.5e-05
8-0.1213-1.76620.039404
9-0.278513-4.05523.5e-05
10-0.284166-4.13752.5e-05
110.0215340.31350.377089
120.84937312.36710
13-0.003531-0.05140.479522
14-0.263633-3.83858.2e-05
15-0.279271-4.06633.4e-05
16-0.151074-2.19970.014455
170.2972644.32821.2e-05
180.2189183.18750.000826
190.25363.69250.000141
20-0.117224-1.70680.044661
21-0.293732-4.27681.4e-05
22-0.278572-4.05613.5e-05
230.0279280.40660.342341
240.76320611.11250
250.0014570.02120.491546
26-0.250173-3.64260.00017
27-0.286467-4.1712.2e-05
28-0.129763-1.88940.030103
290.2714393.95225.3e-05
300.1836762.67440.004035
310.2386323.47450.00031
32-0.12957-1.88660.030292
33-0.293717-4.27661.4e-05
34-0.225382-3.28160.000603
35-0.008411-0.12250.451323
360.71462110.4050
370.0138280.20130.420313
38-0.278532-4.05553.5e-05
39-0.270643-3.94065.5e-05
40-0.104935-1.52790.064017
410.2228463.24470.000683
420.1738622.53150.006042
430.2314823.37040.000446
44-0.157844-2.29820.011261
45-0.27674-4.02943.9e-05
46-0.197297-2.87270.002242
47-0.021862-0.31830.375279
480.663899.66640

\begin{tabular}{lllllllll}
\hline
Autocorrelation Function \tabularnewline
Time lag k & ACF(k) & T-STAT & P-value \tabularnewline
1 & -0.016781 & -0.2443 & 0.403604 \tabularnewline
2 & -0.292453 & -4.2582 & 1.5e-05 \tabularnewline
3 & -0.253955 & -3.6976 & 0.000139 \tabularnewline
4 & -0.164536 & -2.3957 & 0.00873 \tabularnewline
5 & 0.285539 & 4.1575 & 2.3e-05 \tabularnewline
6 & 0.262089 & 3.8161 & 8.9e-05 \tabularnewline
7 & 0.265193 & 3.8613 & 7.5e-05 \tabularnewline
8 & -0.1213 & -1.7662 & 0.039404 \tabularnewline
9 & -0.278513 & -4.0552 & 3.5e-05 \tabularnewline
10 & -0.284166 & -4.1375 & 2.5e-05 \tabularnewline
11 & 0.021534 & 0.3135 & 0.377089 \tabularnewline
12 & 0.849373 & 12.3671 & 0 \tabularnewline
13 & -0.003531 & -0.0514 & 0.479522 \tabularnewline
14 & -0.263633 & -3.8385 & 8.2e-05 \tabularnewline
15 & -0.279271 & -4.0663 & 3.4e-05 \tabularnewline
16 & -0.151074 & -2.1997 & 0.014455 \tabularnewline
17 & 0.297264 & 4.3282 & 1.2e-05 \tabularnewline
18 & 0.218918 & 3.1875 & 0.000826 \tabularnewline
19 & 0.2536 & 3.6925 & 0.000141 \tabularnewline
20 & -0.117224 & -1.7068 & 0.044661 \tabularnewline
21 & -0.293732 & -4.2768 & 1.4e-05 \tabularnewline
22 & -0.278572 & -4.0561 & 3.5e-05 \tabularnewline
23 & 0.027928 & 0.4066 & 0.342341 \tabularnewline
24 & 0.763206 & 11.1125 & 0 \tabularnewline
25 & 0.001457 & 0.0212 & 0.491546 \tabularnewline
26 & -0.250173 & -3.6426 & 0.00017 \tabularnewline
27 & -0.286467 & -4.171 & 2.2e-05 \tabularnewline
28 & -0.129763 & -1.8894 & 0.030103 \tabularnewline
29 & 0.271439 & 3.9522 & 5.3e-05 \tabularnewline
30 & 0.183676 & 2.6744 & 0.004035 \tabularnewline
31 & 0.238632 & 3.4745 & 0.00031 \tabularnewline
32 & -0.12957 & -1.8866 & 0.030292 \tabularnewline
33 & -0.293717 & -4.2766 & 1.4e-05 \tabularnewline
34 & -0.225382 & -3.2816 & 0.000603 \tabularnewline
35 & -0.008411 & -0.1225 & 0.451323 \tabularnewline
36 & 0.714621 & 10.405 & 0 \tabularnewline
37 & 0.013828 & 0.2013 & 0.420313 \tabularnewline
38 & -0.278532 & -4.0555 & 3.5e-05 \tabularnewline
39 & -0.270643 & -3.9406 & 5.5e-05 \tabularnewline
40 & -0.104935 & -1.5279 & 0.064017 \tabularnewline
41 & 0.222846 & 3.2447 & 0.000683 \tabularnewline
42 & 0.173862 & 2.5315 & 0.006042 \tabularnewline
43 & 0.231482 & 3.3704 & 0.000446 \tabularnewline
44 & -0.157844 & -2.2982 & 0.011261 \tabularnewline
45 & -0.27674 & -4.0294 & 3.9e-05 \tabularnewline
46 & -0.197297 & -2.8727 & 0.002242 \tabularnewline
47 & -0.021862 & -0.3183 & 0.375279 \tabularnewline
48 & 0.66389 & 9.6664 & 0 \tabularnewline
\hline
\end{tabular}
%Source: https://freestatistics.org/blog/index.php?pk=310349&T=1

[TABLE]
[ROW][C]Autocorrelation Function[/C][/ROW]
[ROW][C]Time lag k[/C][C]ACF(k)[/C][C]T-STAT[/C][C]P-value[/C][/ROW]
[ROW][C]1[/C][C]-0.016781[/C][C]-0.2443[/C][C]0.403604[/C][/ROW]
[ROW][C]2[/C][C]-0.292453[/C][C]-4.2582[/C][C]1.5e-05[/C][/ROW]
[ROW][C]3[/C][C]-0.253955[/C][C]-3.6976[/C][C]0.000139[/C][/ROW]
[ROW][C]4[/C][C]-0.164536[/C][C]-2.3957[/C][C]0.00873[/C][/ROW]
[ROW][C]5[/C][C]0.285539[/C][C]4.1575[/C][C]2.3e-05[/C][/ROW]
[ROW][C]6[/C][C]0.262089[/C][C]3.8161[/C][C]8.9e-05[/C][/ROW]
[ROW][C]7[/C][C]0.265193[/C][C]3.8613[/C][C]7.5e-05[/C][/ROW]
[ROW][C]8[/C][C]-0.1213[/C][C]-1.7662[/C][C]0.039404[/C][/ROW]
[ROW][C]9[/C][C]-0.278513[/C][C]-4.0552[/C][C]3.5e-05[/C][/ROW]
[ROW][C]10[/C][C]-0.284166[/C][C]-4.1375[/C][C]2.5e-05[/C][/ROW]
[ROW][C]11[/C][C]0.021534[/C][C]0.3135[/C][C]0.377089[/C][/ROW]
[ROW][C]12[/C][C]0.849373[/C][C]12.3671[/C][C]0[/C][/ROW]
[ROW][C]13[/C][C]-0.003531[/C][C]-0.0514[/C][C]0.479522[/C][/ROW]
[ROW][C]14[/C][C]-0.263633[/C][C]-3.8385[/C][C]8.2e-05[/C][/ROW]
[ROW][C]15[/C][C]-0.279271[/C][C]-4.0663[/C][C]3.4e-05[/C][/ROW]
[ROW][C]16[/C][C]-0.151074[/C][C]-2.1997[/C][C]0.014455[/C][/ROW]
[ROW][C]17[/C][C]0.297264[/C][C]4.3282[/C][C]1.2e-05[/C][/ROW]
[ROW][C]18[/C][C]0.218918[/C][C]3.1875[/C][C]0.000826[/C][/ROW]
[ROW][C]19[/C][C]0.2536[/C][C]3.6925[/C][C]0.000141[/C][/ROW]
[ROW][C]20[/C][C]-0.117224[/C][C]-1.7068[/C][C]0.044661[/C][/ROW]
[ROW][C]21[/C][C]-0.293732[/C][C]-4.2768[/C][C]1.4e-05[/C][/ROW]
[ROW][C]22[/C][C]-0.278572[/C][C]-4.0561[/C][C]3.5e-05[/C][/ROW]
[ROW][C]23[/C][C]0.027928[/C][C]0.4066[/C][C]0.342341[/C][/ROW]
[ROW][C]24[/C][C]0.763206[/C][C]11.1125[/C][C]0[/C][/ROW]
[ROW][C]25[/C][C]0.001457[/C][C]0.0212[/C][C]0.491546[/C][/ROW]
[ROW][C]26[/C][C]-0.250173[/C][C]-3.6426[/C][C]0.00017[/C][/ROW]
[ROW][C]27[/C][C]-0.286467[/C][C]-4.171[/C][C]2.2e-05[/C][/ROW]
[ROW][C]28[/C][C]-0.129763[/C][C]-1.8894[/C][C]0.030103[/C][/ROW]
[ROW][C]29[/C][C]0.271439[/C][C]3.9522[/C][C]5.3e-05[/C][/ROW]
[ROW][C]30[/C][C]0.183676[/C][C]2.6744[/C][C]0.004035[/C][/ROW]
[ROW][C]31[/C][C]0.238632[/C][C]3.4745[/C][C]0.00031[/C][/ROW]
[ROW][C]32[/C][C]-0.12957[/C][C]-1.8866[/C][C]0.030292[/C][/ROW]
[ROW][C]33[/C][C]-0.293717[/C][C]-4.2766[/C][C]1.4e-05[/C][/ROW]
[ROW][C]34[/C][C]-0.225382[/C][C]-3.2816[/C][C]0.000603[/C][/ROW]
[ROW][C]35[/C][C]-0.008411[/C][C]-0.1225[/C][C]0.451323[/C][/ROW]
[ROW][C]36[/C][C]0.714621[/C][C]10.405[/C][C]0[/C][/ROW]
[ROW][C]37[/C][C]0.013828[/C][C]0.2013[/C][C]0.420313[/C][/ROW]
[ROW][C]38[/C][C]-0.278532[/C][C]-4.0555[/C][C]3.5e-05[/C][/ROW]
[ROW][C]39[/C][C]-0.270643[/C][C]-3.9406[/C][C]5.5e-05[/C][/ROW]
[ROW][C]40[/C][C]-0.104935[/C][C]-1.5279[/C][C]0.064017[/C][/ROW]
[ROW][C]41[/C][C]0.222846[/C][C]3.2447[/C][C]0.000683[/C][/ROW]
[ROW][C]42[/C][C]0.173862[/C][C]2.5315[/C][C]0.006042[/C][/ROW]
[ROW][C]43[/C][C]0.231482[/C][C]3.3704[/C][C]0.000446[/C][/ROW]
[ROW][C]44[/C][C]-0.157844[/C][C]-2.2982[/C][C]0.011261[/C][/ROW]
[ROW][C]45[/C][C]-0.27674[/C][C]-4.0294[/C][C]3.9e-05[/C][/ROW]
[ROW][C]46[/C][C]-0.197297[/C][C]-2.8727[/C][C]0.002242[/C][/ROW]
[ROW][C]47[/C][C]-0.021862[/C][C]-0.3183[/C][C]0.375279[/C][/ROW]
[ROW][C]48[/C][C]0.66389[/C][C]9.6664[/C][C]0[/C][/ROW]
[/TABLE]
Source: https://freestatistics.org/blog/index.php?pk=310349&T=1

Globally Unique Identifier (entire table): ba.freestatistics.org/blog/index.php?pk=310349&T=1

As an alternative you can also use a QR Code:  

The GUIDs for individual cells are displayed in the table below:

Autocorrelation Function
Time lag kACF(k)T-STATP-value
1-0.016781-0.24430.403604
2-0.292453-4.25821.5e-05
3-0.253955-3.69760.000139
4-0.164536-2.39570.00873
50.2855394.15752.3e-05
60.2620893.81618.9e-05
70.2651933.86137.5e-05
8-0.1213-1.76620.039404
9-0.278513-4.05523.5e-05
10-0.284166-4.13752.5e-05
110.0215340.31350.377089
120.84937312.36710
13-0.003531-0.05140.479522
14-0.263633-3.83858.2e-05
15-0.279271-4.06633.4e-05
16-0.151074-2.19970.014455
170.2972644.32821.2e-05
180.2189183.18750.000826
190.25363.69250.000141
20-0.117224-1.70680.044661
21-0.293732-4.27681.4e-05
22-0.278572-4.05613.5e-05
230.0279280.40660.342341
240.76320611.11250
250.0014570.02120.491546
26-0.250173-3.64260.00017
27-0.286467-4.1712.2e-05
28-0.129763-1.88940.030103
290.2714393.95225.3e-05
300.1836762.67440.004035
310.2386323.47450.00031
32-0.12957-1.88660.030292
33-0.293717-4.27661.4e-05
34-0.225382-3.28160.000603
35-0.008411-0.12250.451323
360.71462110.4050
370.0138280.20130.420313
38-0.278532-4.05553.5e-05
39-0.270643-3.94065.5e-05
40-0.104935-1.52790.064017
410.2228463.24470.000683
420.1738622.53150.006042
430.2314823.37040.000446
44-0.157844-2.29820.011261
45-0.27674-4.02943.9e-05
46-0.197297-2.87270.002242
47-0.021862-0.31830.375279
480.663899.66640


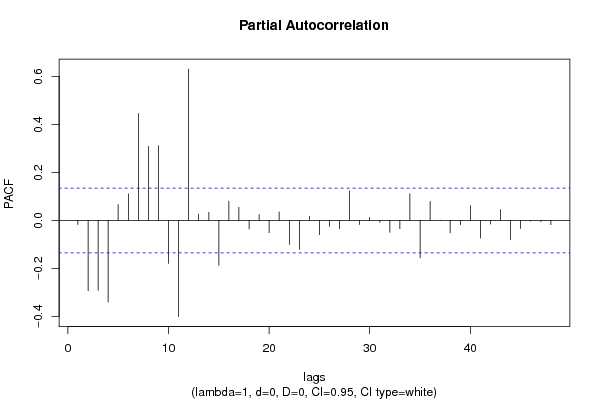
Partial Autocorrelation Function
Time lag kPACF(k)T-STATP-value
1-0.016781-0.24430.403604
2-0.292817-4.26351.5e-05
3-0.290168-4.22491.8e-05
4-0.339252-4.93961e-06
50.0660520.96170.168639
60.1106291.61080.054357
70.4448686.47740
80.3084664.49136e-06
90.3109264.52715e-06
10-0.178796-2.60330.004943
11-0.400321-5.82880
120.6304889.180
130.0264180.38470.35044
140.034250.49870.309258
15-0.18619-2.7110.003629
160.0802821.16890.121872
170.0548770.7990.212584
18-0.035876-0.52240.300984
190.0244070.35540.361332
20-0.05066-0.73760.230779
210.035240.51310.304209
22-0.098997-1.44140.075471
23-0.120507-1.75460.040386
240.0169290.24650.402769
25-0.059032-0.85950.195513
26-0.025098-0.36540.357579
27-0.034699-0.50520.306963
280.1220261.77670.038524
29-0.016644-0.24230.404377
300.012740.18550.42651
31-0.00722-0.10510.458191
32-0.049462-0.72020.236106
33-0.034093-0.49640.310061
340.111141.61820.05355
35-0.154647-2.25170.012684
360.0791121.15190.125334
37-3e-04-0.00440.498262
38-0.051298-0.74690.227971
39-0.017303-0.25190.400669
400.062010.90290.183806
41-0.073408-1.06880.143179
42-0.014559-0.2120.416162
430.0442550.64440.260019
44-0.080072-1.16590.12249
45-0.033549-0.48850.312855
46-0.002268-0.0330.486841
47-0.004929-0.07180.471426
48-0.017461-0.25420.399778

\begin{tabular}{lllllllll}
\hline
Partial Autocorrelation Function \tabularnewline
Time lag k & PACF(k) & T-STAT & P-value \tabularnewline
1 & -0.016781 & -0.2443 & 0.403604 \tabularnewline
2 & -0.292817 & -4.2635 & 1.5e-05 \tabularnewline
3 & -0.290168 & -4.2249 & 1.8e-05 \tabularnewline
4 & -0.339252 & -4.9396 & 1e-06 \tabularnewline
5 & 0.066052 & 0.9617 & 0.168639 \tabularnewline
6 & 0.110629 & 1.6108 & 0.054357 \tabularnewline
7 & 0.444868 & 6.4774 & 0 \tabularnewline
8 & 0.308466 & 4.4913 & 6e-06 \tabularnewline
9 & 0.310926 & 4.5271 & 5e-06 \tabularnewline
10 & -0.178796 & -2.6033 & 0.004943 \tabularnewline
11 & -0.400321 & -5.8288 & 0 \tabularnewline
12 & 0.630488 & 9.18 & 0 \tabularnewline
13 & 0.026418 & 0.3847 & 0.35044 \tabularnewline
14 & 0.03425 & 0.4987 & 0.309258 \tabularnewline
15 & -0.18619 & -2.711 & 0.003629 \tabularnewline
16 & 0.080282 & 1.1689 & 0.121872 \tabularnewline
17 & 0.054877 & 0.799 & 0.212584 \tabularnewline
18 & -0.035876 & -0.5224 & 0.300984 \tabularnewline
19 & 0.024407 & 0.3554 & 0.361332 \tabularnewline
20 & -0.05066 & -0.7376 & 0.230779 \tabularnewline
21 & 0.03524 & 0.5131 & 0.304209 \tabularnewline
22 & -0.098997 & -1.4414 & 0.075471 \tabularnewline
23 & -0.120507 & -1.7546 & 0.040386 \tabularnewline
24 & 0.016929 & 0.2465 & 0.402769 \tabularnewline
25 & -0.059032 & -0.8595 & 0.195513 \tabularnewline
26 & -0.025098 & -0.3654 & 0.357579 \tabularnewline
27 & -0.034699 & -0.5052 & 0.306963 \tabularnewline
28 & 0.122026 & 1.7767 & 0.038524 \tabularnewline
29 & -0.016644 & -0.2423 & 0.404377 \tabularnewline
30 & 0.01274 & 0.1855 & 0.42651 \tabularnewline
31 & -0.00722 & -0.1051 & 0.458191 \tabularnewline
32 & -0.049462 & -0.7202 & 0.236106 \tabularnewline
33 & -0.034093 & -0.4964 & 0.310061 \tabularnewline
34 & 0.11114 & 1.6182 & 0.05355 \tabularnewline
35 & -0.154647 & -2.2517 & 0.012684 \tabularnewline
36 & 0.079112 & 1.1519 & 0.125334 \tabularnewline
37 & -3e-04 & -0.0044 & 0.498262 \tabularnewline
38 & -0.051298 & -0.7469 & 0.227971 \tabularnewline
39 & -0.017303 & -0.2519 & 0.400669 \tabularnewline
40 & 0.06201 & 0.9029 & 0.183806 \tabularnewline
41 & -0.073408 & -1.0688 & 0.143179 \tabularnewline
42 & -0.014559 & -0.212 & 0.416162 \tabularnewline
43 & 0.044255 & 0.6444 & 0.260019 \tabularnewline
44 & -0.080072 & -1.1659 & 0.12249 \tabularnewline
45 & -0.033549 & -0.4885 & 0.312855 \tabularnewline
46 & -0.002268 & -0.033 & 0.486841 \tabularnewline
47 & -0.004929 & -0.0718 & 0.471426 \tabularnewline
48 & -0.017461 & -0.2542 & 0.399778 \tabularnewline
\hline
\end{tabular}
%Source: https://freestatistics.org/blog/index.php?pk=310349&T=2

[TABLE]
[ROW][C]Partial Autocorrelation Function[/C][/ROW]
[ROW][C]Time lag k[/C][C]PACF(k)[/C][C]T-STAT[/C][C]P-value[/C][/ROW]
[ROW][C]1[/C][C]-0.016781[/C][C]-0.2443[/C][C]0.403604[/C][/ROW]
[ROW][C]2[/C][C]-0.292817[/C][C]-4.2635[/C][C]1.5e-05[/C][/ROW]
[ROW][C]3[/C][C]-0.290168[/C][C]-4.2249[/C][C]1.8e-05[/C][/ROW]
[ROW][C]4[/C][C]-0.339252[/C][C]-4.9396[/C][C]1e-06[/C][/ROW]
[ROW][C]5[/C][C]0.066052[/C][C]0.9617[/C][C]0.168639[/C][/ROW]
[ROW][C]6[/C][C]0.110629[/C][C]1.6108[/C][C]0.054357[/C][/ROW]
[ROW][C]7[/C][C]0.444868[/C][C]6.4774[/C][C]0[/C][/ROW]
[ROW][C]8[/C][C]0.308466[/C][C]4.4913[/C][C]6e-06[/C][/ROW]
[ROW][C]9[/C][C]0.310926[/C][C]4.5271[/C][C]5e-06[/C][/ROW]
[ROW][C]10[/C][C]-0.178796[/C][C]-2.6033[/C][C]0.004943[/C][/ROW]
[ROW][C]11[/C][C]-0.400321[/C][C]-5.8288[/C][C]0[/C][/ROW]
[ROW][C]12[/C][C]0.630488[/C][C]9.18[/C][C]0[/C][/ROW]
[ROW][C]13[/C][C]0.026418[/C][C]0.3847[/C][C]0.35044[/C][/ROW]
[ROW][C]14[/C][C]0.03425[/C][C]0.4987[/C][C]0.309258[/C][/ROW]
[ROW][C]15[/C][C]-0.18619[/C][C]-2.711[/C][C]0.003629[/C][/ROW]
[ROW][C]16[/C][C]0.080282[/C][C]1.1689[/C][C]0.121872[/C][/ROW]
[ROW][C]17[/C][C]0.054877[/C][C]0.799[/C][C]0.212584[/C][/ROW]
[ROW][C]18[/C][C]-0.035876[/C][C]-0.5224[/C][C]0.300984[/C][/ROW]
[ROW][C]19[/C][C]0.024407[/C][C]0.3554[/C][C]0.361332[/C][/ROW]
[ROW][C]20[/C][C]-0.05066[/C][C]-0.7376[/C][C]0.230779[/C][/ROW]
[ROW][C]21[/C][C]0.03524[/C][C]0.5131[/C][C]0.304209[/C][/ROW]
[ROW][C]22[/C][C]-0.098997[/C][C]-1.4414[/C][C]0.075471[/C][/ROW]
[ROW][C]23[/C][C]-0.120507[/C][C]-1.7546[/C][C]0.040386[/C][/ROW]
[ROW][C]24[/C][C]0.016929[/C][C]0.2465[/C][C]0.402769[/C][/ROW]
[ROW][C]25[/C][C]-0.059032[/C][C]-0.8595[/C][C]0.195513[/C][/ROW]
[ROW][C]26[/C][C]-0.025098[/C][C]-0.3654[/C][C]0.357579[/C][/ROW]
[ROW][C]27[/C][C]-0.034699[/C][C]-0.5052[/C][C]0.306963[/C][/ROW]
[ROW][C]28[/C][C]0.122026[/C][C]1.7767[/C][C]0.038524[/C][/ROW]
[ROW][C]29[/C][C]-0.016644[/C][C]-0.2423[/C][C]0.404377[/C][/ROW]
[ROW][C]30[/C][C]0.01274[/C][C]0.1855[/C][C]0.42651[/C][/ROW]
[ROW][C]31[/C][C]-0.00722[/C][C]-0.1051[/C][C]0.458191[/C][/ROW]
[ROW][C]32[/C][C]-0.049462[/C][C]-0.7202[/C][C]0.236106[/C][/ROW]
[ROW][C]33[/C][C]-0.034093[/C][C]-0.4964[/C][C]0.310061[/C][/ROW]
[ROW][C]34[/C][C]0.11114[/C][C]1.6182[/C][C]0.05355[/C][/ROW]
[ROW][C]35[/C][C]-0.154647[/C][C]-2.2517[/C][C]0.012684[/C][/ROW]
[ROW][C]36[/C][C]0.079112[/C][C]1.1519[/C][C]0.125334[/C][/ROW]
[ROW][C]37[/C][C]-3e-04[/C][C]-0.0044[/C][C]0.498262[/C][/ROW]
[ROW][C]38[/C][C]-0.051298[/C][C]-0.7469[/C][C]0.227971[/C][/ROW]
[ROW][C]39[/C][C]-0.017303[/C][C]-0.2519[/C][C]0.400669[/C][/ROW]
[ROW][C]40[/C][C]0.06201[/C][C]0.9029[/C][C]0.183806[/C][/ROW]
[ROW][C]41[/C][C]-0.073408[/C][C]-1.0688[/C][C]0.143179[/C][/ROW]
[ROW][C]42[/C][C]-0.014559[/C][C]-0.212[/C][C]0.416162[/C][/ROW]
[ROW][C]43[/C][C]0.044255[/C][C]0.6444[/C][C]0.260019[/C][/ROW]
[ROW][C]44[/C][C]-0.080072[/C][C]-1.1659[/C][C]0.12249[/C][/ROW]
[ROW][C]45[/C][C]-0.033549[/C][C]-0.4885[/C][C]0.312855[/C][/ROW]
[ROW][C]46[/C][C]-0.002268[/C][C]-0.033[/C][C]0.486841[/C][/ROW]
[ROW][C]47[/C][C]-0.004929[/C][C]-0.0718[/C][C]0.471426[/C][/ROW]
[ROW][C]48[/C][C]-0.017461[/C][C]-0.2542[/C][C]0.399778[/C][/ROW]
[/TABLE]
Source: https://freestatistics.org/blog/index.php?pk=310349&T=2

Globally Unique Identifier (entire table): ba.freestatistics.org/blog/index.php?pk=310349&T=2

As an alternative you can also use a QR Code:  

The GUIDs for individual cells are displayed in the table below:

Partial Autocorrelation Function
Time lag kPACF(k)T-STATP-value
1-0.016781-0.24430.403604
2-0.292817-4.26351.5e-05
3-0.290168-4.22491.8e-05
4-0.339252-4.93961e-06
50.0660520.96170.168639
60.1106291.61080.054357
70.4448686.47740
80.3084664.49136e-06
90.3109264.52715e-06
10-0.178796-2.60330.004943
11-0.400321-5.82880
120.6304889.180
130.0264180.38470.35044
140.034250.49870.309258
15-0.18619-2.7110.003629
160.0802821.16890.121872
170.0548770.7990.212584
18-0.035876-0.52240.300984
190.0244070.35540.361332
20-0.05066-0.73760.230779
210.035240.51310.304209
22-0.098997-1.44140.075471
23-0.120507-1.75460.040386
240.0169290.24650.402769
25-0.059032-0.85950.195513
26-0.025098-0.36540.357579
27-0.034699-0.50520.306963
280.1220261.77670.038524
29-0.016644-0.24230.404377
300.012740.18550.42651
31-0.00722-0.10510.458191
32-0.049462-0.72020.236106
33-0.034093-0.49640.310061
340.111141.61820.05355
35-0.154647-2.25170.012684
360.0791121.15190.125334
37-3e-04-0.00440.498262
38-0.051298-0.74690.227971
39-0.017303-0.25190.400669
400.062010.90290.183806
41-0.073408-1.06880.143179
42-0.014559-0.2120.416162
430.0442550.64440.260019
44-0.080072-1.16590.12249
45-0.033549-0.48850.312855
46-0.002268-0.0330.486841
47-0.004929-0.07180.471426
48-0.017461-0.25420.399778


Parameters (Session):
par1 = 8 ; par2 = Do not include Seasonal Dummies ; par3 = No Linear Trend ; par4 = 0 ; par5 = 0 ; par6 = 12 ;
Parameters (R input):
par1 = 48 ; par2 = 1 ; par3 = 0 ; par4 = 0 ; par5 = 12 ; par6 = White Noise ; par7 = 0.95 ; par8 = ;
R code (references can be found in the software module):
if (par1 == 'Default') {
par1 = 10*log10(length(x))
} else {
par1 <- as.numeric(par1)
}
par2 <- as.numeric(par2)
par3 <- as.numeric(par3)
par4 <- as.numeric(par4)
par5 <- as.numeric(par5)
if (par6 == 'White Noise') par6 <- 'white' else par6 <- 'ma'
par7 <- as.numeric(par7)
if (par8 != '') par8 <- as.numeric(par8)
x <- na.omit(x)
ox <- x
if (par8 == '') {
if (par2 == 0) {
x <- log(x)
} else {
x <- (x ^ par2 - 1) / par2
}
} else {
x <- log(x,base=par8)
}
if (par3 > 0) x <- diff(x,lag=1,difference=par3)
if (par4 > 0) x <- diff(x,lag=par5,difference=par4)
bitmap(file='picts.png')
op <- par(mfrow=c(2,1))
plot(ox,type='l',main='Original Time Series',xlab='time',ylab='value')
if (par8=='') {
mytitle <- paste('Working Time Series (lambda=',par2,', d=',par3,', D=',par4,')',sep='')
mysub <- paste('(lambda=',par2,', d=',par3,', D=',par4,', CI=', par7, ', CI type=',par6,')',sep='')
} else {
mytitle <- paste('Working Time Series (base=',par8,', d=',par3,', D=',par4,')',sep='')
mysub <- paste('(base=',par8,', d=',par3,', D=',par4,', CI=', par7, ', CI type=',par6,')',sep='')
}
plot(x,type='l', main=mytitle,xlab='time',ylab='value')
par(op)
dev.off()
bitmap(file='pic1.png')
racf <- acf(x, par1, main='Autocorrelation', xlab='time lag', ylab='ACF', ci.type=par6, ci=par7, sub=mysub)
dev.off()
bitmap(file='pic2.png')
rpacf <- pacf(x,par1,main='Partial Autocorrelation',xlab='lags',ylab='PACF',sub=mysub)
dev.off()
(myacf <- c(racf$acf))
(mypacf <- c(rpacf$acf))
lengthx <- length(x)
sqrtn <- sqrt(lengthx)
load(file='createtable')
a<-table.start()
a<-table.row.start(a)
a<-table.element(a,'Autocorrelation Function',4,TRUE)
a<-table.row.end(a)
a<-table.row.start(a)
a<-table.element(a,'Time lag k',header=TRUE)
a<-table.element(a,'ACF(k)',header=TRUE)
a<-table.element(a,'T-STAT',header=TRUE)
a<-table.element(a,'P-value',header=TRUE)
a<-table.row.end(a)
for (i in 2:(par1+1)) {
a<-table.row.start(a)
a<-table.element(a,i-1,header=TRUE)
a<-table.element(a,round(myacf[i],6))
mytstat <- myacf[i]*sqrtn
a<-table.element(a,round(mytstat,4))
a<-table.element(a,round(1-pt(abs(mytstat),lengthx),6))
a<-table.row.end(a)
}
a<-table.end(a)
table.save(a,file='mytable.tab')
a<-table.start()
a<-table.row.start(a)
a<-table.element(a,'Partial Autocorrelation Function',4,TRUE)
a<-table.row.end(a)
a<-table.row.start(a)
a<-table.element(a,'Time lag k',header=TRUE)
a<-table.element(a,'PACF(k)',header=TRUE)
a<-table.element(a,'T-STAT',header=TRUE)
a<-table.element(a,'P-value',header=TRUE)
a<-table.row.end(a)
for (i in 1:par1) {
a<-table.row.start(a)
a<-table.element(a,i,header=TRUE)
a<-table.element(a,round(mypacf[i],6))
mytstat <- mypacf[i]*sqrtn
a<-table.element(a,round(mytstat,4))
a<-table.element(a,round(1-pt(abs(mytstat),lengthx),6))
a<-table.row.end(a)
}
a<-table.end(a)
table.save(a,file='mytable1.tab')