Free Statistics
of Irreproducible Research!
Description of Statistical Computation | ||||||||||||||||||||||||||||||||||||||||||||||
|---|---|---|---|---|---|---|---|---|---|---|---|---|---|---|---|---|---|---|---|---|---|---|---|---|---|---|---|---|---|---|---|---|---|---|---|---|---|---|---|---|---|---|---|---|---|---|
| Author's title | ||||||||||||||||||||||||||||||||||||||||||||||
| Author | *The author of this computation has been verified* | |||||||||||||||||||||||||||||||||||||||||||||
| R Software Module | rwasp_spearman.wasp | |||||||||||||||||||||||||||||||||||||||||||||
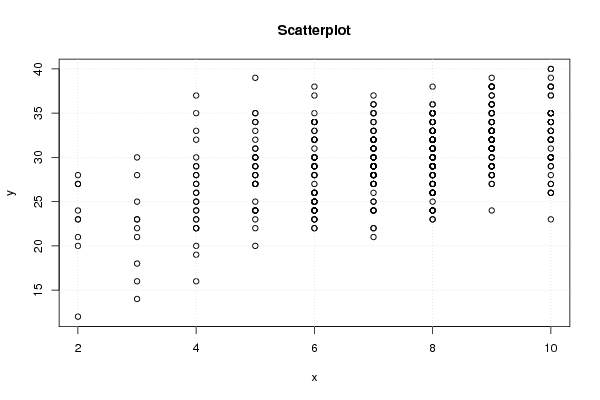
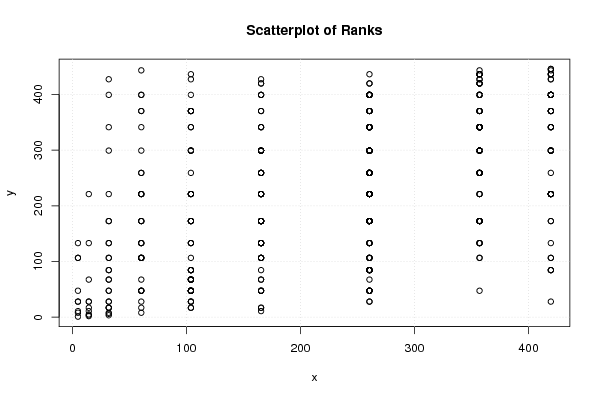
| Title produced by software | Spearman Rank Correlation | |||||||||||||||||||||||||||||||||||||||||||||
| Date of computation | Tue, 19 Dec 2017 14:11:01 +0100 | |||||||||||||||||||||||||||||||||||||||||||||
| Cite this page as follows | Statistical Computations at FreeStatistics.org, Office for Research Development and Education, URL https://freestatistics.org/blog/index.php?v=date/2017/Dec/19/t1513689096fg8ka29uoavc621.htm/, Retrieved Wed, 15 May 2024 16:52:32 +0000 | |||||||||||||||||||||||||||||||||||||||||||||
| Statistical Computations at FreeStatistics.org, Office for Research Development and Education, URL https://freestatistics.org/blog/index.php?pk=310334, Retrieved Wed, 15 May 2024 16:52:32 +0000 | ||||||||||||||||||||||||||||||||||||||||||||||
| QR Codes: | ||||||||||||||||||||||||||||||||||||||||||||||
|
| ||||||||||||||||||||||||||||||||||||||||||||||
| Original text written by user: | ||||||||||||||||||||||||||||||||||||||||||||||
| IsPrivate? | No (this computation is public) | |||||||||||||||||||||||||||||||||||||||||||||
| User-defined keywords | ||||||||||||||||||||||||||||||||||||||||||||||
| Estimated Impact | 82 | |||||||||||||||||||||||||||||||||||||||||||||
Tree of Dependent Computations | ||||||||||||||||||||||||||||||||||||||||||||||
| Family? (F = Feedback message, R = changed R code, M = changed R Module, P = changed Parameters, D = changed Data) | ||||||||||||||||||||||||||||||||||||||||||||||
| - [Spearman Rank Correlation] [Spearman Rank Cor...] [2017-12-19 13:11:01] [1875a8389a5fbce5fbb96440e98cb252] [Current] | ||||||||||||||||||||||||||||||||||||||||||||||
| Feedback Forum | ||||||||||||||||||||||||||||||||||||||||||||||
Post a new message | ||||||||||||||||||||||||||||||||||||||||||||||
Dataset | ||||||||||||||||||||||||||||||||||||||||||||||
| Dataseries X: | ||||||||||||||||||||||||||||||||||||||||||||||
7 8 8 10 8 9 8 10 7 10 8 8 6 7 9 9 8 8 10 7 7 7 6 9 7 8 10 9 8 8 10 8 4 6 7 7 3 8 8 6 10 8 4 8 7 6 9 10 9 7 10 7 10 9 7 10 8 8 6 9 7 8 8 9 5 9 6 8 10 7 5 4 9 10 8 6 6 9 3 7 9 7 8 9 9 8 9 6 7 8 7 9 9 5 6 8 10 5 8 8 10 7 9 8 8 10 9 9 6 8 5 3 6 6 10 9 9 5 6 7 8 9 3 5 5 9 10 7 8 6 5 8 7 5 6 10 10 6 4 8 5 7 10 8 7 2 7 9 8 5 8 6 7 10 8 10 9 8 10 4 6 9 4 6 7 9 8 6 4 8 8 9 6 5 5 8 8 9 7 9 8 6 7 8 8 7 7 8 8 9 9 9 8 2 8 8 8 7 10 8 10 5 4 10 8 7 5 7 9 8 8 2 9 8 5 7 8 7 5 10 6 6 5 7 8 8 4 9 4 10 6 6 8 8 8 8 8 8 7 7 8 10 10 3 8 2 4 4 9 10 6 10 10 3 9 9 6 5 4 4 6 6 8 8 5 7 6 10 8 8 9 5 10 8 9 8 7 10 10 9 4 4 8 9 10 8 5 10 8 7 8 8 9 8 6 8 8 5 9 8 8 8 6 6 9 8 9 10 8 8 7 7 10 8 7 10 7 7 9 9 8 6 8 9 2 6 8 8 7 8 6 10 10 10 8 8 7 10 5 3 2 3 4 2 6 8 8 5 10 9 8 9 8 5 7 9 8 4 7 8 7 7 9 6 7 4 6 10 9 10 8 4 8 5 8 9 8 4 8 10 6 7 10 9 8 3 8 7 7 8 8 7 7 9 9 9 4 6 6 6 8 3 8 8 6 10 2 9 6 6 5 4 7 5 8 6 9 6 4 7 2 8 9 6 5 7 8 4 9 9 9 7 5 7 9 8 6 9 8 7 7 7 8 10 6 6 | ||||||||||||||||||||||||||||||||||||||||||||||
| Dataseries Y: | ||||||||||||||||||||||||||||||||||||||||||||||
22 35 35 32 33 36 35 34 27 30 29 33 32 34 27 31 31 30 40 28 30 27 35 31 28 24 29 38 32 29 37 29 16 38 30 29 30 25 26 24 26 35 25 36 29 37 35 32 29 29 39 30 26 28 32 35 30 34 23 35 29 30 32 32 29 31 30 32 38 29 29 25 37 33 31 30 25 32 22 35 24 30 32 36 32 29 29 30 21 34 33 34 32 35 26 35 29 31 29 29 28 25 31 30 32 34 27 31 24 29 25 28 26 26 27 30 38 24 34 29 24 28 23 24 27 31 30 30 26 25 27 28 29 29 30 30 35 32 24 31 28 30 32 26 24 27 22 34 32 30 29 29 28 30 29 38 32 32 38 27 23 33 23 24 27 29 32 34 23 29 29 36 32 32 30 29 29 33 32 33 28 28 24 32 28 32 33 30 29 32 28 33 32 28 26 30 26 29 31 33 32 24 27 30 27 32 31 33 35 27 27 23 30 27 39 32 32 29 30 35 33 25 33 28 33 29 35 32 29 38 23 29 30 32 32 32 32 34 29 31 23 23 30 14 35 12 20 19 33 33 24 35 35 16 29 33 24 23 22 26 22 24 31 34 34 32 32 32 31 31 35 30 35 33 30 26 35 35 34 32 30 32 32 36 32 33 27 34 34 28 33 38 28 29 26 28 24 35 31 30 26 28 29 24 32 34 37 30 30 23 35 30 35 24 28 30 30 24 38 38 29 29 30 29 21 26 32 35 24 26 25 26 30 27 30 32 30 40 27 18 20 21 22 23 25 31 32 27 33 34 31 33 29 22 31 33 31 33 26 31 28 28 33 34 31 29 31 34 33 37 33 28 35 34 32 34 30 37 24 35 22 25 33 32 35 23 27 27 29 24 31 36 31 38 33 29 26 30 30 24 30 25 30 35 25 35 27 32 27 34 20 22 28 28 33 34 29 29 24 31 24 36 33 28 24 29 26 28 29 35 34 32 28 34 39 33 25 31 31 37 27 36 32 35 33 28 | ||||||||||||||||||||||||||||||||||||||||||||||
Tables (Output of Computation) | ||||||||||||||||||||||||||||||||||||||||||||||
| ||||||||||||||||||||||||||||||||||||||||||||||
Figures (Output of Computation) | ||||||||||||||||||||||||||||||||||||||||||||||
Input Parameters & R Code | ||||||||||||||||||||||||||||||||||||||||||||||
| Parameters (Session): | ||||||||||||||||||||||||||||||||||||||||||||||
| Parameters (R input): | ||||||||||||||||||||||||||||||||||||||||||||||
| R code (references can be found in the software module): | ||||||||||||||||||||||||||||||||||||||||||||||
k <- cor.test(x,y,method='spearman') | ||||||||||||||||||||||||||||||||||||||||||||||