Free Statistics
of Irreproducible Research!
Description of Statistical Computation | ||||||||||||||||||||||||||||||||||||||||||||||
|---|---|---|---|---|---|---|---|---|---|---|---|---|---|---|---|---|---|---|---|---|---|---|---|---|---|---|---|---|---|---|---|---|---|---|---|---|---|---|---|---|---|---|---|---|---|---|
| Author's title | ||||||||||||||||||||||||||||||||||||||||||||||
| Author | *The author of this computation has been verified* | |||||||||||||||||||||||||||||||||||||||||||||
| R Software Module | rwasp_spearman.wasp | |||||||||||||||||||||||||||||||||||||||||||||
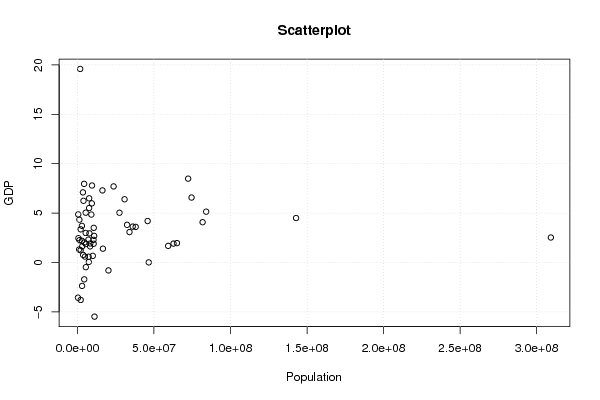
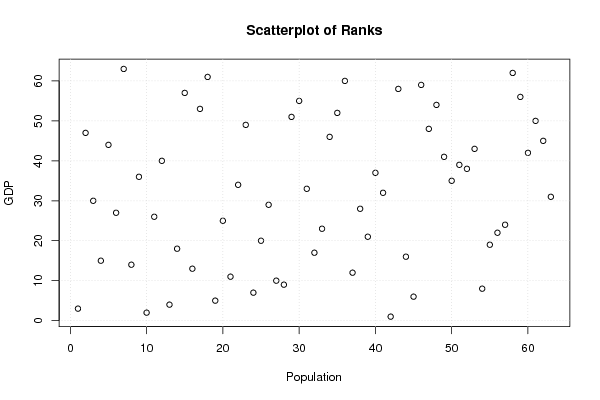
| Title produced by software | Spearman Rank Correlation | |||||||||||||||||||||||||||||||||||||||||||||
| Date of computation | Tue, 19 Dec 2017 09:30:05 +0100 | |||||||||||||||||||||||||||||||||||||||||||||
| Cite this page as follows | Statistical Computations at FreeStatistics.org, Office for Research Development and Education, URL https://freestatistics.org/blog/index.php?v=date/2017/Dec/19/t1513672358etveixia14wprzo.htm/, Retrieved Wed, 15 May 2024 00:53:29 +0000 | |||||||||||||||||||||||||||||||||||||||||||||
| Statistical Computations at FreeStatistics.org, Office for Research Development and Education, URL https://freestatistics.org/blog/index.php?pk=310268, Retrieved Wed, 15 May 2024 00:53:29 +0000 | ||||||||||||||||||||||||||||||||||||||||||||||
| QR Codes: | ||||||||||||||||||||||||||||||||||||||||||||||
|
| ||||||||||||||||||||||||||||||||||||||||||||||
| Original text written by user: | ||||||||||||||||||||||||||||||||||||||||||||||
| IsPrivate? | No (this computation is public) | |||||||||||||||||||||||||||||||||||||||||||||
| User-defined keywords | ||||||||||||||||||||||||||||||||||||||||||||||
| Estimated Impact | 87 | |||||||||||||||||||||||||||||||||||||||||||||
Tree of Dependent Computations | ||||||||||||||||||||||||||||||||||||||||||||||
| Family? (F = Feedback message, R = changed R code, M = changed R Module, P = changed Parameters, D = changed Data) | ||||||||||||||||||||||||||||||||||||||||||||||
| - [Spearman Rank Correlation] [GDP- population] [2017-12-19 08:30:05] [bcddf20144eb569f95336d17c2e1f45a] [Current] | ||||||||||||||||||||||||||||||||||||||||||||||
| Feedback Forum | ||||||||||||||||||||||||||||||||||||||||||||||
Post a new message | ||||||||||||||||||||||||||||||||||||||||||||||
Dataset | ||||||||||||||||||||||||||||||||||||||||||||||
| Dataseries X: | ||||||||||||||||||||||||||||||||||||||||||||||
2913021 36117637 2877311 8363404 9054332 1240862 9490583 10895586 3722084 7395599 34005274 4417781 1112607 10474410 5547683 84107606 1331475 5363352 65027512 3926000 81776930 11121341 10000023 318041 74567511 30762701 4560155 7623600 59277417 7182390 16321581 2998083 5447900 2097555 4337141 3097282 506953 2070739 3562045 619428 32409639 16615394 4889252 38042794 10573100 1779676 20246871 142849449 27425676 7291436 5391428 2048583 46576897 9378126 7824909 7641630 10639931 72326914 45870700 8270684 62766365 309348193 23606779 | ||||||||||||||||||||||||||||||||||||||||||||||
| Dataseries Y: | ||||||||||||||||||||||||||||||||||||||||||||||
3.709999994 3.634145353 2.199999999 1.928673056 4.854339324 4.334407088 7.793696038 2.695144611 0.767254237 0.054557923 3.08351422 -1.701249763 1.317777804 2.295089687 1.870992639 5.14510637 2.259075894 2.992337502 1.965657375 6.24941822 4.079933305 -5.479037108 0.677098149 -3.559864876 6.577374352 6.402564845 2.033546407 5.517022938 1.686523279 2.311392474 7.3 -2.367061944 -0.471566848 -3.78964989 7.960433349 1.639819649 4.86496856 3.358760114 7.100000092 2.463732399 3.815717917 1.402662177 0.601886135 3.606960459 1.898691753 19.59233153 -0.798465536 4.503725626 5.039493675 0.584478088 5.041716665 1.237755909 0.013786544 5.988926547 2.953816768 6.500000353 3.510608639 8.487372187 4.200000018 1.635449055 1.915161833 2.531920616 7.70230704 | ||||||||||||||||||||||||||||||||||||||||||||||
Tables (Output of Computation) | ||||||||||||||||||||||||||||||||||||||||||||||
| ||||||||||||||||||||||||||||||||||||||||||||||
Figures (Output of Computation) | ||||||||||||||||||||||||||||||||||||||||||||||
Input Parameters & R Code | ||||||||||||||||||||||||||||||||||||||||||||||
| Parameters (Session): | ||||||||||||||||||||||||||||||||||||||||||||||
| Parameters (R input): | ||||||||||||||||||||||||||||||||||||||||||||||
| R code (references can be found in the software module): | ||||||||||||||||||||||||||||||||||||||||||||||
k <- cor.test(x,y,method='spearman') | ||||||||||||||||||||||||||||||||||||||||||||||