Free Statistics

of Irreproducible Research!

Author's title

Author*The author of this computation has been verified*
R Software Modulerwasp_autocorrelation.wasp
Title produced by software(Partial) Autocorrelation Function
Date of computationMon, 18 Dec 2017 21:54:24 +0100
Cite this page as followsStatistical Computations at FreeStatistics.org, Office for Research Development and Education, URL https://freestatistics.org/blog/index.php?v=date/2017/Dec/18/t1513630562edvx9a5eckxujx2.htm/, Retrieved Tue, 14 May 2024 03:01:31 +0000
Statistical Computations at FreeStatistics.org, Office for Research Development and Education, URL https://freestatistics.org/blog/index.php?pk=310247, Retrieved Tue, 14 May 2024 03:01:31 +0000
QR Codes:

Original text written by user:
IsPrivate?No (this computation is public)
User-defined keywords
Estimated Impact56
Family? (F = Feedback message, R = changed R code, M = changed R Module, P = changed Parameters, D = changed Data)
-       [(Partial) Autocorrelation Function] [Partial Autocorre...] [2017-12-18 20:54:24] [0052b7a07e7283db712b5a743249b9bd] [Current]
Feedback Forum

Post a new message
Dataseries X:
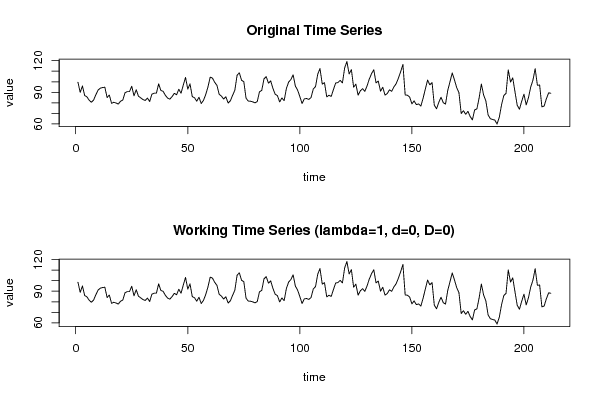
99.5
89.9
96
86.9
85.6
82.5
80.5
82.7
87.7
92.2
93.9
94.5
94.8
85
87.4
79.5
80.5
79.8
78.8
81.5
82.6
89.5
90.7
90.7
95.7
86.6
92.4
86.3
84.7
83.1
82.2
84.5
81.2
88.2
89.1
89.1
98
91.7
90.9
87.1
84.5
83.5
85.9
89
87.6
92.9
89.1
96.9
104.1
93
98
85.9
84.8
81.5
85.3
79.3
82.3
87.8
95
104.4
103.5
99.5
96.6
88.1
86.4
83.6
85.7
79.8
81.9
87.1
92
106.1
108.5
101.4
100.1
84.4
81.6
81.5
80.9
79.9
81.2
90.5
91.7
102.7
104.8
98.7
100.8
93.6
88.1
86.8
80.8
84.6
82
93.6
99.7
102.1
106.6
95.9
92.1
85.9
79.3
83.7
84.1
83.2
85
93.1
95.4
107.3
112.5
97.8
99.1
85.6
87.2
86
92.7
98.8
99.2
101.4
98.8
113.2
119.2
107.4
111.6
94.8
97.7
87.3
91.4
93.4
90.8
96.1
102.6
107.7
111.4
98.9
100.7
91
94.8
87.3
88.8
92.3
90.9
95.2
98.2
103.5
109.7
116.4
87.5
87.2
85.5
79
81.8
78.2
78.9
76.9
84.4
93.1
101.6
97.1
99.3
77.8
74.3
80.4
85.3
80.1
78.8
91.8
100
108.4
101.7
94.4
89.5
69.8
72.5
69.1
71.9
67
63.8
73.2
74.2
84.7
97.8
87.4
81.8
68.6
64.9
64.1
63.6
59.8
66.3
78.1
86.8
89
111.3
99.7
103.7
90.4
77.6
73.9
81.5
88.2
78
84.7
94.8
101.5
112.4
96.6
96.9
76.1
76.9
83.8
89.4
89.1


Summary of computational transaction
Raw Input view raw input (R code)
Raw Outputview raw output of R engine
Computing time2 seconds
R ServerBig Analytics Cloud Computing Center

\begin{tabular}{lllllllll}
\hline
Summary of computational transaction \tabularnewline
Raw Input view raw input (R code)  \tabularnewline
Raw Outputview raw output of R engine  \tabularnewline
Computing time2 seconds \tabularnewline
R ServerBig Analytics Cloud Computing Center \tabularnewline
\hline
\end{tabular}
%Source: https://freestatistics.org/blog/index.php?pk=310247&T=0

[TABLE]
[ROW]
Summary of computational transaction[/C][/ROW] [ROW]Raw Input[/C] view raw input (R code) [/C][/ROW] [ROW]Raw Output[/C]view raw output of R engine [/C][/ROW] [ROW]Computing time[/C]2 seconds[/C][/ROW] [ROW]R Server[/C]Big Analytics Cloud Computing Center[/C][/ROW] [/TABLE] Source: https://freestatistics.org/blog/index.php?pk=310247&T=0

Globally Unique Identifier (entire table): ba.freestatistics.org/blog/index.php?pk=310247&T=0

As an alternative you can also use a QR Code:  

The GUIDs for individual cells are displayed in the table below:

Summary of computational transaction
Raw Input view raw input (R code)
Raw Outputview raw output of R engine
Computing time2 seconds
R ServerBig Analytics Cloud Computing Center


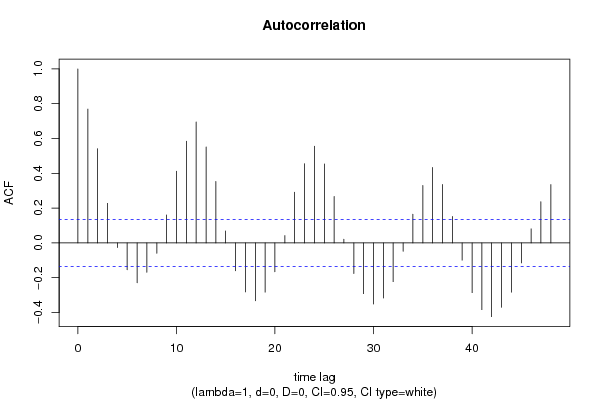
Autocorrelation Function
Time lag kACF(k)T-STATP-value
10.76923311.20020
20.5411847.87980
30.2273213.30990.000548
4-0.026013-0.37880.352624
5-0.154597-2.2510.012707
6-0.228809-3.33150.000509
7-0.16836-2.45140.007521
8-0.059214-0.86220.194785
90.1607142.340.010106
100.4123366.00370
110.5840788.50430
120.69479210.11630
130.5513928.02840
140.3530315.14020
150.0689911.00450.158137
16-0.160363-2.33490.010241
17-0.281572-4.09982.9e-05
18-0.33301-4.84871e-06
19-0.282955-4.11992.7e-05
20-0.165485-2.40950.008414
210.0420440.61220.270539
220.2912474.24061.7e-05
230.4554016.63070
240.5557088.09120
250.4533316.60060
260.2671023.88916.7e-05
270.0214090.31170.377777
28-0.175833-2.56020.005579
29-0.291432-4.24331.6e-05
30-0.351599-5.11940
31-0.316513-4.60854e-06
32-0.222541-3.24020.000693
33-0.047683-0.69430.244136
340.1651752.4050.008516
350.3297894.80181e-06
360.4336766.31440
370.3354434.88411e-06
380.1516832.20850.014139
39-0.099009-1.44160.075446
40-0.28591-4.16292.3e-05
41-0.383767-5.58770
42-0.423894-6.1720
43-0.369493-5.37990
44-0.283173-4.12312.7e-05
45-0.114791-1.67140.048061
460.0805951.17350.120961
470.2362393.43970.000351
480.3352084.88071e-06

\begin{tabular}{lllllllll}
\hline
Autocorrelation Function \tabularnewline
Time lag k & ACF(k) & T-STAT & P-value \tabularnewline
1 & 0.769233 & 11.2002 & 0 \tabularnewline
2 & 0.541184 & 7.8798 & 0 \tabularnewline
3 & 0.227321 & 3.3099 & 0.000548 \tabularnewline
4 & -0.026013 & -0.3788 & 0.352624 \tabularnewline
5 & -0.154597 & -2.251 & 0.012707 \tabularnewline
6 & -0.228809 & -3.3315 & 0.000509 \tabularnewline
7 & -0.16836 & -2.4514 & 0.007521 \tabularnewline
8 & -0.059214 & -0.8622 & 0.194785 \tabularnewline
9 & 0.160714 & 2.34 & 0.010106 \tabularnewline
10 & 0.412336 & 6.0037 & 0 \tabularnewline
11 & 0.584078 & 8.5043 & 0 \tabularnewline
12 & 0.694792 & 10.1163 & 0 \tabularnewline
13 & 0.551392 & 8.0284 & 0 \tabularnewline
14 & 0.353031 & 5.1402 & 0 \tabularnewline
15 & 0.068991 & 1.0045 & 0.158137 \tabularnewline
16 & -0.160363 & -2.3349 & 0.010241 \tabularnewline
17 & -0.281572 & -4.0998 & 2.9e-05 \tabularnewline
18 & -0.33301 & -4.8487 & 1e-06 \tabularnewline
19 & -0.282955 & -4.1199 & 2.7e-05 \tabularnewline
20 & -0.165485 & -2.4095 & 0.008414 \tabularnewline
21 & 0.042044 & 0.6122 & 0.270539 \tabularnewline
22 & 0.291247 & 4.2406 & 1.7e-05 \tabularnewline
23 & 0.455401 & 6.6307 & 0 \tabularnewline
24 & 0.555708 & 8.0912 & 0 \tabularnewline
25 & 0.453331 & 6.6006 & 0 \tabularnewline
26 & 0.267102 & 3.8891 & 6.7e-05 \tabularnewline
27 & 0.021409 & 0.3117 & 0.377777 \tabularnewline
28 & -0.175833 & -2.5602 & 0.005579 \tabularnewline
29 & -0.291432 & -4.2433 & 1.6e-05 \tabularnewline
30 & -0.351599 & -5.1194 & 0 \tabularnewline
31 & -0.316513 & -4.6085 & 4e-06 \tabularnewline
32 & -0.222541 & -3.2402 & 0.000693 \tabularnewline
33 & -0.047683 & -0.6943 & 0.244136 \tabularnewline
34 & 0.165175 & 2.405 & 0.008516 \tabularnewline
35 & 0.329789 & 4.8018 & 1e-06 \tabularnewline
36 & 0.433676 & 6.3144 & 0 \tabularnewline
37 & 0.335443 & 4.8841 & 1e-06 \tabularnewline
38 & 0.151683 & 2.2085 & 0.014139 \tabularnewline
39 & -0.099009 & -1.4416 & 0.075446 \tabularnewline
40 & -0.28591 & -4.1629 & 2.3e-05 \tabularnewline
41 & -0.383767 & -5.5877 & 0 \tabularnewline
42 & -0.423894 & -6.172 & 0 \tabularnewline
43 & -0.369493 & -5.3799 & 0 \tabularnewline
44 & -0.283173 & -4.1231 & 2.7e-05 \tabularnewline
45 & -0.114791 & -1.6714 & 0.048061 \tabularnewline
46 & 0.080595 & 1.1735 & 0.120961 \tabularnewline
47 & 0.236239 & 3.4397 & 0.000351 \tabularnewline
48 & 0.335208 & 4.8807 & 1e-06 \tabularnewline
\hline
\end{tabular}
%Source: https://freestatistics.org/blog/index.php?pk=310247&T=1

[TABLE]
[ROW][C]Autocorrelation Function[/C][/ROW]
[ROW][C]Time lag k[/C][C]ACF(k)[/C][C]T-STAT[/C][C]P-value[/C][/ROW]
[ROW][C]1[/C][C]0.769233[/C][C]11.2002[/C][C]0[/C][/ROW]
[ROW][C]2[/C][C]0.541184[/C][C]7.8798[/C][C]0[/C][/ROW]
[ROW][C]3[/C][C]0.227321[/C][C]3.3099[/C][C]0.000548[/C][/ROW]
[ROW][C]4[/C][C]-0.026013[/C][C]-0.3788[/C][C]0.352624[/C][/ROW]
[ROW][C]5[/C][C]-0.154597[/C][C]-2.251[/C][C]0.012707[/C][/ROW]
[ROW][C]6[/C][C]-0.228809[/C][C]-3.3315[/C][C]0.000509[/C][/ROW]
[ROW][C]7[/C][C]-0.16836[/C][C]-2.4514[/C][C]0.007521[/C][/ROW]
[ROW][C]8[/C][C]-0.059214[/C][C]-0.8622[/C][C]0.194785[/C][/ROW]
[ROW][C]9[/C][C]0.160714[/C][C]2.34[/C][C]0.010106[/C][/ROW]
[ROW][C]10[/C][C]0.412336[/C][C]6.0037[/C][C]0[/C][/ROW]
[ROW][C]11[/C][C]0.584078[/C][C]8.5043[/C][C]0[/C][/ROW]
[ROW][C]12[/C][C]0.694792[/C][C]10.1163[/C][C]0[/C][/ROW]
[ROW][C]13[/C][C]0.551392[/C][C]8.0284[/C][C]0[/C][/ROW]
[ROW][C]14[/C][C]0.353031[/C][C]5.1402[/C][C]0[/C][/ROW]
[ROW][C]15[/C][C]0.068991[/C][C]1.0045[/C][C]0.158137[/C][/ROW]
[ROW][C]16[/C][C]-0.160363[/C][C]-2.3349[/C][C]0.010241[/C][/ROW]
[ROW][C]17[/C][C]-0.281572[/C][C]-4.0998[/C][C]2.9e-05[/C][/ROW]
[ROW][C]18[/C][C]-0.33301[/C][C]-4.8487[/C][C]1e-06[/C][/ROW]
[ROW][C]19[/C][C]-0.282955[/C][C]-4.1199[/C][C]2.7e-05[/C][/ROW]
[ROW][C]20[/C][C]-0.165485[/C][C]-2.4095[/C][C]0.008414[/C][/ROW]
[ROW][C]21[/C][C]0.042044[/C][C]0.6122[/C][C]0.270539[/C][/ROW]
[ROW][C]22[/C][C]0.291247[/C][C]4.2406[/C][C]1.7e-05[/C][/ROW]
[ROW][C]23[/C][C]0.455401[/C][C]6.6307[/C][C]0[/C][/ROW]
[ROW][C]24[/C][C]0.555708[/C][C]8.0912[/C][C]0[/C][/ROW]
[ROW][C]25[/C][C]0.453331[/C][C]6.6006[/C][C]0[/C][/ROW]
[ROW][C]26[/C][C]0.267102[/C][C]3.8891[/C][C]6.7e-05[/C][/ROW]
[ROW][C]27[/C][C]0.021409[/C][C]0.3117[/C][C]0.377777[/C][/ROW]
[ROW][C]28[/C][C]-0.175833[/C][C]-2.5602[/C][C]0.005579[/C][/ROW]
[ROW][C]29[/C][C]-0.291432[/C][C]-4.2433[/C][C]1.6e-05[/C][/ROW]
[ROW][C]30[/C][C]-0.351599[/C][C]-5.1194[/C][C]0[/C][/ROW]
[ROW][C]31[/C][C]-0.316513[/C][C]-4.6085[/C][C]4e-06[/C][/ROW]
[ROW][C]32[/C][C]-0.222541[/C][C]-3.2402[/C][C]0.000693[/C][/ROW]
[ROW][C]33[/C][C]-0.047683[/C][C]-0.6943[/C][C]0.244136[/C][/ROW]
[ROW][C]34[/C][C]0.165175[/C][C]2.405[/C][C]0.008516[/C][/ROW]
[ROW][C]35[/C][C]0.329789[/C][C]4.8018[/C][C]1e-06[/C][/ROW]
[ROW][C]36[/C][C]0.433676[/C][C]6.3144[/C][C]0[/C][/ROW]
[ROW][C]37[/C][C]0.335443[/C][C]4.8841[/C][C]1e-06[/C][/ROW]
[ROW][C]38[/C][C]0.151683[/C][C]2.2085[/C][C]0.014139[/C][/ROW]
[ROW][C]39[/C][C]-0.099009[/C][C]-1.4416[/C][C]0.075446[/C][/ROW]
[ROW][C]40[/C][C]-0.28591[/C][C]-4.1629[/C][C]2.3e-05[/C][/ROW]
[ROW][C]41[/C][C]-0.383767[/C][C]-5.5877[/C][C]0[/C][/ROW]
[ROW][C]42[/C][C]-0.423894[/C][C]-6.172[/C][C]0[/C][/ROW]
[ROW][C]43[/C][C]-0.369493[/C][C]-5.3799[/C][C]0[/C][/ROW]
[ROW][C]44[/C][C]-0.283173[/C][C]-4.1231[/C][C]2.7e-05[/C][/ROW]
[ROW][C]45[/C][C]-0.114791[/C][C]-1.6714[/C][C]0.048061[/C][/ROW]
[ROW][C]46[/C][C]0.080595[/C][C]1.1735[/C][C]0.120961[/C][/ROW]
[ROW][C]47[/C][C]0.236239[/C][C]3.4397[/C][C]0.000351[/C][/ROW]
[ROW][C]48[/C][C]0.335208[/C][C]4.8807[/C][C]1e-06[/C][/ROW]
[/TABLE]
Source: https://freestatistics.org/blog/index.php?pk=310247&T=1

Globally Unique Identifier (entire table): ba.freestatistics.org/blog/index.php?pk=310247&T=1

As an alternative you can also use a QR Code:  

The GUIDs for individual cells are displayed in the table below:

Autocorrelation Function
Time lag kACF(k)T-STATP-value
10.76923311.20020
20.5411847.87980
30.2273213.30990.000548
4-0.026013-0.37880.352624
5-0.154597-2.2510.012707
6-0.228809-3.33150.000509
7-0.16836-2.45140.007521
8-0.059214-0.86220.194785
90.1607142.340.010106
100.4123366.00370
110.5840788.50430
120.69479210.11630
130.5513928.02840
140.3530315.14020
150.0689911.00450.158137
16-0.160363-2.33490.010241
17-0.281572-4.09982.9e-05
18-0.33301-4.84871e-06
19-0.282955-4.11992.7e-05
20-0.165485-2.40950.008414
210.0420440.61220.270539
220.2912474.24061.7e-05
230.4554016.63070
240.5557088.09120
250.4533316.60060
260.2671023.88916.7e-05
270.0214090.31170.377777
28-0.175833-2.56020.005579
29-0.291432-4.24331.6e-05
30-0.351599-5.11940
31-0.316513-4.60854e-06
32-0.222541-3.24020.000693
33-0.047683-0.69430.244136
340.1651752.4050.008516
350.3297894.80181e-06
360.4336766.31440
370.3354434.88411e-06
380.1516832.20850.014139
39-0.099009-1.44160.075446
40-0.28591-4.16292.3e-05
41-0.383767-5.58770
42-0.423894-6.1720
43-0.369493-5.37990
44-0.283173-4.12312.7e-05
45-0.114791-1.67140.048061
460.0805951.17350.120961
470.2362393.43970.000351
480.3352084.88071e-06


Partial Autocorrelation Function
Time lag kPACF(k)T-STATP-value
10.76923311.20020
2-0.123778-1.80220.036464
3-0.361394-5.2620
4-0.104252-1.51790.065261
50.138622.01830.022408
6-0.06345-0.92380.178309
70.1028041.49680.06796
80.1125391.63860.05139
90.3083214.48926e-06
100.3176634.62523e-06
110.0928421.35180.08894
120.1738662.53150.006041
13-0.263548-3.83738.2e-05
14-0.098783-1.43830.075911
15-0.126708-1.84490.033224
16-0.04902-0.71370.238084
170.0147720.21510.414955
18-0.010045-0.14630.441926
19-0.113261-1.64910.050304
20-0.002515-0.03660.485409
210.0673420.98050.163976
220.1435612.09030.018893
23-0.014173-0.20640.418354
240.0815611.18750.118172
250.0005150.00750.497013
26-0.039848-0.58020.281198
27-0.018273-0.26610.395225
280.0655120.95390.170618
290.0011450.01670.493355
30-0.094341-1.37360.085505
31-0.085129-1.23950.108266
32-0.072769-1.05950.145281
33-0.02614-0.38060.351937
34-0.03325-0.48410.314398
350.0186740.27190.392981
360.0713041.03820.150179
37-0.119891-1.74560.041161
38-0.126112-1.83620.033863
39-0.102004-1.48520.069488
400.0585160.8520.197586
410.0921351.34150.090595
42-0.01723-0.25090.401076
430.0111740.16270.435458
44-0.026259-0.38230.351296
450.0013910.02030.491931
46-0.029548-0.43020.333737
47-0.009003-0.13110.447915
480.077011.12130.131718

\begin{tabular}{lllllllll}
\hline
Partial Autocorrelation Function \tabularnewline
Time lag k & PACF(k) & T-STAT & P-value \tabularnewline
1 & 0.769233 & 11.2002 & 0 \tabularnewline
2 & -0.123778 & -1.8022 & 0.036464 \tabularnewline
3 & -0.361394 & -5.262 & 0 \tabularnewline
4 & -0.104252 & -1.5179 & 0.065261 \tabularnewline
5 & 0.13862 & 2.0183 & 0.022408 \tabularnewline
6 & -0.06345 & -0.9238 & 0.178309 \tabularnewline
7 & 0.102804 & 1.4968 & 0.06796 \tabularnewline
8 & 0.112539 & 1.6386 & 0.05139 \tabularnewline
9 & 0.308321 & 4.4892 & 6e-06 \tabularnewline
10 & 0.317663 & 4.6252 & 3e-06 \tabularnewline
11 & 0.092842 & 1.3518 & 0.08894 \tabularnewline
12 & 0.173866 & 2.5315 & 0.006041 \tabularnewline
13 & -0.263548 & -3.8373 & 8.2e-05 \tabularnewline
14 & -0.098783 & -1.4383 & 0.075911 \tabularnewline
15 & -0.126708 & -1.8449 & 0.033224 \tabularnewline
16 & -0.04902 & -0.7137 & 0.238084 \tabularnewline
17 & 0.014772 & 0.2151 & 0.414955 \tabularnewline
18 & -0.010045 & -0.1463 & 0.441926 \tabularnewline
19 & -0.113261 & -1.6491 & 0.050304 \tabularnewline
20 & -0.002515 & -0.0366 & 0.485409 \tabularnewline
21 & 0.067342 & 0.9805 & 0.163976 \tabularnewline
22 & 0.143561 & 2.0903 & 0.018893 \tabularnewline
23 & -0.014173 & -0.2064 & 0.418354 \tabularnewline
24 & 0.081561 & 1.1875 & 0.118172 \tabularnewline
25 & 0.000515 & 0.0075 & 0.497013 \tabularnewline
26 & -0.039848 & -0.5802 & 0.281198 \tabularnewline
27 & -0.018273 & -0.2661 & 0.395225 \tabularnewline
28 & 0.065512 & 0.9539 & 0.170618 \tabularnewline
29 & 0.001145 & 0.0167 & 0.493355 \tabularnewline
30 & -0.094341 & -1.3736 & 0.085505 \tabularnewline
31 & -0.085129 & -1.2395 & 0.108266 \tabularnewline
32 & -0.072769 & -1.0595 & 0.145281 \tabularnewline
33 & -0.02614 & -0.3806 & 0.351937 \tabularnewline
34 & -0.03325 & -0.4841 & 0.314398 \tabularnewline
35 & 0.018674 & 0.2719 & 0.392981 \tabularnewline
36 & 0.071304 & 1.0382 & 0.150179 \tabularnewline
37 & -0.119891 & -1.7456 & 0.041161 \tabularnewline
38 & -0.126112 & -1.8362 & 0.033863 \tabularnewline
39 & -0.102004 & -1.4852 & 0.069488 \tabularnewline
40 & 0.058516 & 0.852 & 0.197586 \tabularnewline
41 & 0.092135 & 1.3415 & 0.090595 \tabularnewline
42 & -0.01723 & -0.2509 & 0.401076 \tabularnewline
43 & 0.011174 & 0.1627 & 0.435458 \tabularnewline
44 & -0.026259 & -0.3823 & 0.351296 \tabularnewline
45 & 0.001391 & 0.0203 & 0.491931 \tabularnewline
46 & -0.029548 & -0.4302 & 0.333737 \tabularnewline
47 & -0.009003 & -0.1311 & 0.447915 \tabularnewline
48 & 0.07701 & 1.1213 & 0.131718 \tabularnewline
\hline
\end{tabular}
%Source: https://freestatistics.org/blog/index.php?pk=310247&T=2

[TABLE]
[ROW][C]Partial Autocorrelation Function[/C][/ROW]
[ROW][C]Time lag k[/C][C]PACF(k)[/C][C]T-STAT[/C][C]P-value[/C][/ROW]
[ROW][C]1[/C][C]0.769233[/C][C]11.2002[/C][C]0[/C][/ROW]
[ROW][C]2[/C][C]-0.123778[/C][C]-1.8022[/C][C]0.036464[/C][/ROW]
[ROW][C]3[/C][C]-0.361394[/C][C]-5.262[/C][C]0[/C][/ROW]
[ROW][C]4[/C][C]-0.104252[/C][C]-1.5179[/C][C]0.065261[/C][/ROW]
[ROW][C]5[/C][C]0.13862[/C][C]2.0183[/C][C]0.022408[/C][/ROW]
[ROW][C]6[/C][C]-0.06345[/C][C]-0.9238[/C][C]0.178309[/C][/ROW]
[ROW][C]7[/C][C]0.102804[/C][C]1.4968[/C][C]0.06796[/C][/ROW]
[ROW][C]8[/C][C]0.112539[/C][C]1.6386[/C][C]0.05139[/C][/ROW]
[ROW][C]9[/C][C]0.308321[/C][C]4.4892[/C][C]6e-06[/C][/ROW]
[ROW][C]10[/C][C]0.317663[/C][C]4.6252[/C][C]3e-06[/C][/ROW]
[ROW][C]11[/C][C]0.092842[/C][C]1.3518[/C][C]0.08894[/C][/ROW]
[ROW][C]12[/C][C]0.173866[/C][C]2.5315[/C][C]0.006041[/C][/ROW]
[ROW][C]13[/C][C]-0.263548[/C][C]-3.8373[/C][C]8.2e-05[/C][/ROW]
[ROW][C]14[/C][C]-0.098783[/C][C]-1.4383[/C][C]0.075911[/C][/ROW]
[ROW][C]15[/C][C]-0.126708[/C][C]-1.8449[/C][C]0.033224[/C][/ROW]
[ROW][C]16[/C][C]-0.04902[/C][C]-0.7137[/C][C]0.238084[/C][/ROW]
[ROW][C]17[/C][C]0.014772[/C][C]0.2151[/C][C]0.414955[/C][/ROW]
[ROW][C]18[/C][C]-0.010045[/C][C]-0.1463[/C][C]0.441926[/C][/ROW]
[ROW][C]19[/C][C]-0.113261[/C][C]-1.6491[/C][C]0.050304[/C][/ROW]
[ROW][C]20[/C][C]-0.002515[/C][C]-0.0366[/C][C]0.485409[/C][/ROW]
[ROW][C]21[/C][C]0.067342[/C][C]0.9805[/C][C]0.163976[/C][/ROW]
[ROW][C]22[/C][C]0.143561[/C][C]2.0903[/C][C]0.018893[/C][/ROW]
[ROW][C]23[/C][C]-0.014173[/C][C]-0.2064[/C][C]0.418354[/C][/ROW]
[ROW][C]24[/C][C]0.081561[/C][C]1.1875[/C][C]0.118172[/C][/ROW]
[ROW][C]25[/C][C]0.000515[/C][C]0.0075[/C][C]0.497013[/C][/ROW]
[ROW][C]26[/C][C]-0.039848[/C][C]-0.5802[/C][C]0.281198[/C][/ROW]
[ROW][C]27[/C][C]-0.018273[/C][C]-0.2661[/C][C]0.395225[/C][/ROW]
[ROW][C]28[/C][C]0.065512[/C][C]0.9539[/C][C]0.170618[/C][/ROW]
[ROW][C]29[/C][C]0.001145[/C][C]0.0167[/C][C]0.493355[/C][/ROW]
[ROW][C]30[/C][C]-0.094341[/C][C]-1.3736[/C][C]0.085505[/C][/ROW]
[ROW][C]31[/C][C]-0.085129[/C][C]-1.2395[/C][C]0.108266[/C][/ROW]
[ROW][C]32[/C][C]-0.072769[/C][C]-1.0595[/C][C]0.145281[/C][/ROW]
[ROW][C]33[/C][C]-0.02614[/C][C]-0.3806[/C][C]0.351937[/C][/ROW]
[ROW][C]34[/C][C]-0.03325[/C][C]-0.4841[/C][C]0.314398[/C][/ROW]
[ROW][C]35[/C][C]0.018674[/C][C]0.2719[/C][C]0.392981[/C][/ROW]
[ROW][C]36[/C][C]0.071304[/C][C]1.0382[/C][C]0.150179[/C][/ROW]
[ROW][C]37[/C][C]-0.119891[/C][C]-1.7456[/C][C]0.041161[/C][/ROW]
[ROW][C]38[/C][C]-0.126112[/C][C]-1.8362[/C][C]0.033863[/C][/ROW]
[ROW][C]39[/C][C]-0.102004[/C][C]-1.4852[/C][C]0.069488[/C][/ROW]
[ROW][C]40[/C][C]0.058516[/C][C]0.852[/C][C]0.197586[/C][/ROW]
[ROW][C]41[/C][C]0.092135[/C][C]1.3415[/C][C]0.090595[/C][/ROW]
[ROW][C]42[/C][C]-0.01723[/C][C]-0.2509[/C][C]0.401076[/C][/ROW]
[ROW][C]43[/C][C]0.011174[/C][C]0.1627[/C][C]0.435458[/C][/ROW]
[ROW][C]44[/C][C]-0.026259[/C][C]-0.3823[/C][C]0.351296[/C][/ROW]
[ROW][C]45[/C][C]0.001391[/C][C]0.0203[/C][C]0.491931[/C][/ROW]
[ROW][C]46[/C][C]-0.029548[/C][C]-0.4302[/C][C]0.333737[/C][/ROW]
[ROW][C]47[/C][C]-0.009003[/C][C]-0.1311[/C][C]0.447915[/C][/ROW]
[ROW][C]48[/C][C]0.07701[/C][C]1.1213[/C][C]0.131718[/C][/ROW]
[/TABLE]
Source: https://freestatistics.org/blog/index.php?pk=310247&T=2

Globally Unique Identifier (entire table): ba.freestatistics.org/blog/index.php?pk=310247&T=2

As an alternative you can also use a QR Code:  

The GUIDs for individual cells are displayed in the table below:

Partial Autocorrelation Function
Time lag kPACF(k)T-STATP-value
10.76923311.20020
2-0.123778-1.80220.036464
3-0.361394-5.2620
4-0.104252-1.51790.065261
50.138622.01830.022408
6-0.06345-0.92380.178309
70.1028041.49680.06796
80.1125391.63860.05139
90.3083214.48926e-06
100.3176634.62523e-06
110.0928421.35180.08894
120.1738662.53150.006041
13-0.263548-3.83738.2e-05
14-0.098783-1.43830.075911
15-0.126708-1.84490.033224
16-0.04902-0.71370.238084
170.0147720.21510.414955
18-0.010045-0.14630.441926
19-0.113261-1.64910.050304
20-0.002515-0.03660.485409
210.0673420.98050.163976
220.1435612.09030.018893
23-0.014173-0.20640.418354
240.0815611.18750.118172
250.0005150.00750.497013
26-0.039848-0.58020.281198
27-0.018273-0.26610.395225
280.0655120.95390.170618
290.0011450.01670.493355
30-0.094341-1.37360.085505
31-0.085129-1.23950.108266
32-0.072769-1.05950.145281
33-0.02614-0.38060.351937
34-0.03325-0.48410.314398
350.0186740.27190.392981
360.0713041.03820.150179
37-0.119891-1.74560.041161
38-0.126112-1.83620.033863
39-0.102004-1.48520.069488
400.0585160.8520.197586
410.0921351.34150.090595
42-0.01723-0.25090.401076
430.0111740.16270.435458
44-0.026259-0.38230.351296
450.0013910.02030.491931
46-0.029548-0.43020.333737
47-0.009003-0.13110.447915
480.077011.12130.131718


Parameters (Session):
par1 = 48 ; par2 = 1 ; par3 = 0 ; par4 = 0 ; par5 = 12 ; par6 = White Noise ; par7 = 0.95 ;
Parameters (R input):
par1 = 48 ; par2 = 1 ; par3 = 0 ; par4 = 0 ; par5 = 12 ; par6 = White Noise ; par7 = 0.95 ; par8 = ;
R code (references can be found in the software module):
if (par1 == 'Default') {
par1 = 10*log10(length(x))
} else {
par1 <- as.numeric(par1)
}
par2 <- as.numeric(par2)
par3 <- as.numeric(par3)
par4 <- as.numeric(par4)
par5 <- as.numeric(par5)
if (par6 == 'White Noise') par6 <- 'white' else par6 <- 'ma'
par7 <- as.numeric(par7)
if (par8 != '') par8 <- as.numeric(par8)
x <- na.omit(x)
ox <- x
if (par8 == '') {
if (par2 == 0) {
x <- log(x)
} else {
x <- (x ^ par2 - 1) / par2
}
} else {
x <- log(x,base=par8)
}
if (par3 > 0) x <- diff(x,lag=1,difference=par3)
if (par4 > 0) x <- diff(x,lag=par5,difference=par4)
bitmap(file='picts.png')
op <- par(mfrow=c(2,1))
plot(ox,type='l',main='Original Time Series',xlab='time',ylab='value')
if (par8=='') {
mytitle <- paste('Working Time Series (lambda=',par2,', d=',par3,', D=',par4,')',sep='')
mysub <- paste('(lambda=',par2,', d=',par3,', D=',par4,', CI=', par7, ', CI type=',par6,')',sep='')
} else {
mytitle <- paste('Working Time Series (base=',par8,', d=',par3,', D=',par4,')',sep='')
mysub <- paste('(base=',par8,', d=',par3,', D=',par4,', CI=', par7, ', CI type=',par6,')',sep='')
}
plot(x,type='l', main=mytitle,xlab='time',ylab='value')
par(op)
dev.off()
bitmap(file='pic1.png')
racf <- acf(x, par1, main='Autocorrelation', xlab='time lag', ylab='ACF', ci.type=par6, ci=par7, sub=mysub)
dev.off()
bitmap(file='pic2.png')
rpacf <- pacf(x,par1,main='Partial Autocorrelation',xlab='lags',ylab='PACF',sub=mysub)
dev.off()
(myacf <- c(racf$acf))
(mypacf <- c(rpacf$acf))
lengthx <- length(x)
sqrtn <- sqrt(lengthx)
load(file='createtable')
a<-table.start()
a<-table.row.start(a)
a<-table.element(a,'Autocorrelation Function',4,TRUE)
a<-table.row.end(a)
a<-table.row.start(a)
a<-table.element(a,'Time lag k',header=TRUE)
a<-table.element(a,'ACF(k)',header=TRUE)
a<-table.element(a,'T-STAT',header=TRUE)
a<-table.element(a,'P-value',header=TRUE)
a<-table.row.end(a)
for (i in 2:(par1+1)) {
a<-table.row.start(a)
a<-table.element(a,i-1,header=TRUE)
a<-table.element(a,round(myacf[i],6))
mytstat <- myacf[i]*sqrtn
a<-table.element(a,round(mytstat,4))
a<-table.element(a,round(1-pt(abs(mytstat),lengthx),6))
a<-table.row.end(a)
}
a<-table.end(a)
table.save(a,file='mytable.tab')
a<-table.start()
a<-table.row.start(a)
a<-table.element(a,'Partial Autocorrelation Function',4,TRUE)
a<-table.row.end(a)
a<-table.row.start(a)
a<-table.element(a,'Time lag k',header=TRUE)
a<-table.element(a,'PACF(k)',header=TRUE)
a<-table.element(a,'T-STAT',header=TRUE)
a<-table.element(a,'P-value',header=TRUE)
a<-table.row.end(a)
for (i in 1:par1) {
a<-table.row.start(a)
a<-table.element(a,i,header=TRUE)
a<-table.element(a,round(mypacf[i],6))
mytstat <- mypacf[i]*sqrtn
a<-table.element(a,round(mytstat,4))
a<-table.element(a,round(1-pt(abs(mytstat),lengthx),6))
a<-table.row.end(a)
}
a<-table.end(a)
table.save(a,file='mytable1.tab')