Free Statistics

of Irreproducible Research!

Author's title

Author*The author of this computation has been verified*
R Software Modulerwasp_autocorrelation.wasp
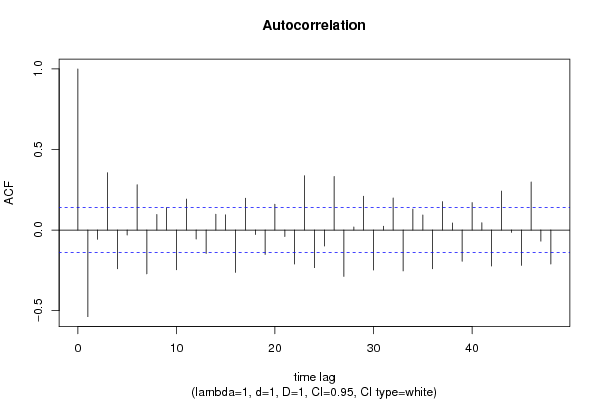
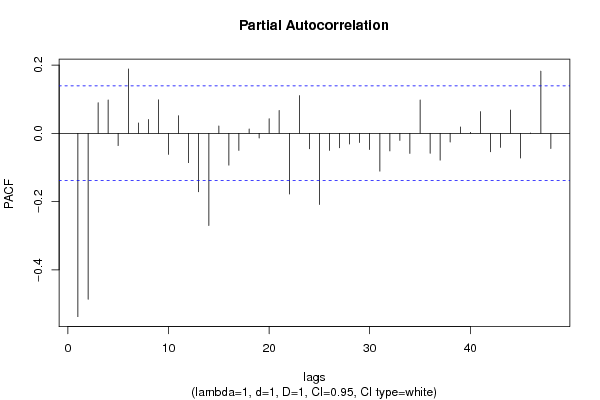
Title produced by software(Partial) Autocorrelation Function
Date of computationMon, 18 Dec 2017 16:44:36 +0100
Cite this page as followsStatistical Computations at FreeStatistics.org, Office for Research Development and Education, URL https://freestatistics.org/blog/index.php?v=date/2017/Dec/18/t1513612095mf6nbad89j4la6k.htm/, Retrieved Tue, 14 May 2024 20:27:00 +0000
Statistical Computations at FreeStatistics.org, Office for Research Development and Education, URL https://freestatistics.org/blog/index.php?pk=310204, Retrieved Tue, 14 May 2024 20:27:00 +0000
QR Codes:

Original text written by user:
IsPrivate?No (this computation is public)
User-defined keywords
Estimated Impact44
Family? (F = Feedback message, R = changed R code, M = changed R Module, P = changed Parameters, D = changed Data)
-       [(Partial) Autocorrelation Function] [autocorr volledig] [2017-12-18 15:44:36] [ec772448347bb766a411d58621b503be] [Current]
Feedback Forum

Post a new message
Dataseries X:
112.7
122
134.7
109.8
130.8
118.7
104.4
87.8
134.2
143.9
140.4
111
126.3
124.4
136.1
118.4
127.4
127.9
115
90.2
131
143.3
131.5
98.5
124.9
122.4
128.8
125.9
120.2
120
116
89.2
135.9
148.7
128.1
100.9
125.5
119.8
120.7
125
109
114.2
105.6
80.1
131.1
136.6
119.7
102.4
114.5
112.9
131.8
118.7
107.1
127
104.6
85.9
134
127.6
121.5
104.5
107.3
111.9
120.7
116.9
106.1
122.3
97.8
82.7
128.2
119
127.4
106
108.7
113.5
131.4
111.3
119
130.7
104.5
88.9
135.4
140.6
138.8
107.4
120.8
124.1
139.2
119.9
121
133.7
115.2
96.7
131
147.6
132.9
97.4
123.6
124.9
118.6
127.6
110.2
115.4
106.6
75.5
116.7
118
98.7
81.5
87
86.8
96.8
92.7
82.1
94.1
89.7
67.5
102
103.2
95.6
83
87.2
94
107.7
103.3
94.8
112.7
96.8
75.9
116.7
111.4
108.6
90.9
92.6
95.7
116.7
95.4
105.1
99.7
89.8
74
108
102.1
100.2
83.2
87.9
93.3
98.5
84.5
89.3
94.2
83.5
67.5
89.4
102.4
92
65.9
85.3
87
91.8
88.5
89.1
89.8
88.9
64
93.2
100.1
89.3
68.1
94.3
93.3
98.1
96.8
87.8
95.6
95.7
64.4
108.1
109.6
90.9
75.6
93.5
98.1
104.5
102.7
89.6
108.8
95.4
70.1
104.6
105.5
96.8
79.4
92.3
96.8
103
99.5
91
103.4
82
70.1
98.1
95.7
98
77.3
89.8
91.6
106.5
87.5
99.5
104.4
84.5
68.3


Summary of computational transaction
Raw Input view raw input (R code)
Raw Outputview raw output of R engine
Computing time2 seconds
R ServerBig Analytics Cloud Computing Center

\begin{tabular}{lllllllll}
\hline
Summary of computational transaction \tabularnewline
Raw Input view raw input (R code)  \tabularnewline
Raw Outputview raw output of R engine  \tabularnewline
Computing time2 seconds \tabularnewline
R ServerBig Analytics Cloud Computing Center \tabularnewline
\hline
\end{tabular}
%Source: https://freestatistics.org/blog/index.php?pk=310204&T=0

[TABLE]
[ROW]
Summary of computational transaction[/C][/ROW] [ROW]Raw Input[/C] view raw input (R code) [/C][/ROW] [ROW]Raw Output[/C]view raw output of R engine [/C][/ROW] [ROW]Computing time[/C]2 seconds[/C][/ROW] [ROW]R Server[/C]Big Analytics Cloud Computing Center[/C][/ROW] [/TABLE] Source: https://freestatistics.org/blog/index.php?pk=310204&T=0

Globally Unique Identifier (entire table): ba.freestatistics.org/blog/index.php?pk=310204&T=0

As an alternative you can also use a QR Code:  

The GUIDs for individual cells are displayed in the table below:

Summary of computational transaction
Raw Input view raw input (R code)
Raw Outputview raw output of R engine
Computing time2 seconds
R ServerBig Analytics Cloud Computing Center


Autocorrelation Function
Time lag kACF(k)T-STATP-value
1-0.537487-7.58220
2-0.057101-0.80550.210742
30.3557795.01891e-06
4-0.240638-3.39460.000415
5-0.030342-0.4280.334549
60.2809643.96355.1e-05
7-0.271813-3.83448.4e-05
80.0968081.36560.086797
90.1392631.96460.025429
10-0.246431-3.47630.000312
110.1922982.71270.003629
12-0.05578-0.78690.216146
13-0.144765-2.04220.021227
140.0978591.38050.084496
150.0944051.33170.092234
16-0.262843-3.70790.000136
170.1976052.78760.002913
18-0.028021-0.39530.346528
19-0.151124-2.13190.017122
200.1602532.26060.012432
21-0.040138-0.56620.28594
22-0.210865-2.97460.001648
230.3374264.762e-06
24-0.233231-3.29010.000592
25-0.09878-1.39350.082517
260.3330184.69782e-06
27-0.287645-4.05773.6e-05
280.0192650.27180.393044
290.2100542.96320.001708
30-0.247664-3.49370.000293
310.0241130.34020.36705
320.1991412.80920.002731
33-0.253479-3.57580.000219
340.1300331.83430.034049
350.093221.3150.095007
36-0.240652-3.39480.000414
370.1763682.4880.006834
380.0435380.61420.269901
39-0.193149-2.72470.003505
400.1703162.40260.008599
410.0454520.64120.26107
42-0.22351-3.1530.000933
430.2417873.41080.000392
44-0.014511-0.20470.419009
45-0.219469-3.0960.001122
460.2985164.21111.9e-05
47-0.068809-0.97070.166447
48-0.210997-2.97650.001639

\begin{tabular}{lllllllll}
\hline
Autocorrelation Function \tabularnewline
Time lag k & ACF(k) & T-STAT & P-value \tabularnewline
1 & -0.537487 & -7.5822 & 0 \tabularnewline
2 & -0.057101 & -0.8055 & 0.210742 \tabularnewline
3 & 0.355779 & 5.0189 & 1e-06 \tabularnewline
4 & -0.240638 & -3.3946 & 0.000415 \tabularnewline
5 & -0.030342 & -0.428 & 0.334549 \tabularnewline
6 & 0.280964 & 3.9635 & 5.1e-05 \tabularnewline
7 & -0.271813 & -3.8344 & 8.4e-05 \tabularnewline
8 & 0.096808 & 1.3656 & 0.086797 \tabularnewline
9 & 0.139263 & 1.9646 & 0.025429 \tabularnewline
10 & -0.246431 & -3.4763 & 0.000312 \tabularnewline
11 & 0.192298 & 2.7127 & 0.003629 \tabularnewline
12 & -0.05578 & -0.7869 & 0.216146 \tabularnewline
13 & -0.144765 & -2.0422 & 0.021227 \tabularnewline
14 & 0.097859 & 1.3805 & 0.084496 \tabularnewline
15 & 0.094405 & 1.3317 & 0.092234 \tabularnewline
16 & -0.262843 & -3.7079 & 0.000136 \tabularnewline
17 & 0.197605 & 2.7876 & 0.002913 \tabularnewline
18 & -0.028021 & -0.3953 & 0.346528 \tabularnewline
19 & -0.151124 & -2.1319 & 0.017122 \tabularnewline
20 & 0.160253 & 2.2606 & 0.012432 \tabularnewline
21 & -0.040138 & -0.5662 & 0.28594 \tabularnewline
22 & -0.210865 & -2.9746 & 0.001648 \tabularnewline
23 & 0.337426 & 4.76 & 2e-06 \tabularnewline
24 & -0.233231 & -3.2901 & 0.000592 \tabularnewline
25 & -0.09878 & -1.3935 & 0.082517 \tabularnewline
26 & 0.333018 & 4.6978 & 2e-06 \tabularnewline
27 & -0.287645 & -4.0577 & 3.6e-05 \tabularnewline
28 & 0.019265 & 0.2718 & 0.393044 \tabularnewline
29 & 0.210054 & 2.9632 & 0.001708 \tabularnewline
30 & -0.247664 & -3.4937 & 0.000293 \tabularnewline
31 & 0.024113 & 0.3402 & 0.36705 \tabularnewline
32 & 0.199141 & 2.8092 & 0.002731 \tabularnewline
33 & -0.253479 & -3.5758 & 0.000219 \tabularnewline
34 & 0.130033 & 1.8343 & 0.034049 \tabularnewline
35 & 0.09322 & 1.315 & 0.095007 \tabularnewline
36 & -0.240652 & -3.3948 & 0.000414 \tabularnewline
37 & 0.176368 & 2.488 & 0.006834 \tabularnewline
38 & 0.043538 & 0.6142 & 0.269901 \tabularnewline
39 & -0.193149 & -2.7247 & 0.003505 \tabularnewline
40 & 0.170316 & 2.4026 & 0.008599 \tabularnewline
41 & 0.045452 & 0.6412 & 0.26107 \tabularnewline
42 & -0.22351 & -3.153 & 0.000933 \tabularnewline
43 & 0.241787 & 3.4108 & 0.000392 \tabularnewline
44 & -0.014511 & -0.2047 & 0.419009 \tabularnewline
45 & -0.219469 & -3.096 & 0.001122 \tabularnewline
46 & 0.298516 & 4.2111 & 1.9e-05 \tabularnewline
47 & -0.068809 & -0.9707 & 0.166447 \tabularnewline
48 & -0.210997 & -2.9765 & 0.001639 \tabularnewline
\hline
\end{tabular}
%Source: https://freestatistics.org/blog/index.php?pk=310204&T=1

[TABLE]
[ROW][C]Autocorrelation Function[/C][/ROW]
[ROW][C]Time lag k[/C][C]ACF(k)[/C][C]T-STAT[/C][C]P-value[/C][/ROW]
[ROW][C]1[/C][C]-0.537487[/C][C]-7.5822[/C][C]0[/C][/ROW]
[ROW][C]2[/C][C]-0.057101[/C][C]-0.8055[/C][C]0.210742[/C][/ROW]
[ROW][C]3[/C][C]0.355779[/C][C]5.0189[/C][C]1e-06[/C][/ROW]
[ROW][C]4[/C][C]-0.240638[/C][C]-3.3946[/C][C]0.000415[/C][/ROW]
[ROW][C]5[/C][C]-0.030342[/C][C]-0.428[/C][C]0.334549[/C][/ROW]
[ROW][C]6[/C][C]0.280964[/C][C]3.9635[/C][C]5.1e-05[/C][/ROW]
[ROW][C]7[/C][C]-0.271813[/C][C]-3.8344[/C][C]8.4e-05[/C][/ROW]
[ROW][C]8[/C][C]0.096808[/C][C]1.3656[/C][C]0.086797[/C][/ROW]
[ROW][C]9[/C][C]0.139263[/C][C]1.9646[/C][C]0.025429[/C][/ROW]
[ROW][C]10[/C][C]-0.246431[/C][C]-3.4763[/C][C]0.000312[/C][/ROW]
[ROW][C]11[/C][C]0.192298[/C][C]2.7127[/C][C]0.003629[/C][/ROW]
[ROW][C]12[/C][C]-0.05578[/C][C]-0.7869[/C][C]0.216146[/C][/ROW]
[ROW][C]13[/C][C]-0.144765[/C][C]-2.0422[/C][C]0.021227[/C][/ROW]
[ROW][C]14[/C][C]0.097859[/C][C]1.3805[/C][C]0.084496[/C][/ROW]
[ROW][C]15[/C][C]0.094405[/C][C]1.3317[/C][C]0.092234[/C][/ROW]
[ROW][C]16[/C][C]-0.262843[/C][C]-3.7079[/C][C]0.000136[/C][/ROW]
[ROW][C]17[/C][C]0.197605[/C][C]2.7876[/C][C]0.002913[/C][/ROW]
[ROW][C]18[/C][C]-0.028021[/C][C]-0.3953[/C][C]0.346528[/C][/ROW]
[ROW][C]19[/C][C]-0.151124[/C][C]-2.1319[/C][C]0.017122[/C][/ROW]
[ROW][C]20[/C][C]0.160253[/C][C]2.2606[/C][C]0.012432[/C][/ROW]
[ROW][C]21[/C][C]-0.040138[/C][C]-0.5662[/C][C]0.28594[/C][/ROW]
[ROW][C]22[/C][C]-0.210865[/C][C]-2.9746[/C][C]0.001648[/C][/ROW]
[ROW][C]23[/C][C]0.337426[/C][C]4.76[/C][C]2e-06[/C][/ROW]
[ROW][C]24[/C][C]-0.233231[/C][C]-3.2901[/C][C]0.000592[/C][/ROW]
[ROW][C]25[/C][C]-0.09878[/C][C]-1.3935[/C][C]0.082517[/C][/ROW]
[ROW][C]26[/C][C]0.333018[/C][C]4.6978[/C][C]2e-06[/C][/ROW]
[ROW][C]27[/C][C]-0.287645[/C][C]-4.0577[/C][C]3.6e-05[/C][/ROW]
[ROW][C]28[/C][C]0.019265[/C][C]0.2718[/C][C]0.393044[/C][/ROW]
[ROW][C]29[/C][C]0.210054[/C][C]2.9632[/C][C]0.001708[/C][/ROW]
[ROW][C]30[/C][C]-0.247664[/C][C]-3.4937[/C][C]0.000293[/C][/ROW]
[ROW][C]31[/C][C]0.024113[/C][C]0.3402[/C][C]0.36705[/C][/ROW]
[ROW][C]32[/C][C]0.199141[/C][C]2.8092[/C][C]0.002731[/C][/ROW]
[ROW][C]33[/C][C]-0.253479[/C][C]-3.5758[/C][C]0.000219[/C][/ROW]
[ROW][C]34[/C][C]0.130033[/C][C]1.8343[/C][C]0.034049[/C][/ROW]
[ROW][C]35[/C][C]0.09322[/C][C]1.315[/C][C]0.095007[/C][/ROW]
[ROW][C]36[/C][C]-0.240652[/C][C]-3.3948[/C][C]0.000414[/C][/ROW]
[ROW][C]37[/C][C]0.176368[/C][C]2.488[/C][C]0.006834[/C][/ROW]
[ROW][C]38[/C][C]0.043538[/C][C]0.6142[/C][C]0.269901[/C][/ROW]
[ROW][C]39[/C][C]-0.193149[/C][C]-2.7247[/C][C]0.003505[/C][/ROW]
[ROW][C]40[/C][C]0.170316[/C][C]2.4026[/C][C]0.008599[/C][/ROW]
[ROW][C]41[/C][C]0.045452[/C][C]0.6412[/C][C]0.26107[/C][/ROW]
[ROW][C]42[/C][C]-0.22351[/C][C]-3.153[/C][C]0.000933[/C][/ROW]
[ROW][C]43[/C][C]0.241787[/C][C]3.4108[/C][C]0.000392[/C][/ROW]
[ROW][C]44[/C][C]-0.014511[/C][C]-0.2047[/C][C]0.419009[/C][/ROW]
[ROW][C]45[/C][C]-0.219469[/C][C]-3.096[/C][C]0.001122[/C][/ROW]
[ROW][C]46[/C][C]0.298516[/C][C]4.2111[/C][C]1.9e-05[/C][/ROW]
[ROW][C]47[/C][C]-0.068809[/C][C]-0.9707[/C][C]0.166447[/C][/ROW]
[ROW][C]48[/C][C]-0.210997[/C][C]-2.9765[/C][C]0.001639[/C][/ROW]
[/TABLE]
Source: https://freestatistics.org/blog/index.php?pk=310204&T=1

Globally Unique Identifier (entire table): ba.freestatistics.org/blog/index.php?pk=310204&T=1

As an alternative you can also use a QR Code:  

The GUIDs for individual cells are displayed in the table below:

Autocorrelation Function
Time lag kACF(k)T-STATP-value
1-0.537487-7.58220
2-0.057101-0.80550.210742
30.3557795.01891e-06
4-0.240638-3.39460.000415
5-0.030342-0.4280.334549
60.2809643.96355.1e-05
7-0.271813-3.83448.4e-05
80.0968081.36560.086797
90.1392631.96460.025429
10-0.246431-3.47630.000312
110.1922982.71270.003629
12-0.05578-0.78690.216146
13-0.144765-2.04220.021227
140.0978591.38050.084496
150.0944051.33170.092234
16-0.262843-3.70790.000136
170.1976052.78760.002913
18-0.028021-0.39530.346528
19-0.151124-2.13190.017122
200.1602532.26060.012432
21-0.040138-0.56620.28594
22-0.210865-2.97460.001648
230.3374264.762e-06
24-0.233231-3.29010.000592
25-0.09878-1.39350.082517
260.3330184.69782e-06
27-0.287645-4.05773.6e-05
280.0192650.27180.393044
290.2100542.96320.001708
30-0.247664-3.49370.000293
310.0241130.34020.36705
320.1991412.80920.002731
33-0.253479-3.57580.000219
340.1300331.83430.034049
350.093221.3150.095007
36-0.240652-3.39480.000414
370.1763682.4880.006834
380.0435380.61420.269901
39-0.193149-2.72470.003505
400.1703162.40260.008599
410.0454520.64120.26107
42-0.22351-3.1530.000933
430.2417873.41080.000392
44-0.014511-0.20470.419009
45-0.219469-3.0960.001122
460.2985164.21111.9e-05
47-0.068809-0.97070.166447
48-0.210997-2.97650.001639


Partial Autocorrelation Function
Time lag kPACF(k)T-STATP-value
1-0.537487-7.58220
2-0.486555-6.86370
30.0896121.26410.103831
40.0976771.37790.084891
5-0.035975-0.50750.306189
60.188762.66280.004192
70.0302860.42720.334837
80.0405390.57190.284029
90.098051.38320.084083
10-0.061721-0.87070.192487
110.0515530.72720.233965
12-0.085952-1.21250.113378
13-0.171112-2.41380.008346
14-0.270148-3.81099.2e-05
150.0216390.30530.380247
16-0.093247-1.31540.094942
17-0.049981-0.70510.240796
180.0127080.17930.428956
19-0.013624-0.19220.423897
200.0426660.60190.273968
210.0671990.9480.172149
22-0.177985-2.51080.006421
230.1105291.55920.060269
24-0.045187-0.63740.262285
25-0.208711-2.94420.001811
26-0.050114-0.70690.240215
27-0.042109-0.5940.276586
28-0.031422-0.44330.329029
29-0.027138-0.38280.351125
30-0.047535-0.67060.251639
31-0.110785-1.56280.059843
32-0.051427-0.72550.23451
33-0.020641-0.29120.385609
34-0.058893-0.83080.203546
350.0979061.38110.084393
36-0.058455-0.82460.205289
37-0.078535-1.10790.134628
38-0.025511-0.35990.359662
390.0185760.26210.396777
400.0029390.04150.483486
410.0635940.89710.185374
42-0.05379-0.75880.224434
43-0.041299-0.58260.280411
440.0681190.96090.168875
45-0.072121-1.01740.155103
460.0006950.00980.496092
470.1822952.57160.005426
48-0.044554-0.62850.265194

\begin{tabular}{lllllllll}
\hline
Partial Autocorrelation Function \tabularnewline
Time lag k & PACF(k) & T-STAT & P-value \tabularnewline
1 & -0.537487 & -7.5822 & 0 \tabularnewline
2 & -0.486555 & -6.8637 & 0 \tabularnewline
3 & 0.089612 & 1.2641 & 0.103831 \tabularnewline
4 & 0.097677 & 1.3779 & 0.084891 \tabularnewline
5 & -0.035975 & -0.5075 & 0.306189 \tabularnewline
6 & 0.18876 & 2.6628 & 0.004192 \tabularnewline
7 & 0.030286 & 0.4272 & 0.334837 \tabularnewline
8 & 0.040539 & 0.5719 & 0.284029 \tabularnewline
9 & 0.09805 & 1.3832 & 0.084083 \tabularnewline
10 & -0.061721 & -0.8707 & 0.192487 \tabularnewline
11 & 0.051553 & 0.7272 & 0.233965 \tabularnewline
12 & -0.085952 & -1.2125 & 0.113378 \tabularnewline
13 & -0.171112 & -2.4138 & 0.008346 \tabularnewline
14 & -0.270148 & -3.8109 & 9.2e-05 \tabularnewline
15 & 0.021639 & 0.3053 & 0.380247 \tabularnewline
16 & -0.093247 & -1.3154 & 0.094942 \tabularnewline
17 & -0.049981 & -0.7051 & 0.240796 \tabularnewline
18 & 0.012708 & 0.1793 & 0.428956 \tabularnewline
19 & -0.013624 & -0.1922 & 0.423897 \tabularnewline
20 & 0.042666 & 0.6019 & 0.273968 \tabularnewline
21 & 0.067199 & 0.948 & 0.172149 \tabularnewline
22 & -0.177985 & -2.5108 & 0.006421 \tabularnewline
23 & 0.110529 & 1.5592 & 0.060269 \tabularnewline
24 & -0.045187 & -0.6374 & 0.262285 \tabularnewline
25 & -0.208711 & -2.9442 & 0.001811 \tabularnewline
26 & -0.050114 & -0.7069 & 0.240215 \tabularnewline
27 & -0.042109 & -0.594 & 0.276586 \tabularnewline
28 & -0.031422 & -0.4433 & 0.329029 \tabularnewline
29 & -0.027138 & -0.3828 & 0.351125 \tabularnewline
30 & -0.047535 & -0.6706 & 0.251639 \tabularnewline
31 & -0.110785 & -1.5628 & 0.059843 \tabularnewline
32 & -0.051427 & -0.7255 & 0.23451 \tabularnewline
33 & -0.020641 & -0.2912 & 0.385609 \tabularnewline
34 & -0.058893 & -0.8308 & 0.203546 \tabularnewline
35 & 0.097906 & 1.3811 & 0.084393 \tabularnewline
36 & -0.058455 & -0.8246 & 0.205289 \tabularnewline
37 & -0.078535 & -1.1079 & 0.134628 \tabularnewline
38 & -0.025511 & -0.3599 & 0.359662 \tabularnewline
39 & 0.018576 & 0.2621 & 0.396777 \tabularnewline
40 & 0.002939 & 0.0415 & 0.483486 \tabularnewline
41 & 0.063594 & 0.8971 & 0.185374 \tabularnewline
42 & -0.05379 & -0.7588 & 0.224434 \tabularnewline
43 & -0.041299 & -0.5826 & 0.280411 \tabularnewline
44 & 0.068119 & 0.9609 & 0.168875 \tabularnewline
45 & -0.072121 & -1.0174 & 0.155103 \tabularnewline
46 & 0.000695 & 0.0098 & 0.496092 \tabularnewline
47 & 0.182295 & 2.5716 & 0.005426 \tabularnewline
48 & -0.044554 & -0.6285 & 0.265194 \tabularnewline
\hline
\end{tabular}
%Source: https://freestatistics.org/blog/index.php?pk=310204&T=2

[TABLE]
[ROW][C]Partial Autocorrelation Function[/C][/ROW]
[ROW][C]Time lag k[/C][C]PACF(k)[/C][C]T-STAT[/C][C]P-value[/C][/ROW]
[ROW][C]1[/C][C]-0.537487[/C][C]-7.5822[/C][C]0[/C][/ROW]
[ROW][C]2[/C][C]-0.486555[/C][C]-6.8637[/C][C]0[/C][/ROW]
[ROW][C]3[/C][C]0.089612[/C][C]1.2641[/C][C]0.103831[/C][/ROW]
[ROW][C]4[/C][C]0.097677[/C][C]1.3779[/C][C]0.084891[/C][/ROW]
[ROW][C]5[/C][C]-0.035975[/C][C]-0.5075[/C][C]0.306189[/C][/ROW]
[ROW][C]6[/C][C]0.18876[/C][C]2.6628[/C][C]0.004192[/C][/ROW]
[ROW][C]7[/C][C]0.030286[/C][C]0.4272[/C][C]0.334837[/C][/ROW]
[ROW][C]8[/C][C]0.040539[/C][C]0.5719[/C][C]0.284029[/C][/ROW]
[ROW][C]9[/C][C]0.09805[/C][C]1.3832[/C][C]0.084083[/C][/ROW]
[ROW][C]10[/C][C]-0.061721[/C][C]-0.8707[/C][C]0.192487[/C][/ROW]
[ROW][C]11[/C][C]0.051553[/C][C]0.7272[/C][C]0.233965[/C][/ROW]
[ROW][C]12[/C][C]-0.085952[/C][C]-1.2125[/C][C]0.113378[/C][/ROW]
[ROW][C]13[/C][C]-0.171112[/C][C]-2.4138[/C][C]0.008346[/C][/ROW]
[ROW][C]14[/C][C]-0.270148[/C][C]-3.8109[/C][C]9.2e-05[/C][/ROW]
[ROW][C]15[/C][C]0.021639[/C][C]0.3053[/C][C]0.380247[/C][/ROW]
[ROW][C]16[/C][C]-0.093247[/C][C]-1.3154[/C][C]0.094942[/C][/ROW]
[ROW][C]17[/C][C]-0.049981[/C][C]-0.7051[/C][C]0.240796[/C][/ROW]
[ROW][C]18[/C][C]0.012708[/C][C]0.1793[/C][C]0.428956[/C][/ROW]
[ROW][C]19[/C][C]-0.013624[/C][C]-0.1922[/C][C]0.423897[/C][/ROW]
[ROW][C]20[/C][C]0.042666[/C][C]0.6019[/C][C]0.273968[/C][/ROW]
[ROW][C]21[/C][C]0.067199[/C][C]0.948[/C][C]0.172149[/C][/ROW]
[ROW][C]22[/C][C]-0.177985[/C][C]-2.5108[/C][C]0.006421[/C][/ROW]
[ROW][C]23[/C][C]0.110529[/C][C]1.5592[/C][C]0.060269[/C][/ROW]
[ROW][C]24[/C][C]-0.045187[/C][C]-0.6374[/C][C]0.262285[/C][/ROW]
[ROW][C]25[/C][C]-0.208711[/C][C]-2.9442[/C][C]0.001811[/C][/ROW]
[ROW][C]26[/C][C]-0.050114[/C][C]-0.7069[/C][C]0.240215[/C][/ROW]
[ROW][C]27[/C][C]-0.042109[/C][C]-0.594[/C][C]0.276586[/C][/ROW]
[ROW][C]28[/C][C]-0.031422[/C][C]-0.4433[/C][C]0.329029[/C][/ROW]
[ROW][C]29[/C][C]-0.027138[/C][C]-0.3828[/C][C]0.351125[/C][/ROW]
[ROW][C]30[/C][C]-0.047535[/C][C]-0.6706[/C][C]0.251639[/C][/ROW]
[ROW][C]31[/C][C]-0.110785[/C][C]-1.5628[/C][C]0.059843[/C][/ROW]
[ROW][C]32[/C][C]-0.051427[/C][C]-0.7255[/C][C]0.23451[/C][/ROW]
[ROW][C]33[/C][C]-0.020641[/C][C]-0.2912[/C][C]0.385609[/C][/ROW]
[ROW][C]34[/C][C]-0.058893[/C][C]-0.8308[/C][C]0.203546[/C][/ROW]
[ROW][C]35[/C][C]0.097906[/C][C]1.3811[/C][C]0.084393[/C][/ROW]
[ROW][C]36[/C][C]-0.058455[/C][C]-0.8246[/C][C]0.205289[/C][/ROW]
[ROW][C]37[/C][C]-0.078535[/C][C]-1.1079[/C][C]0.134628[/C][/ROW]
[ROW][C]38[/C][C]-0.025511[/C][C]-0.3599[/C][C]0.359662[/C][/ROW]
[ROW][C]39[/C][C]0.018576[/C][C]0.2621[/C][C]0.396777[/C][/ROW]
[ROW][C]40[/C][C]0.002939[/C][C]0.0415[/C][C]0.483486[/C][/ROW]
[ROW][C]41[/C][C]0.063594[/C][C]0.8971[/C][C]0.185374[/C][/ROW]
[ROW][C]42[/C][C]-0.05379[/C][C]-0.7588[/C][C]0.224434[/C][/ROW]
[ROW][C]43[/C][C]-0.041299[/C][C]-0.5826[/C][C]0.280411[/C][/ROW]
[ROW][C]44[/C][C]0.068119[/C][C]0.9609[/C][C]0.168875[/C][/ROW]
[ROW][C]45[/C][C]-0.072121[/C][C]-1.0174[/C][C]0.155103[/C][/ROW]
[ROW][C]46[/C][C]0.000695[/C][C]0.0098[/C][C]0.496092[/C][/ROW]
[ROW][C]47[/C][C]0.182295[/C][C]2.5716[/C][C]0.005426[/C][/ROW]
[ROW][C]48[/C][C]-0.044554[/C][C]-0.6285[/C][C]0.265194[/C][/ROW]
[/TABLE]
Source: https://freestatistics.org/blog/index.php?pk=310204&T=2

Globally Unique Identifier (entire table): ba.freestatistics.org/blog/index.php?pk=310204&T=2

As an alternative you can also use a QR Code:  

The GUIDs for individual cells are displayed in the table below:

Partial Autocorrelation Function
Time lag kPACF(k)T-STATP-value
1-0.537487-7.58220
2-0.486555-6.86370
30.0896121.26410.103831
40.0976771.37790.084891
5-0.035975-0.50750.306189
60.188762.66280.004192
70.0302860.42720.334837
80.0405390.57190.284029
90.098051.38320.084083
10-0.061721-0.87070.192487
110.0515530.72720.233965
12-0.085952-1.21250.113378
13-0.171112-2.41380.008346
14-0.270148-3.81099.2e-05
150.0216390.30530.380247
16-0.093247-1.31540.094942
17-0.049981-0.70510.240796
180.0127080.17930.428956
19-0.013624-0.19220.423897
200.0426660.60190.273968
210.0671990.9480.172149
22-0.177985-2.51080.006421
230.1105291.55920.060269
24-0.045187-0.63740.262285
25-0.208711-2.94420.001811
26-0.050114-0.70690.240215
27-0.042109-0.5940.276586
28-0.031422-0.44330.329029
29-0.027138-0.38280.351125
30-0.047535-0.67060.251639
31-0.110785-1.56280.059843
32-0.051427-0.72550.23451
33-0.020641-0.29120.385609
34-0.058893-0.83080.203546
350.0979061.38110.084393
36-0.058455-0.82460.205289
37-0.078535-1.10790.134628
38-0.025511-0.35990.359662
390.0185760.26210.396777
400.0029390.04150.483486
410.0635940.89710.185374
42-0.05379-0.75880.224434
43-0.041299-0.58260.280411
440.0681190.96090.168875
45-0.072121-1.01740.155103
460.0006950.00980.496092
470.1822952.57160.005426
48-0.044554-0.62850.265194


Parameters (Session):
Parameters (R input):
par1 = 48 ; par2 = 1 ; par3 = 1 ; par4 = 1 ; par5 = 12 ; par6 = White Noise ; par7 = 0.95 ; par8 = ;
R code (references can be found in the software module):
par8 <- ''
par7 <- '0.95'
par6 <- 'White Noise'
par5 <- '12'
par4 <- '0'
par3 <- '1'
par2 <- '1'
par1 <- '48'
if (par1 == 'Default') {
par1 = 10*log10(length(x))
} else {
par1 <- as.numeric(par1)
}
par2 <- as.numeric(par2)
par3 <- as.numeric(par3)
par4 <- as.numeric(par4)
par5 <- as.numeric(par5)
if (par6 == 'White Noise') par6 <- 'white' else par6 <- 'ma'
par7 <- as.numeric(par7)
if (par8 != '') par8 <- as.numeric(par8)
x <- na.omit(x)
ox <- x
if (par8 == '') {
if (par2 == 0) {
x <- log(x)
} else {
x <- (x ^ par2 - 1) / par2
}
} else {
x <- log(x,base=par8)
}
if (par3 > 0) x <- diff(x,lag=1,difference=par3)
if (par4 > 0) x <- diff(x,lag=par5,difference=par4)
bitmap(file='picts.png')
op <- par(mfrow=c(2,1))
plot(ox,type='l',main='Original Time Series',xlab='time',ylab='value')
if (par8=='') {
mytitle <- paste('Working Time Series (lambda=',par2,', d=',par3,', D=',par4,')',sep='')
mysub <- paste('(lambda=',par2,', d=',par3,', D=',par4,', CI=', par7, ', CI type=',par6,')',sep='')
} else {
mytitle <- paste('Working Time Series (base=',par8,', d=',par3,', D=',par4,')',sep='')
mysub <- paste('(base=',par8,', d=',par3,', D=',par4,', CI=', par7, ', CI type=',par6,')',sep='')
}
plot(x,type='l', main=mytitle,xlab='time',ylab='value')
par(op)
dev.off()
bitmap(file='pic1.png')
racf <- acf(x, par1, main='Autocorrelation', xlab='time lag', ylab='ACF', ci.type=par6, ci=par7, sub=mysub)
dev.off()
bitmap(file='pic2.png')
rpacf <- pacf(x,par1,main='Partial Autocorrelation',xlab='lags',ylab='PACF',sub=mysub)
dev.off()
(myacf <- c(racf$acf))
(mypacf <- c(rpacf$acf))
lengthx <- length(x)
sqrtn <- sqrt(lengthx)
load(file='createtable')
a<-table.start()
a<-table.row.start(a)
a<-table.element(a,'Autocorrelation Function',4,TRUE)
a<-table.row.end(a)
a<-table.row.start(a)
a<-table.element(a,'Time lag k',header=TRUE)
a<-table.element(a,'ACF(k)',header=TRUE)
a<-table.element(a,'T-STAT',header=TRUE)
a<-table.element(a,'P-value',header=TRUE)
a<-table.row.end(a)
for (i in 2:(par1+1)) {
a<-table.row.start(a)
a<-table.element(a,i-1,header=TRUE)
a<-table.element(a,round(myacf[i],6))
mytstat <- myacf[i]*sqrtn
a<-table.element(a,round(mytstat,4))
a<-table.element(a,round(1-pt(abs(mytstat),lengthx),6))
a<-table.row.end(a)
}
a<-table.end(a)
table.save(a,file='mytable.tab')
a<-table.start()
a<-table.row.start(a)
a<-table.element(a,'Partial Autocorrelation Function',4,TRUE)
a<-table.row.end(a)
a<-table.row.start(a)
a<-table.element(a,'Time lag k',header=TRUE)
a<-table.element(a,'PACF(k)',header=TRUE)
a<-table.element(a,'T-STAT',header=TRUE)
a<-table.element(a,'P-value',header=TRUE)
a<-table.row.end(a)
for (i in 1:par1) {
a<-table.row.start(a)
a<-table.element(a,i,header=TRUE)
a<-table.element(a,round(mypacf[i],6))
mytstat <- mypacf[i]*sqrtn
a<-table.element(a,round(mytstat,4))
a<-table.element(a,round(1-pt(abs(mytstat),lengthx),6))
a<-table.row.end(a)
}
a<-table.end(a)
table.save(a,file='mytable1.tab')