Free Statistics

of Irreproducible Research!

Author's title

Author*Unverified author*
R Software Modulerwasp_multipleregression.wasp
Title produced by softwareMultiple Regression
Date of computationMon, 18 Dec 2017 13:14:47 +0100
Cite this page as followsStatistical Computations at FreeStatistics.org, Office for Research Development and Education, URL https://freestatistics.org/blog/index.php?v=date/2017/Dec/18/t15136058322e1a51excqmf9e5.htm/, Retrieved Tue, 14 May 2024 08:22:40 +0000
Statistical Computations at FreeStatistics.org, Office for Research Development and Education, URL https://freestatistics.org/blog/index.php?pk=310183, Retrieved Tue, 14 May 2024 08:22:40 +0000
QR Codes:

Original text written by user:
IsPrivate?No (this computation is public)
User-defined keywords
Estimated Impact58
Family? (F = Feedback message, R = changed R code, M = changed R Module, P = changed Parameters, D = changed Data)
-       [Multiple Regression] [jijj] [2017-12-18 12:14:47] [d41d8cd98f00b204e9800998ecf8427e] [Current]
Feedback Forum

Post a new message
Dataseries X:
14226	1421	6.89	8093098
507911	34621	11.18	416263470
12774	981	6.42	7839521
17227	864	8.68	11116325
10278	582	5.22	5392095
37286	3111	6.14	23336691
28016	2493	5.02	14452047
21159	1370	8.68	12996747
18066	1430	6.05	9060574
10765	482	8.67	7117128
8198	649	8.37	6738063
18184	1635	6.65	11309409
26506	2261	5.48	12669337
20883	1942	4.73	15075902
8668	576	6.03	5888674
25202	1554	8.03	19874354
9582	439	8.34	5545106
18581	1593	5.05	9996834
14922	1005	6.56	8052047
8201	490	6.94	5421429
19308	2333	5.76	13287782
33776	2710	6.32	23065782
18140	1008	6	8551129
9137	857	7.89	7398215
12405	1212	5.22	6173140
19731	1691	4.99	9874993
12713	1223	5.93	6651696
21610	1851	6.45	12006213
18794	1069	7.59	17641778
14948	1309	7.96	8561033
11013	742	6.31	6537863
14828	1179	6.63	10419569
20810	1522	7.12	15191138
17037	1030	7.58	10338354
40915	2917	5.78	21693708
34497	2483	8.27	23440346
82602	5169	9.96	67943703
22198	1486	6.49	10389638
16896	1249	5.9	8992895
16899	1246	9.23	14668749
8122	541	6.2	4686285
20412	1486	6.68	13957086
25059	1455	8.3	17745177
12941	976	6.22	7565518
2630	238	8.94	1516926
21772	1436	7.81	12637450
17340	1234	7.46	11719132
9286	648	7.75	6232397
38101	2788	10.35	28113695
11026	936	6.77	7732251
27438	1976	9.26	20894889
8781	641	5.78	4975425
14396	967	5.92	8135810
20549	2142	6.35	13697398
10175	668	6.4	5978122
17965	1456	6.61	9743345
16385	1150	5.74	7668861
9961	632	8.56	8222068
8682	721	9.94	4386406
35089	2226	9.35	21809275
12016	827	6.99	8923199
12965	915	6.19	5668088
14556	1245	6.95	7495593
10817	858	6.27	5401006
11512	935	6.9	6887417
42008	2561	10.64	30213404
7702	449	7.37	3724035
10704	624	6.32	5729955
24497	1560	7.81	15479767
15598	864	6.38	8382139


Summary of computational transaction
Raw Input view raw input (R code)
Raw Outputview raw output of R engine
Computing time8 seconds
R ServerBig Analytics Cloud Computing Center

\begin{tabular}{lllllllll}
\hline
Summary of computational transaction \tabularnewline
Raw Input view raw input (R code)  \tabularnewline
Raw Outputview raw output of R engine  \tabularnewline
Computing time8 seconds \tabularnewline
R ServerBig Analytics Cloud Computing Center \tabularnewline
\hline
\end{tabular}
%Source: https://freestatistics.org/blog/index.php?pk=310183&T=0

[TABLE]
[ROW]
Summary of computational transaction[/C][/ROW] [ROW]Raw Input[/C] view raw input (R code) [/C][/ROW] [ROW]Raw Output[/C]view raw output of R engine [/C][/ROW] [ROW]Computing time[/C]8 seconds[/C][/ROW] [ROW]R Server[/C]Big Analytics Cloud Computing Center[/C][/ROW] [/TABLE] Source: https://freestatistics.org/blog/index.php?pk=310183&T=0

Globally Unique Identifier (entire table): ba.freestatistics.org/blog/index.php?pk=310183&T=0

As an alternative you can also use a QR Code:  

The GUIDs for individual cells are displayed in the table below:

Summary of computational transaction
Raw Input view raw input (R code)
Raw Outputview raw output of R engine
Computing time8 seconds
R ServerBig Analytics Cloud Computing Center


Multiple Linear Regression - Estimated Regression Equation
fisc_ontv[t] = -7990220 + 872.579Tot_inw[t] -806.391BTW_plichtig[t] + 667343Pers_VTE[t] + e[t]

\begin{tabular}{lllllllll}
\hline
Multiple Linear Regression - Estimated Regression Equation \tabularnewline
fisc_ontv[t] =  -7990220 +  872.579Tot_inw[t] -806.391BTW_plichtig[t] +  667343Pers_VTE[t]  + e[t] \tabularnewline
 \tabularnewline
\hline
\end{tabular}
%Source: https://freestatistics.org/blog/index.php?pk=310183&T=1

[TABLE]
[ROW][C]Multiple Linear Regression - Estimated Regression Equation[/C][/ROW]
[ROW][C]fisc_ontv[t] =  -7990220 +  872.579Tot_inw[t] -806.391BTW_plichtig[t] +  667343Pers_VTE[t]  + e[t][/C][/ROW]
[ROW][C][/C][/ROW]
[/TABLE]
Source: https://freestatistics.org/blog/index.php?pk=310183&T=1

Globally Unique Identifier (entire table): ba.freestatistics.org/blog/index.php?pk=310183&T=1

As an alternative you can also use a QR Code:  

The GUIDs for individual cells are displayed in the table below:

Multiple Linear Regression - Estimated Regression Equation
fisc_ontv[t] = -7990220 + 872.579Tot_inw[t] -806.391BTW_plichtig[t] + 667343Pers_VTE[t] + e[t]


Multiple Linear Regression - Ordinary Least Squares
VariableParameterS.D.T-STATH0: parameter = 02-tail p-value1-tail p-value
(Intercept)-7.99e+06 1.657e+06-4.8230e+00 8.7e-06 4.35e-06
Tot_inw+872.6 81.56+1.0700e+01 4.685e-16 2.343e-16
BTW_plichtig-806.4 1184-6.8130e-01 0.498 0.249
Pers_VTE+6.673e+05 2.28e+05+2.9270e+00 0.004689 0.002345

\begin{tabular}{lllllllll}
\hline
Multiple Linear Regression - Ordinary Least Squares \tabularnewline
Variable & Parameter & S.D. & T-STATH0: parameter = 0 & 2-tail p-value & 1-tail p-value \tabularnewline
(Intercept) & -7.99e+06 &  1.657e+06 & -4.8230e+00 &  8.7e-06 &  4.35e-06 \tabularnewline
Tot_inw & +872.6 &  81.56 & +1.0700e+01 &  4.685e-16 &  2.343e-16 \tabularnewline
BTW_plichtig & -806.4 &  1184 & -6.8130e-01 &  0.498 &  0.249 \tabularnewline
Pers_VTE & +6.673e+05 &  2.28e+05 & +2.9270e+00 &  0.004689 &  0.002345 \tabularnewline
\hline
\end{tabular}
%Source: https://freestatistics.org/blog/index.php?pk=310183&T=2

[TABLE]
[ROW][C]Multiple Linear Regression - Ordinary Least Squares[/C][/ROW]
[ROW][C]Variable[/C][C]Parameter[/C][C]S.D.[/C][C]T-STATH0: parameter = 0[/C][C]2-tail p-value[/C][C]1-tail p-value[/C][/ROW]
[ROW][C](Intercept)[/C][C]-7.99e+06[/C][C] 1.657e+06[/C][C]-4.8230e+00[/C][C] 8.7e-06[/C][C] 4.35e-06[/C][/ROW]
[ROW][C]Tot_inw[/C][C]+872.6[/C][C] 81.56[/C][C]+1.0700e+01[/C][C] 4.685e-16[/C][C] 2.343e-16[/C][/ROW]
[ROW][C]BTW_plichtig[/C][C]-806.4[/C][C] 1184[/C][C]-6.8130e-01[/C][C] 0.498[/C][C] 0.249[/C][/ROW]
[ROW][C]Pers_VTE[/C][C]+6.673e+05[/C][C] 2.28e+05[/C][C]+2.9270e+00[/C][C] 0.004689[/C][C] 0.002345[/C][/ROW]
[/TABLE]
Source: https://freestatistics.org/blog/index.php?pk=310183&T=2

Globally Unique Identifier (entire table): ba.freestatistics.org/blog/index.php?pk=310183&T=2

As an alternative you can also use a QR Code:  

The GUIDs for individual cells are displayed in the table below:

Multiple Linear Regression - Ordinary Least Squares
VariableParameterS.D.T-STATH0: parameter = 02-tail p-value1-tail p-value
(Intercept)-7.99e+06 1.657e+06-4.8230e+00 8.7e-06 4.35e-06
Tot_inw+872.6 81.56+1.0700e+01 4.685e-16 2.343e-16
BTW_plichtig-806.4 1184-6.8130e-01 0.498 0.249
Pers_VTE+6.673e+05 2.28e+05+2.9270e+00 0.004689 0.002345


Multiple Linear Regression - Regression Statistics
Multiple R 0.999
R-squared 0.998
Adjusted R-squared 0.9979
F-TEST (value) 1.114e+04
F-TEST (DF numerator)3
F-TEST (DF denominator)66
p-value 0
Multiple Linear Regression - Residual Statistics
Residual Standard Deviation 2.232e+06
Sum Squared Residuals 3.289e+14

\begin{tabular}{lllllllll}
\hline
Multiple Linear Regression - Regression Statistics \tabularnewline
Multiple R &  0.999 \tabularnewline
R-squared &  0.998 \tabularnewline
Adjusted R-squared &  0.9979 \tabularnewline
F-TEST (value) &  1.114e+04 \tabularnewline
F-TEST (DF numerator) & 3 \tabularnewline
F-TEST (DF denominator) & 66 \tabularnewline
p-value &  0 \tabularnewline
Multiple Linear Regression - Residual Statistics \tabularnewline
Residual Standard Deviation &  2.232e+06 \tabularnewline
Sum Squared Residuals &  3.289e+14 \tabularnewline
\hline
\end{tabular}
%Source: https://freestatistics.org/blog/index.php?pk=310183&T=3

[TABLE]
[ROW][C]Multiple Linear Regression - Regression Statistics[/C][/ROW]
[ROW][C]Multiple R[/C][C] 0.999[/C][/ROW]
[ROW][C]R-squared[/C][C] 0.998[/C][/ROW]
[ROW][C]Adjusted R-squared[/C][C] 0.9979[/C][/ROW]
[ROW][C]F-TEST (value)[/C][C] 1.114e+04[/C][/ROW]
[ROW][C]F-TEST (DF numerator)[/C][C]3[/C][/ROW]
[ROW][C]F-TEST (DF denominator)[/C][C]66[/C][/ROW]
[ROW][C]p-value[/C][C] 0[/C][/ROW]
[ROW][C]Multiple Linear Regression - Residual Statistics[/C][/ROW]
[ROW][C]Residual Standard Deviation[/C][C] 2.232e+06[/C][/ROW]
[ROW][C]Sum Squared Residuals[/C][C] 3.289e+14[/C][/ROW]
[/TABLE]
Source: https://freestatistics.org/blog/index.php?pk=310183&T=3

Globally Unique Identifier (entire table): ba.freestatistics.org/blog/index.php?pk=310183&T=3

As an alternative you can also use a QR Code:  

The GUIDs for individual cells are displayed in the table below:

Multiple Linear Regression - Regression Statistics
Multiple R 0.999
R-squared 0.998
Adjusted R-squared 0.9979
F-TEST (value) 1.114e+04
F-TEST (DF numerator)3
F-TEST (DF denominator)66
p-value 0
Multiple Linear Regression - Residual Statistics
Residual Standard Deviation 2.232e+06
Sum Squared Residuals 3.289e+14


Menu of Residual Diagnostics
DescriptionLink
HistogramCompute
Central TendencyCompute
QQ PlotCompute
Kernel Density PlotCompute
Skewness/Kurtosis TestCompute
Skewness-Kurtosis PlotCompute
Harrell-Davis PlotCompute
Bootstrap Plot -- Central TendencyCompute
Blocked Bootstrap Plot -- Central TendencyCompute
(Partial) Autocorrelation PlotCompute
Spectral AnalysisCompute
Tukey lambda PPCC PlotCompute
Box-Cox Normality PlotCompute
Summary StatisticsCompute

\begin{tabular}{lllllllll}
\hline
Menu of Residual Diagnostics \tabularnewline
Description & Link \tabularnewline
Histogram & Compute \tabularnewline
Central Tendency & Compute \tabularnewline
QQ Plot & Compute \tabularnewline
Kernel Density Plot & Compute \tabularnewline
Skewness/Kurtosis Test & Compute \tabularnewline
Skewness-Kurtosis Plot & Compute \tabularnewline
Harrell-Davis Plot & Compute \tabularnewline
Bootstrap Plot -- Central Tendency & Compute \tabularnewline
Blocked Bootstrap Plot -- Central Tendency & Compute \tabularnewline
(Partial) Autocorrelation Plot & Compute \tabularnewline
Spectral Analysis & Compute \tabularnewline
Tukey lambda PPCC Plot & Compute \tabularnewline
Box-Cox Normality Plot & Compute \tabularnewline
Summary Statistics & Compute \tabularnewline
\hline
\end{tabular}
%Source: https://freestatistics.org/blog/index.php?pk=310183&T=4

[TABLE]
[ROW][C]Menu of Residual Diagnostics[/C][/ROW]
[ROW][C]Description[/C][C]Link[/C][/ROW]
[ROW][C]Histogram[/C][C]Compute[/C][/ROW]
[ROW][C]Central Tendency[/C][C]Compute[/C][/ROW]
[ROW][C]QQ Plot[/C][C]Compute[/C][/ROW]
[ROW][C]Kernel Density Plot[/C][C]Compute[/C][/ROW]
[ROW][C]Skewness/Kurtosis Test[/C][C]Compute[/C][/ROW]
[ROW][C]Skewness-Kurtosis Plot[/C][C]Compute[/C][/ROW]
[ROW][C]Harrell-Davis Plot[/C][C]Compute[/C][/ROW]
[ROW][C]Bootstrap Plot -- Central Tendency[/C][C]Compute[/C][/ROW]
[ROW][C]Blocked Bootstrap Plot -- Central Tendency[/C][C]Compute[/C][/ROW]
[ROW][C](Partial) Autocorrelation Plot[/C][C]Compute[/C][/ROW]
[ROW][C]Spectral Analysis[/C][C]Compute[/C][/ROW]
[ROW][C]Tukey lambda PPCC Plot[/C][C]Compute[/C][/ROW]
[ROW][C]Box-Cox Normality Plot[/C][C]Compute[/C][/ROW]
[ROW][C]Summary Statistics[/C][C]Compute[/C][/ROW]
[/TABLE]
Source: https://freestatistics.org/blog/index.php?pk=310183&T=4

Globally Unique Identifier (entire table): ba.freestatistics.org/blog/index.php?pk=310183&T=4

As an alternative you can also use a QR Code:  

The GUIDs for individual cells are displayed in the table below:

Menu of Residual Diagnostics
DescriptionLink
HistogramCompute
Central TendencyCompute
QQ PlotCompute
Kernel Density PlotCompute
Skewness/Kurtosis TestCompute
Skewness-Kurtosis PlotCompute
Harrell-Davis PlotCompute
Bootstrap Plot -- Central TendencyCompute
Blocked Bootstrap Plot -- Central TendencyCompute
(Partial) Autocorrelation PlotCompute
Spectral AnalysisCompute
Tukey lambda PPCC PlotCompute
Box-Cox Normality PlotCompute
Summary StatisticsCompute


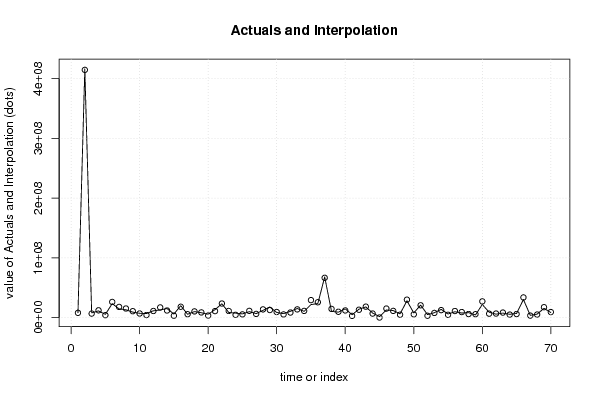
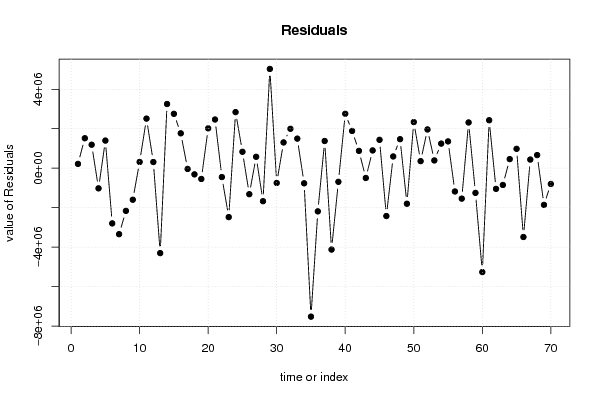
Multiple Linear Regression - Actuals, Interpolation, and Residuals
Time or IndexActualsInterpolationForecastResidualsPrediction Error
1 8.093e+06 7.875e+06 2.179e+05
2 4.163e+08 4.147e+08 1.518e+06
3 7.84e+06 6.649e+06 1.19e+06
4 1.112e+07 1.214e+07-1.021e+06
5 5.392e+06 3.992e+06 1.4e+06
6 2.334e+07 2.613e+07-2.797e+06
7 1.445e+07 1.78e+07-3.344e+06
8 1.3e+07 1.516e+07-2.164e+06
9 9.061e+06 1.066e+07-1.598e+06
10 7.117e+06 6.8e+06 3.169e+05
11 6.738e+06 4.225e+06 2.513e+06
12 1.131e+07 1.1e+07 3.133e+05
13 1.267e+07 1.697e+07-4.303e+06
14 1.508e+07 1.182e+07 3.254e+06
15 5.889e+06 3.133e+06 2.756e+06
16 1.987e+07 1.811e+07 1.768e+06
17 5.545e+06 5.582e+06-3.736e+04
18 9.997e+06 1.031e+07-3.118e+05
19 8.052e+06 8.598e+06-5.457e+05
20 5.421e+06 3.402e+06 2.019e+06
21 1.329e+07 1.082e+07 2.468e+06
22 2.307e+07 2.351e+07-4.485e+05
23 8.551e+06 1.103e+07-2.478e+06
24 7.398e+06 4.557e+06 2.841e+06
25 6.173e+06 5.34e+06 8.328e+05
26 9.875e+06 1.119e+07-1.318e+06
27 6.652e+06 6.074e+06 5.777e+05
28 1.201e+07 1.368e+07-1.672e+06
29 1.764e+07 1.261e+07 5.03e+06
30 8.561e+06 9.31e+06-7.485e+05
31 6.538e+06 5.232e+06 1.306e+06
32 1.042e+07 8.422e+06 1.997e+06
33 1.519e+07 1.369e+07 1.499e+06
34 1.034e+07 1.11e+07-7.654e+05
35 2.169e+07 2.922e+07-7.523e+06
36 2.344e+07 2.563e+07-2.187e+06
37 6.794e+07 6.656e+07 1.379e+06
38 1.039e+07 1.451e+07-4.122e+06
39 8.993e+06 9.683e+06-6.901e+05
40 1.467e+07 1.191e+07 2.758e+06
41 4.686e+06 2.798e+06 1.888e+06
42 1.396e+07 1.308e+07 8.767e+05
43 1.775e+07 1.824e+07-4.962e+05
44 7.566e+06 6.666e+06 8.999e+05
45 1.517e+06 7.878e+04 1.438e+06
46 1.264e+07 1.506e+07-2.424e+06
47 1.172e+07 1.112e+07 5.955e+05
48 6.232e+06 4.762e+06 1.47e+06
49 2.811e+07 2.991e+07-1.801e+06
50 7.732e+06 5.394e+06 2.338e+06
51 2.089e+07 2.054e+07 3.571e+05
52 4.975e+06 3.012e+06 1.963e+06
53 8.136e+06 7.742e+06 3.935e+05
54 1.37e+07 1.245e+07 1.247e+06
55 5.978e+06 4.621e+06 1.358e+06
56 9.743e+06 1.092e+07-1.179e+06
57 7.669e+06 9.21e+06-1.541e+06
58 8.222e+06 5.904e+06 2.318e+06
59 4.386e+06 5.637e+06-1.251e+06
60 2.181e+07 2.707e+07-5.263e+06
61 8.923e+06 6.493e+06 2.431e+06
62 5.668e+06 6.716e+06-1.048e+06
63 7.496e+06 8.345e+06-8.495e+05
64 5.401e+06 4.941e+06 4.602e+05
65 6.887e+06 5.906e+06 9.818e+05
66 3.021e+07 3.37e+07-3.487e+06
67 3.724e+06 3.287e+06 4.374e+05
68 5.73e+06 5.064e+06 6.657e+05
69 1.548e+07 1.734e+07-1.86e+06
70 8.382e+06 9.181e+06-7.991e+05

\begin{tabular}{lllllllll}
\hline
Multiple Linear Regression - Actuals, Interpolation, and Residuals \tabularnewline
Time or Index & Actuals & InterpolationForecast & ResidualsPrediction Error \tabularnewline
1 &  8.093e+06 &  7.875e+06 &  2.179e+05 \tabularnewline
2 &  4.163e+08 &  4.147e+08 &  1.518e+06 \tabularnewline
3 &  7.84e+06 &  6.649e+06 &  1.19e+06 \tabularnewline
4 &  1.112e+07 &  1.214e+07 & -1.021e+06 \tabularnewline
5 &  5.392e+06 &  3.992e+06 &  1.4e+06 \tabularnewline
6 &  2.334e+07 &  2.613e+07 & -2.797e+06 \tabularnewline
7 &  1.445e+07 &  1.78e+07 & -3.344e+06 \tabularnewline
8 &  1.3e+07 &  1.516e+07 & -2.164e+06 \tabularnewline
9 &  9.061e+06 &  1.066e+07 & -1.598e+06 \tabularnewline
10 &  7.117e+06 &  6.8e+06 &  3.169e+05 \tabularnewline
11 &  6.738e+06 &  4.225e+06 &  2.513e+06 \tabularnewline
12 &  1.131e+07 &  1.1e+07 &  3.133e+05 \tabularnewline
13 &  1.267e+07 &  1.697e+07 & -4.303e+06 \tabularnewline
14 &  1.508e+07 &  1.182e+07 &  3.254e+06 \tabularnewline
15 &  5.889e+06 &  3.133e+06 &  2.756e+06 \tabularnewline
16 &  1.987e+07 &  1.811e+07 &  1.768e+06 \tabularnewline
17 &  5.545e+06 &  5.582e+06 & -3.736e+04 \tabularnewline
18 &  9.997e+06 &  1.031e+07 & -3.118e+05 \tabularnewline
19 &  8.052e+06 &  8.598e+06 & -5.457e+05 \tabularnewline
20 &  5.421e+06 &  3.402e+06 &  2.019e+06 \tabularnewline
21 &  1.329e+07 &  1.082e+07 &  2.468e+06 \tabularnewline
22 &  2.307e+07 &  2.351e+07 & -4.485e+05 \tabularnewline
23 &  8.551e+06 &  1.103e+07 & -2.478e+06 \tabularnewline
24 &  7.398e+06 &  4.557e+06 &  2.841e+06 \tabularnewline
25 &  6.173e+06 &  5.34e+06 &  8.328e+05 \tabularnewline
26 &  9.875e+06 &  1.119e+07 & -1.318e+06 \tabularnewline
27 &  6.652e+06 &  6.074e+06 &  5.777e+05 \tabularnewline
28 &  1.201e+07 &  1.368e+07 & -1.672e+06 \tabularnewline
29 &  1.764e+07 &  1.261e+07 &  5.03e+06 \tabularnewline
30 &  8.561e+06 &  9.31e+06 & -7.485e+05 \tabularnewline
31 &  6.538e+06 &  5.232e+06 &  1.306e+06 \tabularnewline
32 &  1.042e+07 &  8.422e+06 &  1.997e+06 \tabularnewline
33 &  1.519e+07 &  1.369e+07 &  1.499e+06 \tabularnewline
34 &  1.034e+07 &  1.11e+07 & -7.654e+05 \tabularnewline
35 &  2.169e+07 &  2.922e+07 & -7.523e+06 \tabularnewline
36 &  2.344e+07 &  2.563e+07 & -2.187e+06 \tabularnewline
37 &  6.794e+07 &  6.656e+07 &  1.379e+06 \tabularnewline
38 &  1.039e+07 &  1.451e+07 & -4.122e+06 \tabularnewline
39 &  8.993e+06 &  9.683e+06 & -6.901e+05 \tabularnewline
40 &  1.467e+07 &  1.191e+07 &  2.758e+06 \tabularnewline
41 &  4.686e+06 &  2.798e+06 &  1.888e+06 \tabularnewline
42 &  1.396e+07 &  1.308e+07 &  8.767e+05 \tabularnewline
43 &  1.775e+07 &  1.824e+07 & -4.962e+05 \tabularnewline
44 &  7.566e+06 &  6.666e+06 &  8.999e+05 \tabularnewline
45 &  1.517e+06 &  7.878e+04 &  1.438e+06 \tabularnewline
46 &  1.264e+07 &  1.506e+07 & -2.424e+06 \tabularnewline
47 &  1.172e+07 &  1.112e+07 &  5.955e+05 \tabularnewline
48 &  6.232e+06 &  4.762e+06 &  1.47e+06 \tabularnewline
49 &  2.811e+07 &  2.991e+07 & -1.801e+06 \tabularnewline
50 &  7.732e+06 &  5.394e+06 &  2.338e+06 \tabularnewline
51 &  2.089e+07 &  2.054e+07 &  3.571e+05 \tabularnewline
52 &  4.975e+06 &  3.012e+06 &  1.963e+06 \tabularnewline
53 &  8.136e+06 &  7.742e+06 &  3.935e+05 \tabularnewline
54 &  1.37e+07 &  1.245e+07 &  1.247e+06 \tabularnewline
55 &  5.978e+06 &  4.621e+06 &  1.358e+06 \tabularnewline
56 &  9.743e+06 &  1.092e+07 & -1.179e+06 \tabularnewline
57 &  7.669e+06 &  9.21e+06 & -1.541e+06 \tabularnewline
58 &  8.222e+06 &  5.904e+06 &  2.318e+06 \tabularnewline
59 &  4.386e+06 &  5.637e+06 & -1.251e+06 \tabularnewline
60 &  2.181e+07 &  2.707e+07 & -5.263e+06 \tabularnewline
61 &  8.923e+06 &  6.493e+06 &  2.431e+06 \tabularnewline
62 &  5.668e+06 &  6.716e+06 & -1.048e+06 \tabularnewline
63 &  7.496e+06 &  8.345e+06 & -8.495e+05 \tabularnewline
64 &  5.401e+06 &  4.941e+06 &  4.602e+05 \tabularnewline
65 &  6.887e+06 &  5.906e+06 &  9.818e+05 \tabularnewline
66 &  3.021e+07 &  3.37e+07 & -3.487e+06 \tabularnewline
67 &  3.724e+06 &  3.287e+06 &  4.374e+05 \tabularnewline
68 &  5.73e+06 &  5.064e+06 &  6.657e+05 \tabularnewline
69 &  1.548e+07 &  1.734e+07 & -1.86e+06 \tabularnewline
70 &  8.382e+06 &  9.181e+06 & -7.991e+05 \tabularnewline
\hline
\end{tabular}
%Source: https://freestatistics.org/blog/index.php?pk=310183&T=5

[TABLE]
[ROW][C]Multiple Linear Regression - Actuals, Interpolation, and Residuals[/C][/ROW]
[ROW][C]Time or Index[/C][C]Actuals[/C][C]InterpolationForecast[/C][C]ResidualsPrediction Error[/C][/ROW]
[ROW][C]1[/C][C] 8.093e+06[/C][C] 7.875e+06[/C][C] 2.179e+05[/C][/ROW]
[ROW][C]2[/C][C] 4.163e+08[/C][C] 4.147e+08[/C][C] 1.518e+06[/C][/ROW]
[ROW][C]3[/C][C] 7.84e+06[/C][C] 6.649e+06[/C][C] 1.19e+06[/C][/ROW]
[ROW][C]4[/C][C] 1.112e+07[/C][C] 1.214e+07[/C][C]-1.021e+06[/C][/ROW]
[ROW][C]5[/C][C] 5.392e+06[/C][C] 3.992e+06[/C][C] 1.4e+06[/C][/ROW]
[ROW][C]6[/C][C] 2.334e+07[/C][C] 2.613e+07[/C][C]-2.797e+06[/C][/ROW]
[ROW][C]7[/C][C] 1.445e+07[/C][C] 1.78e+07[/C][C]-3.344e+06[/C][/ROW]
[ROW][C]8[/C][C] 1.3e+07[/C][C] 1.516e+07[/C][C]-2.164e+06[/C][/ROW]
[ROW][C]9[/C][C] 9.061e+06[/C][C] 1.066e+07[/C][C]-1.598e+06[/C][/ROW]
[ROW][C]10[/C][C] 7.117e+06[/C][C] 6.8e+06[/C][C] 3.169e+05[/C][/ROW]
[ROW][C]11[/C][C] 6.738e+06[/C][C] 4.225e+06[/C][C] 2.513e+06[/C][/ROW]
[ROW][C]12[/C][C] 1.131e+07[/C][C] 1.1e+07[/C][C] 3.133e+05[/C][/ROW]
[ROW][C]13[/C][C] 1.267e+07[/C][C] 1.697e+07[/C][C]-4.303e+06[/C][/ROW]
[ROW][C]14[/C][C] 1.508e+07[/C][C] 1.182e+07[/C][C] 3.254e+06[/C][/ROW]
[ROW][C]15[/C][C] 5.889e+06[/C][C] 3.133e+06[/C][C] 2.756e+06[/C][/ROW]
[ROW][C]16[/C][C] 1.987e+07[/C][C] 1.811e+07[/C][C] 1.768e+06[/C][/ROW]
[ROW][C]17[/C][C] 5.545e+06[/C][C] 5.582e+06[/C][C]-3.736e+04[/C][/ROW]
[ROW][C]18[/C][C] 9.997e+06[/C][C] 1.031e+07[/C][C]-3.118e+05[/C][/ROW]
[ROW][C]19[/C][C] 8.052e+06[/C][C] 8.598e+06[/C][C]-5.457e+05[/C][/ROW]
[ROW][C]20[/C][C] 5.421e+06[/C][C] 3.402e+06[/C][C] 2.019e+06[/C][/ROW]
[ROW][C]21[/C][C] 1.329e+07[/C][C] 1.082e+07[/C][C] 2.468e+06[/C][/ROW]
[ROW][C]22[/C][C] 2.307e+07[/C][C] 2.351e+07[/C][C]-4.485e+05[/C][/ROW]
[ROW][C]23[/C][C] 8.551e+06[/C][C] 1.103e+07[/C][C]-2.478e+06[/C][/ROW]
[ROW][C]24[/C][C] 7.398e+06[/C][C] 4.557e+06[/C][C] 2.841e+06[/C][/ROW]
[ROW][C]25[/C][C] 6.173e+06[/C][C] 5.34e+06[/C][C] 8.328e+05[/C][/ROW]
[ROW][C]26[/C][C] 9.875e+06[/C][C] 1.119e+07[/C][C]-1.318e+06[/C][/ROW]
[ROW][C]27[/C][C] 6.652e+06[/C][C] 6.074e+06[/C][C] 5.777e+05[/C][/ROW]
[ROW][C]28[/C][C] 1.201e+07[/C][C] 1.368e+07[/C][C]-1.672e+06[/C][/ROW]
[ROW][C]29[/C][C] 1.764e+07[/C][C] 1.261e+07[/C][C] 5.03e+06[/C][/ROW]
[ROW][C]30[/C][C] 8.561e+06[/C][C] 9.31e+06[/C][C]-7.485e+05[/C][/ROW]
[ROW][C]31[/C][C] 6.538e+06[/C][C] 5.232e+06[/C][C] 1.306e+06[/C][/ROW]
[ROW][C]32[/C][C] 1.042e+07[/C][C] 8.422e+06[/C][C] 1.997e+06[/C][/ROW]
[ROW][C]33[/C][C] 1.519e+07[/C][C] 1.369e+07[/C][C] 1.499e+06[/C][/ROW]
[ROW][C]34[/C][C] 1.034e+07[/C][C] 1.11e+07[/C][C]-7.654e+05[/C][/ROW]
[ROW][C]35[/C][C] 2.169e+07[/C][C] 2.922e+07[/C][C]-7.523e+06[/C][/ROW]
[ROW][C]36[/C][C] 2.344e+07[/C][C] 2.563e+07[/C][C]-2.187e+06[/C][/ROW]
[ROW][C]37[/C][C] 6.794e+07[/C][C] 6.656e+07[/C][C] 1.379e+06[/C][/ROW]
[ROW][C]38[/C][C] 1.039e+07[/C][C] 1.451e+07[/C][C]-4.122e+06[/C][/ROW]
[ROW][C]39[/C][C] 8.993e+06[/C][C] 9.683e+06[/C][C]-6.901e+05[/C][/ROW]
[ROW][C]40[/C][C] 1.467e+07[/C][C] 1.191e+07[/C][C] 2.758e+06[/C][/ROW]
[ROW][C]41[/C][C] 4.686e+06[/C][C] 2.798e+06[/C][C] 1.888e+06[/C][/ROW]
[ROW][C]42[/C][C] 1.396e+07[/C][C] 1.308e+07[/C][C] 8.767e+05[/C][/ROW]
[ROW][C]43[/C][C] 1.775e+07[/C][C] 1.824e+07[/C][C]-4.962e+05[/C][/ROW]
[ROW][C]44[/C][C] 7.566e+06[/C][C] 6.666e+06[/C][C] 8.999e+05[/C][/ROW]
[ROW][C]45[/C][C] 1.517e+06[/C][C] 7.878e+04[/C][C] 1.438e+06[/C][/ROW]
[ROW][C]46[/C][C] 1.264e+07[/C][C] 1.506e+07[/C][C]-2.424e+06[/C][/ROW]
[ROW][C]47[/C][C] 1.172e+07[/C][C] 1.112e+07[/C][C] 5.955e+05[/C][/ROW]
[ROW][C]48[/C][C] 6.232e+06[/C][C] 4.762e+06[/C][C] 1.47e+06[/C][/ROW]
[ROW][C]49[/C][C] 2.811e+07[/C][C] 2.991e+07[/C][C]-1.801e+06[/C][/ROW]
[ROW][C]50[/C][C] 7.732e+06[/C][C] 5.394e+06[/C][C] 2.338e+06[/C][/ROW]
[ROW][C]51[/C][C] 2.089e+07[/C][C] 2.054e+07[/C][C] 3.571e+05[/C][/ROW]
[ROW][C]52[/C][C] 4.975e+06[/C][C] 3.012e+06[/C][C] 1.963e+06[/C][/ROW]
[ROW][C]53[/C][C] 8.136e+06[/C][C] 7.742e+06[/C][C] 3.935e+05[/C][/ROW]
[ROW][C]54[/C][C] 1.37e+07[/C][C] 1.245e+07[/C][C] 1.247e+06[/C][/ROW]
[ROW][C]55[/C][C] 5.978e+06[/C][C] 4.621e+06[/C][C] 1.358e+06[/C][/ROW]
[ROW][C]56[/C][C] 9.743e+06[/C][C] 1.092e+07[/C][C]-1.179e+06[/C][/ROW]
[ROW][C]57[/C][C] 7.669e+06[/C][C] 9.21e+06[/C][C]-1.541e+06[/C][/ROW]
[ROW][C]58[/C][C] 8.222e+06[/C][C] 5.904e+06[/C][C] 2.318e+06[/C][/ROW]
[ROW][C]59[/C][C] 4.386e+06[/C][C] 5.637e+06[/C][C]-1.251e+06[/C][/ROW]
[ROW][C]60[/C][C] 2.181e+07[/C][C] 2.707e+07[/C][C]-5.263e+06[/C][/ROW]
[ROW][C]61[/C][C] 8.923e+06[/C][C] 6.493e+06[/C][C] 2.431e+06[/C][/ROW]
[ROW][C]62[/C][C] 5.668e+06[/C][C] 6.716e+06[/C][C]-1.048e+06[/C][/ROW]
[ROW][C]63[/C][C] 7.496e+06[/C][C] 8.345e+06[/C][C]-8.495e+05[/C][/ROW]
[ROW][C]64[/C][C] 5.401e+06[/C][C] 4.941e+06[/C][C] 4.602e+05[/C][/ROW]
[ROW][C]65[/C][C] 6.887e+06[/C][C] 5.906e+06[/C][C] 9.818e+05[/C][/ROW]
[ROW][C]66[/C][C] 3.021e+07[/C][C] 3.37e+07[/C][C]-3.487e+06[/C][/ROW]
[ROW][C]67[/C][C] 3.724e+06[/C][C] 3.287e+06[/C][C] 4.374e+05[/C][/ROW]
[ROW][C]68[/C][C] 5.73e+06[/C][C] 5.064e+06[/C][C] 6.657e+05[/C][/ROW]
[ROW][C]69[/C][C] 1.548e+07[/C][C] 1.734e+07[/C][C]-1.86e+06[/C][/ROW]
[ROW][C]70[/C][C] 8.382e+06[/C][C] 9.181e+06[/C][C]-7.991e+05[/C][/ROW]
[/TABLE]
Source: https://freestatistics.org/blog/index.php?pk=310183&T=5

Globally Unique Identifier (entire table): ba.freestatistics.org/blog/index.php?pk=310183&T=5

As an alternative you can also use a QR Code:  

The GUIDs for individual cells are displayed in the table below:

Multiple Linear Regression - Actuals, Interpolation, and Residuals
Time or IndexActualsInterpolationForecastResidualsPrediction Error
1 8.093e+06 7.875e+06 2.179e+05
2 4.163e+08 4.147e+08 1.518e+06
3 7.84e+06 6.649e+06 1.19e+06
4 1.112e+07 1.214e+07-1.021e+06
5 5.392e+06 3.992e+06 1.4e+06
6 2.334e+07 2.613e+07-2.797e+06
7 1.445e+07 1.78e+07-3.344e+06
8 1.3e+07 1.516e+07-2.164e+06
9 9.061e+06 1.066e+07-1.598e+06
10 7.117e+06 6.8e+06 3.169e+05
11 6.738e+06 4.225e+06 2.513e+06
12 1.131e+07 1.1e+07 3.133e+05
13 1.267e+07 1.697e+07-4.303e+06
14 1.508e+07 1.182e+07 3.254e+06
15 5.889e+06 3.133e+06 2.756e+06
16 1.987e+07 1.811e+07 1.768e+06
17 5.545e+06 5.582e+06-3.736e+04
18 9.997e+06 1.031e+07-3.118e+05
19 8.052e+06 8.598e+06-5.457e+05
20 5.421e+06 3.402e+06 2.019e+06
21 1.329e+07 1.082e+07 2.468e+06
22 2.307e+07 2.351e+07-4.485e+05
23 8.551e+06 1.103e+07-2.478e+06
24 7.398e+06 4.557e+06 2.841e+06
25 6.173e+06 5.34e+06 8.328e+05
26 9.875e+06 1.119e+07-1.318e+06
27 6.652e+06 6.074e+06 5.777e+05
28 1.201e+07 1.368e+07-1.672e+06
29 1.764e+07 1.261e+07 5.03e+06
30 8.561e+06 9.31e+06-7.485e+05
31 6.538e+06 5.232e+06 1.306e+06
32 1.042e+07 8.422e+06 1.997e+06
33 1.519e+07 1.369e+07 1.499e+06
34 1.034e+07 1.11e+07-7.654e+05
35 2.169e+07 2.922e+07-7.523e+06
36 2.344e+07 2.563e+07-2.187e+06
37 6.794e+07 6.656e+07 1.379e+06
38 1.039e+07 1.451e+07-4.122e+06
39 8.993e+06 9.683e+06-6.901e+05
40 1.467e+07 1.191e+07 2.758e+06
41 4.686e+06 2.798e+06 1.888e+06
42 1.396e+07 1.308e+07 8.767e+05
43 1.775e+07 1.824e+07-4.962e+05
44 7.566e+06 6.666e+06 8.999e+05
45 1.517e+06 7.878e+04 1.438e+06
46 1.264e+07 1.506e+07-2.424e+06
47 1.172e+07 1.112e+07 5.955e+05
48 6.232e+06 4.762e+06 1.47e+06
49 2.811e+07 2.991e+07-1.801e+06
50 7.732e+06 5.394e+06 2.338e+06
51 2.089e+07 2.054e+07 3.571e+05
52 4.975e+06 3.012e+06 1.963e+06
53 8.136e+06 7.742e+06 3.935e+05
54 1.37e+07 1.245e+07 1.247e+06
55 5.978e+06 4.621e+06 1.358e+06
56 9.743e+06 1.092e+07-1.179e+06
57 7.669e+06 9.21e+06-1.541e+06
58 8.222e+06 5.904e+06 2.318e+06
59 4.386e+06 5.637e+06-1.251e+06
60 2.181e+07 2.707e+07-5.263e+06
61 8.923e+06 6.493e+06 2.431e+06
62 5.668e+06 6.716e+06-1.048e+06
63 7.496e+06 8.345e+06-8.495e+05
64 5.401e+06 4.941e+06 4.602e+05
65 6.887e+06 5.906e+06 9.818e+05
66 3.021e+07 3.37e+07-3.487e+06
67 3.724e+06 3.287e+06 4.374e+05
68 5.73e+06 5.064e+06 6.657e+05
69 1.548e+07 1.734e+07-1.86e+06
70 8.382e+06 9.181e+06-7.991e+05


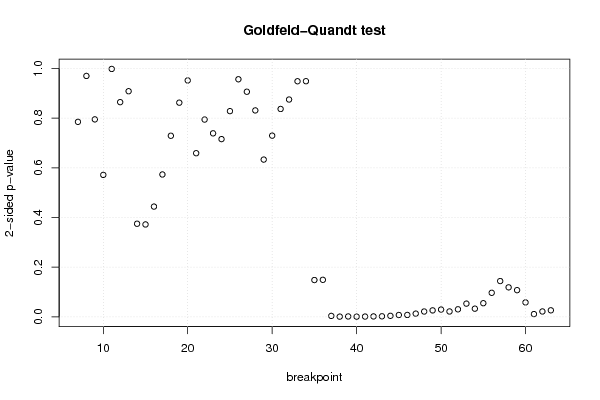
Goldfeld-Quandt test for Heteroskedasticity
p-valuesAlternative Hypothesis
breakpoint indexgreater2-sidedless
7 0.6075 0.7849 0.3925
8 0.5151 0.9697 0.4849
9 0.3975 0.7949 0.6026
10 0.2857 0.5714 0.7143
11 0.4989 0.9979 0.5011
12 0.4321 0.8642 0.5679
13 0.5459 0.9082 0.4541
14 0.8126 0.3748 0.1874
15 0.814 0.3719 0.186
16 0.7781 0.4439 0.2219
17 0.7135 0.5731 0.2865
18 0.6355 0.7289 0.3645
19 0.569 0.8621 0.431
20 0.5242 0.9516 0.4758
21 0.6706 0.6587 0.3294
22 0.6029 0.7942 0.3971
23 0.6306 0.7388 0.3694
24 0.6423 0.7154 0.3577
25 0.5859 0.8281 0.4141
26 0.5218 0.9564 0.4782
27 0.4531 0.9061 0.5469
28 0.4155 0.8309 0.5845
29 0.6835 0.6331 0.3165
30 0.6353 0.7294 0.3647
31 0.5816 0.8368 0.4184
32 0.5626 0.8748 0.4374
33 0.5258 0.9483 0.4742
34 0.4743 0.9486 0.5257
35 0.9259 0.1482 0.07409
36 0.9254 0.1492 0.07458
37 0.9981 0.003834 0.001917
38 0.9995 0.000936 0.000468
39 0.9992 0.001678 0.0008388
40 0.9996 0.0008657 0.0004328
41 0.9994 0.001253 0.0006266
42 0.9991 0.001744 0.0008721
43 0.9988 0.002311 0.001156
44 0.9979 0.004166 0.002083
45 0.9962 0.007505 0.003753
46 0.9961 0.007756 0.003878
47 0.9935 0.01302 0.00651
48 0.9892 0.02158 0.01079
49 0.9869 0.02616 0.01308
50 0.9853 0.02941 0.01471
51 0.9891 0.02171 0.01085
52 0.9848 0.03049 0.01525
53 0.9734 0.05323 0.02661
54 0.9835 0.03296 0.01648
55 0.9725 0.05499 0.02749
56 0.9516 0.09689 0.04844
57 0.9279 0.1442 0.07211
58 0.9406 0.1188 0.0594
59 0.9463 0.1075 0.05374
60 0.9709 0.0581 0.02905
61 0.9944 0.01124 0.00562
62 0.9891 0.02176 0.01088
63 0.9868 0.02644 0.01322

\begin{tabular}{lllllllll}
\hline
Goldfeld-Quandt test for Heteroskedasticity \tabularnewline
p-values & Alternative Hypothesis \tabularnewline
breakpoint index & greater & 2-sided & less \tabularnewline
7 &  0.6075 &  0.7849 &  0.3925 \tabularnewline
8 &  0.5151 &  0.9697 &  0.4849 \tabularnewline
9 &  0.3975 &  0.7949 &  0.6026 \tabularnewline
10 &  0.2857 &  0.5714 &  0.7143 \tabularnewline
11 &  0.4989 &  0.9979 &  0.5011 \tabularnewline
12 &  0.4321 &  0.8642 &  0.5679 \tabularnewline
13 &  0.5459 &  0.9082 &  0.4541 \tabularnewline
14 &  0.8126 &  0.3748 &  0.1874 \tabularnewline
15 &  0.814 &  0.3719 &  0.186 \tabularnewline
16 &  0.7781 &  0.4439 &  0.2219 \tabularnewline
17 &  0.7135 &  0.5731 &  0.2865 \tabularnewline
18 &  0.6355 &  0.7289 &  0.3645 \tabularnewline
19 &  0.569 &  0.8621 &  0.431 \tabularnewline
20 &  0.5242 &  0.9516 &  0.4758 \tabularnewline
21 &  0.6706 &  0.6587 &  0.3294 \tabularnewline
22 &  0.6029 &  0.7942 &  0.3971 \tabularnewline
23 &  0.6306 &  0.7388 &  0.3694 \tabularnewline
24 &  0.6423 &  0.7154 &  0.3577 \tabularnewline
25 &  0.5859 &  0.8281 &  0.4141 \tabularnewline
26 &  0.5218 &  0.9564 &  0.4782 \tabularnewline
27 &  0.4531 &  0.9061 &  0.5469 \tabularnewline
28 &  0.4155 &  0.8309 &  0.5845 \tabularnewline
29 &  0.6835 &  0.6331 &  0.3165 \tabularnewline
30 &  0.6353 &  0.7294 &  0.3647 \tabularnewline
31 &  0.5816 &  0.8368 &  0.4184 \tabularnewline
32 &  0.5626 &  0.8748 &  0.4374 \tabularnewline
33 &  0.5258 &  0.9483 &  0.4742 \tabularnewline
34 &  0.4743 &  0.9486 &  0.5257 \tabularnewline
35 &  0.9259 &  0.1482 &  0.07409 \tabularnewline
36 &  0.9254 &  0.1492 &  0.07458 \tabularnewline
37 &  0.9981 &  0.003834 &  0.001917 \tabularnewline
38 &  0.9995 &  0.000936 &  0.000468 \tabularnewline
39 &  0.9992 &  0.001678 &  0.0008388 \tabularnewline
40 &  0.9996 &  0.0008657 &  0.0004328 \tabularnewline
41 &  0.9994 &  0.001253 &  0.0006266 \tabularnewline
42 &  0.9991 &  0.001744 &  0.0008721 \tabularnewline
43 &  0.9988 &  0.002311 &  0.001156 \tabularnewline
44 &  0.9979 &  0.004166 &  0.002083 \tabularnewline
45 &  0.9962 &  0.007505 &  0.003753 \tabularnewline
46 &  0.9961 &  0.007756 &  0.003878 \tabularnewline
47 &  0.9935 &  0.01302 &  0.00651 \tabularnewline
48 &  0.9892 &  0.02158 &  0.01079 \tabularnewline
49 &  0.9869 &  0.02616 &  0.01308 \tabularnewline
50 &  0.9853 &  0.02941 &  0.01471 \tabularnewline
51 &  0.9891 &  0.02171 &  0.01085 \tabularnewline
52 &  0.9848 &  0.03049 &  0.01525 \tabularnewline
53 &  0.9734 &  0.05323 &  0.02661 \tabularnewline
54 &  0.9835 &  0.03296 &  0.01648 \tabularnewline
55 &  0.9725 &  0.05499 &  0.02749 \tabularnewline
56 &  0.9516 &  0.09689 &  0.04844 \tabularnewline
57 &  0.9279 &  0.1442 &  0.07211 \tabularnewline
58 &  0.9406 &  0.1188 &  0.0594 \tabularnewline
59 &  0.9463 &  0.1075 &  0.05374 \tabularnewline
60 &  0.9709 &  0.0581 &  0.02905 \tabularnewline
61 &  0.9944 &  0.01124 &  0.00562 \tabularnewline
62 &  0.9891 &  0.02176 &  0.01088 \tabularnewline
63 &  0.9868 &  0.02644 &  0.01322 \tabularnewline
\hline
\end{tabular}
%Source: https://freestatistics.org/blog/index.php?pk=310183&T=6

[TABLE]
[ROW][C]Goldfeld-Quandt test for Heteroskedasticity[/C][/ROW]
[ROW][C]p-values[/C][C]Alternative Hypothesis[/C][/ROW]
[ROW][C]breakpoint index[/C][C]greater[/C][C]2-sided[/C][C]less[/C][/ROW]
[ROW][C]7[/C][C] 0.6075[/C][C] 0.7849[/C][C] 0.3925[/C][/ROW]
[ROW][C]8[/C][C] 0.5151[/C][C] 0.9697[/C][C] 0.4849[/C][/ROW]
[ROW][C]9[/C][C] 0.3975[/C][C] 0.7949[/C][C] 0.6026[/C][/ROW]
[ROW][C]10[/C][C] 0.2857[/C][C] 0.5714[/C][C] 0.7143[/C][/ROW]
[ROW][C]11[/C][C] 0.4989[/C][C] 0.9979[/C][C] 0.5011[/C][/ROW]
[ROW][C]12[/C][C] 0.4321[/C][C] 0.8642[/C][C] 0.5679[/C][/ROW]
[ROW][C]13[/C][C] 0.5459[/C][C] 0.9082[/C][C] 0.4541[/C][/ROW]
[ROW][C]14[/C][C] 0.8126[/C][C] 0.3748[/C][C] 0.1874[/C][/ROW]
[ROW][C]15[/C][C] 0.814[/C][C] 0.3719[/C][C] 0.186[/C][/ROW]
[ROW][C]16[/C][C] 0.7781[/C][C] 0.4439[/C][C] 0.2219[/C][/ROW]
[ROW][C]17[/C][C] 0.7135[/C][C] 0.5731[/C][C] 0.2865[/C][/ROW]
[ROW][C]18[/C][C] 0.6355[/C][C] 0.7289[/C][C] 0.3645[/C][/ROW]
[ROW][C]19[/C][C] 0.569[/C][C] 0.8621[/C][C] 0.431[/C][/ROW]
[ROW][C]20[/C][C] 0.5242[/C][C] 0.9516[/C][C] 0.4758[/C][/ROW]
[ROW][C]21[/C][C] 0.6706[/C][C] 0.6587[/C][C] 0.3294[/C][/ROW]
[ROW][C]22[/C][C] 0.6029[/C][C] 0.7942[/C][C] 0.3971[/C][/ROW]
[ROW][C]23[/C][C] 0.6306[/C][C] 0.7388[/C][C] 0.3694[/C][/ROW]
[ROW][C]24[/C][C] 0.6423[/C][C] 0.7154[/C][C] 0.3577[/C][/ROW]
[ROW][C]25[/C][C] 0.5859[/C][C] 0.8281[/C][C] 0.4141[/C][/ROW]
[ROW][C]26[/C][C] 0.5218[/C][C] 0.9564[/C][C] 0.4782[/C][/ROW]
[ROW][C]27[/C][C] 0.4531[/C][C] 0.9061[/C][C] 0.5469[/C][/ROW]
[ROW][C]28[/C][C] 0.4155[/C][C] 0.8309[/C][C] 0.5845[/C][/ROW]
[ROW][C]29[/C][C] 0.6835[/C][C] 0.6331[/C][C] 0.3165[/C][/ROW]
[ROW][C]30[/C][C] 0.6353[/C][C] 0.7294[/C][C] 0.3647[/C][/ROW]
[ROW][C]31[/C][C] 0.5816[/C][C] 0.8368[/C][C] 0.4184[/C][/ROW]
[ROW][C]32[/C][C] 0.5626[/C][C] 0.8748[/C][C] 0.4374[/C][/ROW]
[ROW][C]33[/C][C] 0.5258[/C][C] 0.9483[/C][C] 0.4742[/C][/ROW]
[ROW][C]34[/C][C] 0.4743[/C][C] 0.9486[/C][C] 0.5257[/C][/ROW]
[ROW][C]35[/C][C] 0.9259[/C][C] 0.1482[/C][C] 0.07409[/C][/ROW]
[ROW][C]36[/C][C] 0.9254[/C][C] 0.1492[/C][C] 0.07458[/C][/ROW]
[ROW][C]37[/C][C] 0.9981[/C][C] 0.003834[/C][C] 0.001917[/C][/ROW]
[ROW][C]38[/C][C] 0.9995[/C][C] 0.000936[/C][C] 0.000468[/C][/ROW]
[ROW][C]39[/C][C] 0.9992[/C][C] 0.001678[/C][C] 0.0008388[/C][/ROW]
[ROW][C]40[/C][C] 0.9996[/C][C] 0.0008657[/C][C] 0.0004328[/C][/ROW]
[ROW][C]41[/C][C] 0.9994[/C][C] 0.001253[/C][C] 0.0006266[/C][/ROW]
[ROW][C]42[/C][C] 0.9991[/C][C] 0.001744[/C][C] 0.0008721[/C][/ROW]
[ROW][C]43[/C][C] 0.9988[/C][C] 0.002311[/C][C] 0.001156[/C][/ROW]
[ROW][C]44[/C][C] 0.9979[/C][C] 0.004166[/C][C] 0.002083[/C][/ROW]
[ROW][C]45[/C][C] 0.9962[/C][C] 0.007505[/C][C] 0.003753[/C][/ROW]
[ROW][C]46[/C][C] 0.9961[/C][C] 0.007756[/C][C] 0.003878[/C][/ROW]
[ROW][C]47[/C][C] 0.9935[/C][C] 0.01302[/C][C] 0.00651[/C][/ROW]
[ROW][C]48[/C][C] 0.9892[/C][C] 0.02158[/C][C] 0.01079[/C][/ROW]
[ROW][C]49[/C][C] 0.9869[/C][C] 0.02616[/C][C] 0.01308[/C][/ROW]
[ROW][C]50[/C][C] 0.9853[/C][C] 0.02941[/C][C] 0.01471[/C][/ROW]
[ROW][C]51[/C][C] 0.9891[/C][C] 0.02171[/C][C] 0.01085[/C][/ROW]
[ROW][C]52[/C][C] 0.9848[/C][C] 0.03049[/C][C] 0.01525[/C][/ROW]
[ROW][C]53[/C][C] 0.9734[/C][C] 0.05323[/C][C] 0.02661[/C][/ROW]
[ROW][C]54[/C][C] 0.9835[/C][C] 0.03296[/C][C] 0.01648[/C][/ROW]
[ROW][C]55[/C][C] 0.9725[/C][C] 0.05499[/C][C] 0.02749[/C][/ROW]
[ROW][C]56[/C][C] 0.9516[/C][C] 0.09689[/C][C] 0.04844[/C][/ROW]
[ROW][C]57[/C][C] 0.9279[/C][C] 0.1442[/C][C] 0.07211[/C][/ROW]
[ROW][C]58[/C][C] 0.9406[/C][C] 0.1188[/C][C] 0.0594[/C][/ROW]
[ROW][C]59[/C][C] 0.9463[/C][C] 0.1075[/C][C] 0.05374[/C][/ROW]
[ROW][C]60[/C][C] 0.9709[/C][C] 0.0581[/C][C] 0.02905[/C][/ROW]
[ROW][C]61[/C][C] 0.9944[/C][C] 0.01124[/C][C] 0.00562[/C][/ROW]
[ROW][C]62[/C][C] 0.9891[/C][C] 0.02176[/C][C] 0.01088[/C][/ROW]
[ROW][C]63[/C][C] 0.9868[/C][C] 0.02644[/C][C] 0.01322[/C][/ROW]
[/TABLE]
Source: https://freestatistics.org/blog/index.php?pk=310183&T=6

Globally Unique Identifier (entire table): ba.freestatistics.org/blog/index.php?pk=310183&T=6

As an alternative you can also use a QR Code:  

The GUIDs for individual cells are displayed in the table below:

Goldfeld-Quandt test for Heteroskedasticity
p-valuesAlternative Hypothesis
breakpoint indexgreater2-sidedless
7 0.6075 0.7849 0.3925
8 0.5151 0.9697 0.4849
9 0.3975 0.7949 0.6026
10 0.2857 0.5714 0.7143
11 0.4989 0.9979 0.5011
12 0.4321 0.8642 0.5679
13 0.5459 0.9082 0.4541
14 0.8126 0.3748 0.1874
15 0.814 0.3719 0.186
16 0.7781 0.4439 0.2219
17 0.7135 0.5731 0.2865
18 0.6355 0.7289 0.3645
19 0.569 0.8621 0.431
20 0.5242 0.9516 0.4758
21 0.6706 0.6587 0.3294
22 0.6029 0.7942 0.3971
23 0.6306 0.7388 0.3694
24 0.6423 0.7154 0.3577
25 0.5859 0.8281 0.4141
26 0.5218 0.9564 0.4782
27 0.4531 0.9061 0.5469
28 0.4155 0.8309 0.5845
29 0.6835 0.6331 0.3165
30 0.6353 0.7294 0.3647
31 0.5816 0.8368 0.4184
32 0.5626 0.8748 0.4374
33 0.5258 0.9483 0.4742
34 0.4743 0.9486 0.5257
35 0.9259 0.1482 0.07409
36 0.9254 0.1492 0.07458
37 0.9981 0.003834 0.001917
38 0.9995 0.000936 0.000468
39 0.9992 0.001678 0.0008388
40 0.9996 0.0008657 0.0004328
41 0.9994 0.001253 0.0006266
42 0.9991 0.001744 0.0008721
43 0.9988 0.002311 0.001156
44 0.9979 0.004166 0.002083
45 0.9962 0.007505 0.003753
46 0.9961 0.007756 0.003878
47 0.9935 0.01302 0.00651
48 0.9892 0.02158 0.01079
49 0.9869 0.02616 0.01308
50 0.9853 0.02941 0.01471
51 0.9891 0.02171 0.01085
52 0.9848 0.03049 0.01525
53 0.9734 0.05323 0.02661
54 0.9835 0.03296 0.01648
55 0.9725 0.05499 0.02749
56 0.9516 0.09689 0.04844
57 0.9279 0.1442 0.07211
58 0.9406 0.1188 0.0594
59 0.9463 0.1075 0.05374
60 0.9709 0.0581 0.02905
61 0.9944 0.01124 0.00562
62 0.9891 0.02176 0.01088
63 0.9868 0.02644 0.01322


Meta Analysis of Goldfeld-Quandt test for Heteroskedasticity
Description# significant tests% significant testsOK/NOK
1% type I error level10 0.1754NOK
5% type I error level200.350877NOK
10% type I error level240.421053NOK

\begin{tabular}{lllllllll}
\hline
Meta Analysis of Goldfeld-Quandt test for Heteroskedasticity \tabularnewline
Description & # significant tests & % significant tests & OK/NOK \tabularnewline
1% type I error level & 10 &  0.1754 & NOK \tabularnewline
5% type I error level & 20 & 0.350877 & NOK \tabularnewline
10% type I error level & 24 & 0.421053 & NOK \tabularnewline
\hline
\end{tabular}
%Source: https://freestatistics.org/blog/index.php?pk=310183&T=7

[TABLE]
[ROW][C]Meta Analysis of Goldfeld-Quandt test for Heteroskedasticity[/C][/ROW]
[ROW][C]Description[/C][C]# significant tests[/C][C]% significant tests[/C][C]OK/NOK[/C][/ROW]
[ROW][C]1% type I error level[/C][C]10[/C][C] 0.1754[/C][C]NOK[/C][/ROW]
[ROW][C]5% type I error level[/C][C]20[/C][C]0.350877[/C][C]NOK[/C][/ROW]
[ROW][C]10% type I error level[/C][C]24[/C][C]0.421053[/C][C]NOK[/C][/ROW]
[/TABLE]
Source: https://freestatistics.org/blog/index.php?pk=310183&T=7

Globally Unique Identifier (entire table): ba.freestatistics.org/blog/index.php?pk=310183&T=7

As an alternative you can also use a QR Code:  

The GUIDs for individual cells are displayed in the table below:

Meta Analysis of Goldfeld-Quandt test for Heteroskedasticity
Description# significant tests% significant testsOK/NOK
1% type I error level10 0.1754NOK
5% type I error level200.350877NOK
10% type I error level240.421053NOK


Ramsey RESET F-Test for powers (2 and 3) of fitted values
> reset_test_fitted
	RESET test
data:  mylm
RESET = 24.435, df1 = 2, df2 = 64, p-value = 1.304e-08
Ramsey RESET F-Test for powers (2 and 3) of regressors
> reset_test_regressors
	RESET test
data:  mylm
RESET = 8.7784, df1 = 6, df2 = 60, p-value = 7.196e-07
Ramsey RESET F-Test for powers (2 and 3) of principal components
> reset_test_principal_components
	RESET test
data:  mylm
RESET = 22.857, df1 = 2, df2 = 64, p-value = 3.231e-08

\begin{tabular}{lllllllll}
\hline
Ramsey RESET F-Test for powers (2 and 3) of fitted values \tabularnewline
> reset_test_fitted
	RESET test
data:  mylm
RESET = 24.435, df1 = 2, df2 = 64, p-value = 1.304e-08
\tabularnewline Ramsey RESET F-Test for powers (2 and 3) of regressors \tabularnewline
> reset_test_regressors
	RESET test
data:  mylm
RESET = 8.7784, df1 = 6, df2 = 60, p-value = 7.196e-07
\tabularnewline Ramsey RESET F-Test for powers (2 and 3) of principal components \tabularnewline
> reset_test_principal_components
	RESET test
data:  mylm
RESET = 22.857, df1 = 2, df2 = 64, p-value = 3.231e-08
\tabularnewline \hline \end{tabular} %Source: https://freestatistics.org/blog/index.php?pk=310183&T=8

[TABLE]
[ROW][C]Ramsey RESET F-Test for powers (2 and 3) of fitted values[/C][/ROW]
[ROW][C]
> reset_test_fitted
	RESET test
data:  mylm
RESET = 24.435, df1 = 2, df2 = 64, p-value = 1.304e-08
[/C][/ROW] [ROW][C]Ramsey RESET F-Test for powers (2 and 3) of regressors[/C][/ROW] [ROW][C]
> reset_test_regressors
	RESET test
data:  mylm
RESET = 8.7784, df1 = 6, df2 = 60, p-value = 7.196e-07
[/C][/ROW] [ROW][C]Ramsey RESET F-Test for powers (2 and 3) of principal components[/C][/ROW] [ROW][C]
> reset_test_principal_components
	RESET test
data:  mylm
RESET = 22.857, df1 = 2, df2 = 64, p-value = 3.231e-08
[/C][/ROW] [/TABLE] Source: https://freestatistics.org/blog/index.php?pk=310183&T=8

Globally Unique Identifier (entire table): ba.freestatistics.org/blog/index.php?pk=310183&T=8

As an alternative you can also use a QR Code:  

The GUIDs for individual cells are displayed in the table below:

Ramsey RESET F-Test for powers (2 and 3) of fitted values
> reset_test_fitted
	RESET test
data:  mylm
RESET = 24.435, df1 = 2, df2 = 64, p-value = 1.304e-08
Ramsey RESET F-Test for powers (2 and 3) of regressors
> reset_test_regressors
	RESET test
data:  mylm
RESET = 8.7784, df1 = 6, df2 = 60, p-value = 7.196e-07
Ramsey RESET F-Test for powers (2 and 3) of principal components
> reset_test_principal_components
	RESET test
data:  mylm
RESET = 22.857, df1 = 2, df2 = 64, p-value = 3.231e-08


Variance Inflation Factors (Multicollinearity)
> vif
     Tot_inw BTW_plichtig     Pers_VTE 
  327.262385   319.163682     1.529351 

\begin{tabular}{lllllllll}
\hline
Variance Inflation Factors (Multicollinearity) \tabularnewline
> vif
     Tot_inw BTW_plichtig     Pers_VTE 
  327.262385   319.163682     1.529351 
\tabularnewline \hline \end{tabular} %Source: https://freestatistics.org/blog/index.php?pk=310183&T=9

[TABLE]
[ROW][C]Variance Inflation Factors (Multicollinearity)[/C][/ROW]
[ROW][C]
> vif
     Tot_inw BTW_plichtig     Pers_VTE 
  327.262385   319.163682     1.529351 
[/C][/ROW] [/TABLE] Source: https://freestatistics.org/blog/index.php?pk=310183&T=9

Globally Unique Identifier (entire table): ba.freestatistics.org/blog/index.php?pk=310183&T=9

As an alternative you can also use a QR Code:  

The GUIDs for individual cells are displayed in the table below:

Variance Inflation Factors (Multicollinearity)
> vif
     Tot_inw BTW_plichtig     Pers_VTE 
  327.262385   319.163682     1.529351 


Parameters (Session):
par1 = 4 ; par2 = Do not include Seasonal Dummies ; par3 = No Linear Trend ; par4 = 0 ; par5 = 0 ; par6 = 12 ;
Parameters (R input):
par1 = 4 ; par2 = Do not include Seasonal Dummies ; par3 = No Linear Trend ; par4 = 0 ; par5 = 0 ; par6 = 12 ;
R code (references can be found in the software module):
par6 <- '12'
par5 <- '0'
par4 <- '0'
par3 <- 'No Linear Trend'
par2 <- 'Do not include Seasonal Dummies'
par1 <- '4'
library(lattice)
library(lmtest)
library(car)
library(MASS)
n25 <- 25 #minimum number of obs. for Goldfeld-Quandt test
mywarning <- ''
par6 <- as.numeric(par6)
if(is.na(par6)) {
par6 <- 12
mywarning = 'Warning: you did not specify the seasonality. The seasonal period was set to s = 12.'
}
par1 <- as.numeric(par1)
if(is.na(par1)) {
par1 <- 1
mywarning = 'Warning: you did not specify the column number of the endogenous series! The first column was selected by default.'
}
if (par4=='') par4 <- 0
par4 <- as.numeric(par4)
if (!is.numeric(par4)) par4 <- 0
if (par5=='') par5 <- 0
par5 <- as.numeric(par5)
if (!is.numeric(par5)) par5 <- 0
x <- na.omit(t(y))
k <- length(x[1,])
n <- length(x[,1])
x1 <- cbind(x[,par1], x[,1:k!=par1])
mycolnames <- c(colnames(x)[par1], colnames(x)[1:k!=par1])
colnames(x1) <- mycolnames #colnames(x)[par1]
x <- x1
if (par3 == 'First Differences'){
(n <- n -1)
x2 <- array(0, dim=c(n,k), dimnames=list(1:n, paste('(1-B)',colnames(x),sep='')))
for (i in 1:n) {
for (j in 1:k) {
x2[i,j] <- x[i+1,j] - x[i,j]
}
}
x <- x2
}
if (par3 == 'Seasonal Differences (s)'){
(n <- n - par6)
x2 <- array(0, dim=c(n,k), dimnames=list(1:n, paste('(1-Bs)',colnames(x),sep='')))
for (i in 1:n) {
for (j in 1:k) {
x2[i,j] <- x[i+par6,j] - x[i,j]
}
}
x <- x2
}
if (par3 == 'First and Seasonal Differences (s)'){
(n <- n -1)
x2 <- array(0, dim=c(n,k), dimnames=list(1:n, paste('(1-B)',colnames(x),sep='')))
for (i in 1:n) {
for (j in 1:k) {
x2[i,j] <- x[i+1,j] - x[i,j]
}
}
x <- x2
(n <- n - par6)
x2 <- array(0, dim=c(n,k), dimnames=list(1:n, paste('(1-Bs)',colnames(x),sep='')))
for (i in 1:n) {
for (j in 1:k) {
x2[i,j] <- x[i+par6,j] - x[i,j]
}
}
x <- x2
}
if(par4 > 0) {
x2 <- array(0, dim=c(n-par4,par4), dimnames=list(1:(n-par4), paste(colnames(x)[par1],'(t-',1:par4,')',sep='')))
for (i in 1:(n-par4)) {
for (j in 1:par4) {
x2[i,j] <- x[i+par4-j,par1]
}
}
x <- cbind(x[(par4+1):n,], x2)
n <- n - par4
}
if(par5 > 0) {
x2 <- array(0, dim=c(n-par5*par6,par5), dimnames=list(1:(n-par5*par6), paste(colnames(x)[par1],'(t-',1:par5,'s)',sep='')))
for (i in 1:(n-par5*par6)) {
for (j in 1:par5) {
x2[i,j] <- x[i+par5*par6-j*par6,par1]
}
}
x <- cbind(x[(par5*par6+1):n,], x2)
n <- n - par5*par6
}
if (par2 == 'Include Seasonal Dummies'){
x2 <- array(0, dim=c(n,par6-1), dimnames=list(1:n, paste('M', seq(1:(par6-1)), sep ='')))
for (i in 1:(par6-1)){
x2[seq(i,n,par6),i] <- 1
}
x <- cbind(x, x2)
}
if (par2 == 'Include Monthly Dummies'){
x2 <- array(0, dim=c(n,11), dimnames=list(1:n, paste('M', seq(1:11), sep ='')))
for (i in 1:11){
x2[seq(i,n,12),i] <- 1
}
x <- cbind(x, x2)
}
if (par2 == 'Include Quarterly Dummies'){
x2 <- array(0, dim=c(n,3), dimnames=list(1:n, paste('Q', seq(1:3), sep ='')))
for (i in 1:3){
x2[seq(i,n,4),i] <- 1
}
x <- cbind(x, x2)
}
(k <- length(x[n,]))
if (par3 == 'Linear Trend'){
x <- cbind(x, c(1:n))
colnames(x)[k+1] <- 't'
}
print(x)
(k <- length(x[n,]))
head(x)
df <- as.data.frame(x)
(mylm <- lm(df))
(mysum <- summary(mylm))
if (n > n25) {
kp3 <- k + 3
nmkm3 <- n - k - 3
gqarr <- array(NA, dim=c(nmkm3-kp3+1,3))
numgqtests <- 0
numsignificant1 <- 0
numsignificant5 <- 0
numsignificant10 <- 0
for (mypoint in kp3:nmkm3) {
j <- 0
numgqtests <- numgqtests + 1
for (myalt in c('greater', 'two.sided', 'less')) {
j <- j + 1
gqarr[mypoint-kp3+1,j] <- gqtest(mylm, point=mypoint, alternative=myalt)$p.value
}
if (gqarr[mypoint-kp3+1,2] < 0.01) numsignificant1 <- numsignificant1 + 1
if (gqarr[mypoint-kp3+1,2] < 0.05) numsignificant5 <- numsignificant5 + 1
if (gqarr[mypoint-kp3+1,2] < 0.10) numsignificant10 <- numsignificant10 + 1
}
gqarr
}
bitmap(file='test0.png')
plot(x[,1], type='l', main='Actuals and Interpolation', ylab='value of Actuals and Interpolation (dots)', xlab='time or index')
points(x[,1]-mysum$resid)
grid()
dev.off()
bitmap(file='test1.png')
plot(mysum$resid, type='b', pch=19, main='Residuals', ylab='value of Residuals', xlab='time or index')
grid()
dev.off()
bitmap(file='test2.png')
sresid <- studres(mylm)
hist(sresid, freq=FALSE, main='Distribution of Studentized Residuals')
xfit<-seq(min(sresid),max(sresid),length=40)
yfit<-dnorm(xfit)
lines(xfit, yfit)
grid()
dev.off()
bitmap(file='test3.png')
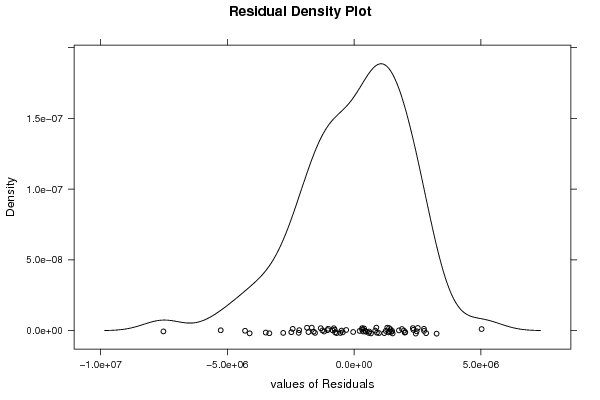
densityplot(~mysum$resid,col='black',main='Residual Density Plot', xlab='values of Residuals')
dev.off()
bitmap(file='test4.png')
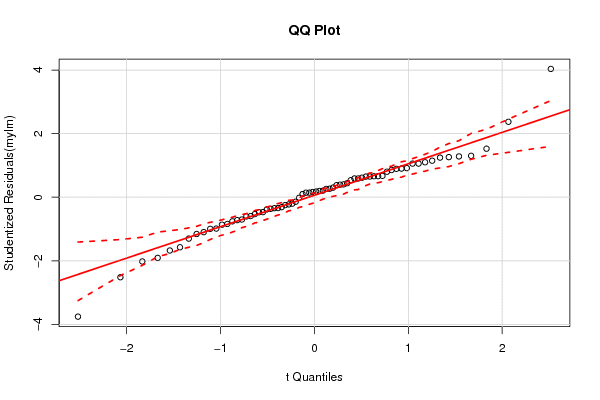
qqPlot(mylm, main='QQ Plot')
grid()
dev.off()
(myerror <- as.ts(mysum$resid))
bitmap(file='test5.png')
dum <- cbind(lag(myerror,k=1),myerror)
dum
dum1 <- dum[2:length(myerror),]
dum1
z <- as.data.frame(dum1)
print(z)
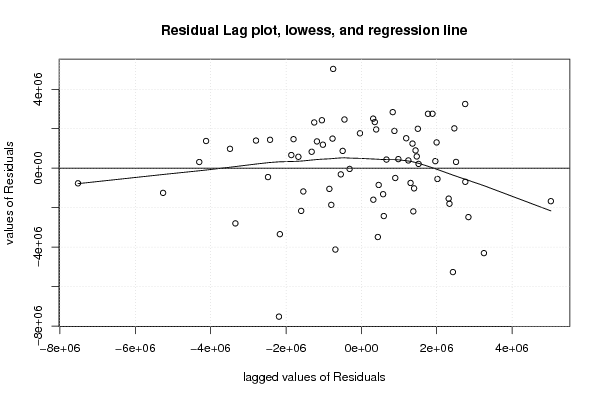
plot(z,main=paste('Residual Lag plot, lowess, and regression line'), ylab='values of Residuals', xlab='lagged values of Residuals')
lines(lowess(z))
abline(lm(z))
grid()
dev.off()
bitmap(file='test6.png')
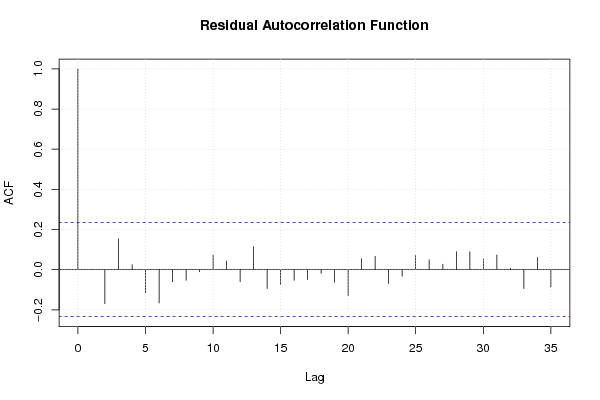
acf(mysum$resid, lag.max=length(mysum$resid)/2, main='Residual Autocorrelation Function')
grid()
dev.off()
bitmap(file='test7.png')
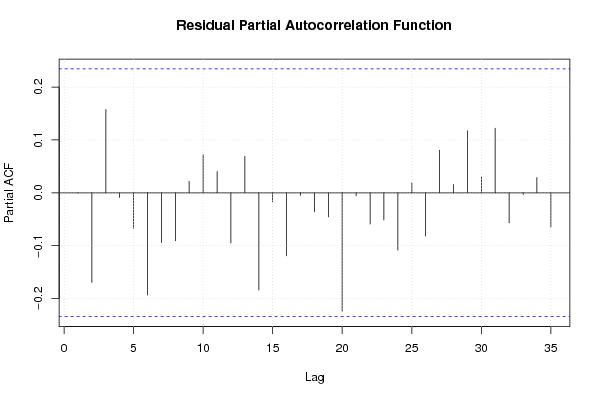
pacf(mysum$resid, lag.max=length(mysum$resid)/2, main='Residual Partial Autocorrelation Function')
grid()
dev.off()
bitmap(file='test8.png')
opar <- par(mfrow = c(2,2), oma = c(0, 0, 1.1, 0))
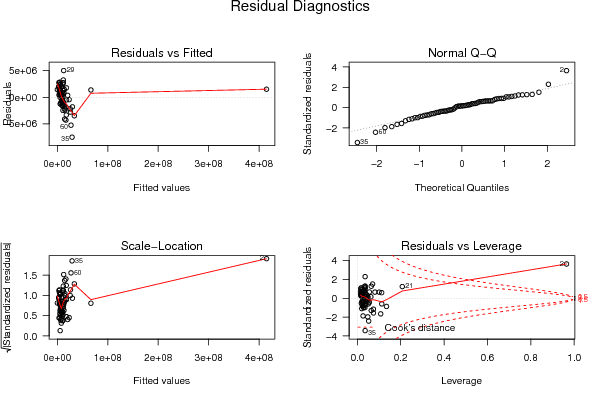
plot(mylm, las = 1, sub='Residual Diagnostics')
par(opar)
dev.off()
if (n > n25) {
bitmap(file='test9.png')
plot(kp3:nmkm3,gqarr[,2], main='Goldfeld-Quandt test',ylab='2-sided p-value',xlab='breakpoint')
grid()
dev.off()
}
load(file='createtable')
a<-table.start()
a<-table.row.start(a)
a<-table.element(a, 'Multiple Linear Regression - Estimated Regression Equation', 1, TRUE)
a<-table.row.end(a)
myeq <- colnames(x)[1]
myeq <- paste(myeq, '[t] = ', sep='')
for (i in 1:k){
if (mysum$coefficients[i,1] > 0) myeq <- paste(myeq, '+', '')
myeq <- paste(myeq, signif(mysum$coefficients[i,1],6), sep=' ')
if (rownames(mysum$coefficients)[i] != '(Intercept)') {
myeq <- paste(myeq, rownames(mysum$coefficients)[i], sep='')
if (rownames(mysum$coefficients)[i] != 't') myeq <- paste(myeq, '[t]', sep='')
}
}
myeq <- paste(myeq, ' + e[t]')
a<-table.row.start(a)
a<-table.element(a, myeq)
a<-table.row.end(a)
a<-table.row.start(a)
a<-table.element(a, mywarning)
a<-table.row.end(a)
a<-table.end(a)
table.save(a,file='mytable1.tab')
a<-table.start()
a<-table.row.start(a)
a<-table.element(a,'Multiple Linear Regression - Ordinary Least Squares', 6, TRUE)
a<-table.row.end(a)
a<-table.row.start(a)
a<-table.element(a,'Variable',header=TRUE)
a<-table.element(a,'Parameter',header=TRUE)
a<-table.element(a,'S.D.',header=TRUE)
a<-table.element(a,'T-STAT
H0: parameter = 0',header=TRUE)
a<-table.element(a,'2-tail p-value',header=TRUE)
a<-table.element(a,'1-tail p-value',header=TRUE)
a<-table.row.end(a)
for (i in 1:k){
a<-table.row.start(a)
a<-table.element(a,rownames(mysum$coefficients)[i],header=TRUE)
a<-table.element(a,formatC(signif(mysum$coefficients[i,1],5),format='g',flag='+'))
a<-table.element(a,formatC(signif(mysum$coefficients[i,2],5),format='g',flag=' '))
a<-table.element(a,formatC(signif(mysum$coefficients[i,3],4),format='e',flag='+'))
a<-table.element(a,formatC(signif(mysum$coefficients[i,4],4),format='g',flag=' '))
a<-table.element(a,formatC(signif(mysum$coefficients[i,4]/2,4),format='g',flag=' '))
a<-table.row.end(a)
}
a<-table.end(a)
table.save(a,file='mytable2.tab')
a<-table.start()
a<-table.row.start(a)
a<-table.element(a, 'Multiple Linear Regression - Regression Statistics', 2, TRUE)
a<-table.row.end(a)
a<-table.row.start(a)
a<-table.element(a, 'Multiple R',1,TRUE)
a<-table.element(a,formatC(signif(sqrt(mysum$r.squared),6),format='g',flag=' '))
a<-table.row.end(a)
a<-table.row.start(a)
a<-table.element(a, 'R-squared',1,TRUE)
a<-table.element(a,formatC(signif(mysum$r.squared,6),format='g',flag=' '))
a<-table.row.end(a)
a<-table.row.start(a)
a<-table.element(a, 'Adjusted R-squared',1,TRUE)
a<-table.element(a,formatC(signif(mysum$adj.r.squared,6),format='g',flag=' '))
a<-table.row.end(a)
a<-table.row.start(a)
a<-table.element(a, 'F-TEST (value)',1,TRUE)
a<-table.element(a,formatC(signif(mysum$fstatistic[1],6),format='g',flag=' '))
a<-table.row.end(a)
a<-table.row.start(a)
a<-table.element(a, 'F-TEST (DF numerator)',1,TRUE)
a<-table.element(a, signif(mysum$fstatistic[2],6))
a<-table.row.end(a)
a<-table.row.start(a)
a<-table.element(a, 'F-TEST (DF denominator)',1,TRUE)
a<-table.element(a, signif(mysum$fstatistic[3],6))
a<-table.row.end(a)
a<-table.row.start(a)
a<-table.element(a, 'p-value',1,TRUE)
a<-table.element(a,formatC(signif(1-pf(mysum$fstatistic[1],mysum$fstatistic[2],mysum$fstatistic[3]),6),format='g',flag=' '))
a<-table.row.end(a)
a<-table.row.start(a)
a<-table.element(a, 'Multiple Linear Regression - Residual Statistics', 2, TRUE)
a<-table.row.end(a)
a<-table.row.start(a)
a<-table.element(a, 'Residual Standard Deviation',1,TRUE)
a<-table.element(a,formatC(signif(mysum$sigma,6),format='g',flag=' '))
a<-table.row.end(a)
a<-table.row.start(a)
a<-table.element(a, 'Sum Squared Residuals',1,TRUE)
a<-table.element(a,formatC(signif(sum(myerror*myerror),6),format='g',flag=' '))
a<-table.row.end(a)
a<-table.end(a)
table.save(a,file='mytable3.tab')
myr <- as.numeric(mysum$resid)
myr
a <-table.start()
a <- table.row.start(a)
a <- table.element(a,'Menu of Residual Diagnostics',2,TRUE)
a <- table.row.end(a)
a <- table.row.start(a)
a <- table.element(a,'Description',1,TRUE)
a <- table.element(a,'Link',1,TRUE)
a <- table.row.end(a)
a <- table.row.start(a)
a <-table.element(a,'Histogram',1,header=TRUE)
a <- table.element(a,hyperlink( paste('https://supernova.wessa.net/rwasp_histogram.wasp?convertgetintopost=1&data=',paste(as.character(mysum$resid),sep='',collapse=' '),sep='') ,'Compute','Click here to examine the Residuals.'),1)
a <- table.row.end(a)
a <- table.row.start(a)
a <-table.element(a,'Central Tendency',1,header=TRUE)
a <- table.element(a,hyperlink( paste('https://supernova.wessa.net/rwasp_centraltendency.wasp?convertgetintopost=1&data=',paste(as.character(mysum$resid),sep='',collapse=' '),sep='') ,'Compute','Click here to examine the Residuals.'),1)
a <- table.row.end(a)
a <- table.row.start(a)
a <-table.element(a,'QQ Plot',1,header=TRUE)
a <- table.element(a,hyperlink( paste('https://supernova.wessa.net/rwasp_fitdistrnorm.wasp?convertgetintopost=1&data=',paste(as.character(mysum$resid),sep='',collapse=' '),sep='') ,'Compute','Click here to examine the Residuals.'),1)
a <- table.row.end(a)
a <- table.row.start(a)
a <-table.element(a,'Kernel Density Plot',1,header=TRUE)
a <- table.element(a,hyperlink( paste('https://supernova.wessa.net/rwasp_density.wasp?convertgetintopost=1&data=',paste(as.character(mysum$resid),sep='',collapse=' '),sep='') ,'Compute','Click here to examine the Residuals.'),1)
a <- table.row.end(a)
a <- table.row.start(a)
a <-table.element(a,'Skewness/Kurtosis Test',1,header=TRUE)
a <- table.element(a,hyperlink( paste('https://supernova.wessa.net/rwasp_skewness_kurtosis.wasp?convertgetintopost=1&data=',paste(as.character(mysum$resid),sep='',collapse=' '),sep='') ,'Compute','Click here to examine the Residuals.'),1)
a <- table.row.end(a)
a <- table.row.start(a)
a <-table.element(a,'Skewness-Kurtosis Plot',1,header=TRUE)
a <- table.element(a,hyperlink( paste('https://supernova.wessa.net/rwasp_skewness_kurtosis_plot.wasp?convertgetintopost=1&data=',paste(as.character(mysum$resid),sep='',collapse=' '),sep='') ,'Compute','Click here to examine the Residuals.'),1)
a <- table.row.end(a)
a <- table.row.start(a)
a <-table.element(a,'Harrell-Davis Plot',1,header=TRUE)
a <- table.element(a,hyperlink( paste('https://supernova.wessa.net/rwasp_harrell_davis.wasp?convertgetintopost=1&data=',paste(as.character(mysum$resid),sep='',collapse=' '),sep='') ,'Compute','Click here to examine the Residuals.'),1)
a <- table.row.end(a)
a <- table.row.start(a)
a <-table.element(a,'Bootstrap Plot -- Central Tendency',1,header=TRUE)
a <- table.element(a,hyperlink( paste('https://supernova.wessa.net/rwasp_bootstrapplot1.wasp?convertgetintopost=1&data=',paste(as.character(mysum$resid),sep='',collapse=' '),sep='') ,'Compute','Click here to examine the Residuals.'),1)
a <- table.row.end(a)
a <- table.row.start(a)
a <-table.element(a,'Blocked Bootstrap Plot -- Central Tendency',1,header=TRUE)
a <- table.element(a,hyperlink( paste('https://supernova.wessa.net/rwasp_bootstrapplot.wasp?convertgetintopost=1&data=',paste(as.character(mysum$resid),sep='',collapse=' '),sep='') ,'Compute','Click here to examine the Residuals.'),1)
a <- table.row.end(a)
a <- table.row.start(a)
a <-table.element(a,'(Partial) Autocorrelation Plot',1,header=TRUE)
a <- table.element(a,hyperlink( paste('https://supernova.wessa.net/rwasp_autocorrelation.wasp?convertgetintopost=1&data=',paste(as.character(mysum$resid),sep='',collapse=' '),sep='') ,'Compute','Click here to examine the Residuals.'),1)
a <- table.row.end(a)
a <- table.row.start(a)
a <-table.element(a,'Spectral Analysis',1,header=TRUE)
a <- table.element(a,hyperlink( paste('https://supernova.wessa.net/rwasp_spectrum.wasp?convertgetintopost=1&data=',paste(as.character(mysum$resid),sep='',collapse=' '),sep='') ,'Compute','Click here to examine the Residuals.'),1)
a <- table.row.end(a)
a <- table.row.start(a)
a <-table.element(a,'Tukey lambda PPCC Plot',1,header=TRUE)
a <- table.element(a,hyperlink( paste('https://supernova.wessa.net/rwasp_tukeylambda.wasp?convertgetintopost=1&data=',paste(as.character(mysum$resid),sep='',collapse=' '),sep='') ,'Compute','Click here to examine the Residuals.'),1)
a <- table.row.end(a)
a <- table.row.start(a)
a <-table.element(a,'Box-Cox Normality Plot',1,header=TRUE)
a <- table.element(a,hyperlink( paste('https://supernova.wessa.net/rwasp_boxcoxnorm.wasp?convertgetintopost=1&data=',paste(as.character(mysum$resid),sep='',collapse=' '),sep='') ,'Compute','Click here to examine the Residuals.'),1)
a <- table.row.end(a)
a <- table.row.start(a)
a <- table.element(a,'Summary Statistics',1,header=TRUE)
a <- table.element(a,hyperlink( paste('https://supernova.wessa.net/rwasp_summary1.wasp?convertgetintopost=1&data=',paste(as.character(mysum$resid),sep='',collapse=' '),sep='') ,'Compute','Click here to examine the Residuals.'),1)
a <- table.row.end(a)
a<-table.end(a)
table.save(a,file='mytable7.tab')
if(n < 200) {
a<-table.start()
a<-table.row.start(a)
a<-table.element(a, 'Multiple Linear Regression - Actuals, Interpolation, and Residuals', 4, TRUE)
a<-table.row.end(a)
a<-table.row.start(a)
a<-table.element(a, 'Time or Index', 1, TRUE)
a<-table.element(a, 'Actuals', 1, TRUE)
a<-table.element(a, 'Interpolation
Forecast', 1, TRUE)
a<-table.element(a, 'Residuals
Prediction Error', 1, TRUE)
a<-table.row.end(a)
for (i in 1:n) {
a<-table.row.start(a)
a<-table.element(a,i, 1, TRUE)
a<-table.element(a,formatC(signif(x[i],6),format='g',flag=' '))
a<-table.element(a,formatC(signif(x[i]-mysum$resid[i],6),format='g',flag=' '))
a<-table.element(a,formatC(signif(mysum$resid[i],6),format='g',flag=' '))
a<-table.row.end(a)
}
a<-table.end(a)
table.save(a,file='mytable4.tab')
if (n > n25) {
a<-table.start()
a<-table.row.start(a)
a<-table.element(a,'Goldfeld-Quandt test for Heteroskedasticity',4,TRUE)
a<-table.row.end(a)
a<-table.row.start(a)
a<-table.element(a,'p-values',header=TRUE)
a<-table.element(a,'Alternative Hypothesis',3,header=TRUE)
a<-table.row.end(a)
a<-table.row.start(a)
a<-table.element(a,'breakpoint index',header=TRUE)
a<-table.element(a,'greater',header=TRUE)
a<-table.element(a,'2-sided',header=TRUE)
a<-table.element(a,'less',header=TRUE)
a<-table.row.end(a)
for (mypoint in kp3:nmkm3) {
a<-table.row.start(a)
a<-table.element(a,mypoint,header=TRUE)
a<-table.element(a,formatC(signif(gqarr[mypoint-kp3+1,1],6),format='g',flag=' '))
a<-table.element(a,formatC(signif(gqarr[mypoint-kp3+1,2],6),format='g',flag=' '))
a<-table.element(a,formatC(signif(gqarr[mypoint-kp3+1,3],6),format='g',flag=' '))
a<-table.row.end(a)
}
a<-table.end(a)
table.save(a,file='mytable5.tab')
a<-table.start()
a<-table.row.start(a)
a<-table.element(a,'Meta Analysis of Goldfeld-Quandt test for Heteroskedasticity',4,TRUE)
a<-table.row.end(a)
a<-table.row.start(a)
a<-table.element(a,'Description',header=TRUE)
a<-table.element(a,'# significant tests',header=TRUE)
a<-table.element(a,'% significant tests',header=TRUE)
a<-table.element(a,'OK/NOK',header=TRUE)
a<-table.row.end(a)
a<-table.row.start(a)
a<-table.element(a,'1% type I error level',header=TRUE)
a<-table.element(a,signif(numsignificant1,6))
a<-table.element(a,formatC(signif(numsignificant1/numgqtests,6),format='g',flag=' '))
if (numsignificant1/numgqtests < 0.01) dum <- 'OK' else dum <- 'NOK'
a<-table.element(a,dum)
a<-table.row.end(a)
a<-table.row.start(a)
a<-table.element(a,'5% type I error level',header=TRUE)
a<-table.element(a,signif(numsignificant5,6))
a<-table.element(a,signif(numsignificant5/numgqtests,6))
if (numsignificant5/numgqtests < 0.05) dum <- 'OK' else dum <- 'NOK'
a<-table.element(a,dum)
a<-table.row.end(a)
a<-table.row.start(a)
a<-table.element(a,'10% type I error level',header=TRUE)
a<-table.element(a,signif(numsignificant10,6))
a<-table.element(a,signif(numsignificant10/numgqtests,6))
if (numsignificant10/numgqtests < 0.1) dum <- 'OK' else dum <- 'NOK'
a<-table.element(a,dum)
a<-table.row.end(a)
a<-table.end(a)
table.save(a,file='mytable6.tab')
}
}
a<-table.start()
a<-table.row.start(a)
a<-table.element(a,'Ramsey RESET F-Test for powers (2 and 3) of fitted values',1,TRUE)
a<-table.row.end(a)
a<-table.row.start(a)
reset_test_fitted <- resettest(mylm,power=2:3,type='fitted')
a<-table.element(a,paste('
',RC.texteval('reset_test_fitted'),'
',sep=''))
a<-table.row.end(a)
a<-table.row.start(a)
a<-table.element(a,'Ramsey RESET F-Test for powers (2 and 3) of regressors',1,TRUE)
a<-table.row.end(a)
a<-table.row.start(a)
reset_test_regressors <- resettest(mylm,power=2:3,type='regressor')
a<-table.element(a,paste('
',RC.texteval('reset_test_regressors'),'
',sep=''))
a<-table.row.end(a)
a<-table.row.start(a)
a<-table.element(a,'Ramsey RESET F-Test for powers (2 and 3) of principal components',1,TRUE)
a<-table.row.end(a)
a<-table.row.start(a)
reset_test_principal_components <- resettest(mylm,power=2:3,type='princomp')
a<-table.element(a,paste('
',RC.texteval('reset_test_principal_components'),'
',sep=''))
a<-table.row.end(a)
a<-table.end(a)
table.save(a,file='mytable8.tab')
a<-table.start()
a<-table.row.start(a)
a<-table.element(a,'Variance Inflation Factors (Multicollinearity)',1,TRUE)
a<-table.row.end(a)
a<-table.row.start(a)
vif <- vif(mylm)
a<-table.element(a,paste('
',RC.texteval('vif'),'
',sep=''))
a<-table.row.end(a)
a<-table.end(a)
table.save(a,file='mytable9.tab')