Free Statistics
of Irreproducible Research!
Description of Statistical Computation | ||||||||||||||||||||||||||||||
|---|---|---|---|---|---|---|---|---|---|---|---|---|---|---|---|---|---|---|---|---|---|---|---|---|---|---|---|---|---|---|
| Author's title | ||||||||||||||||||||||||||||||
| Author | *The author of this computation has been verified* | |||||||||||||||||||||||||||||
| R Software Module | rwasp_skewness_kurtosis_plot.wasp | |||||||||||||||||||||||||||||
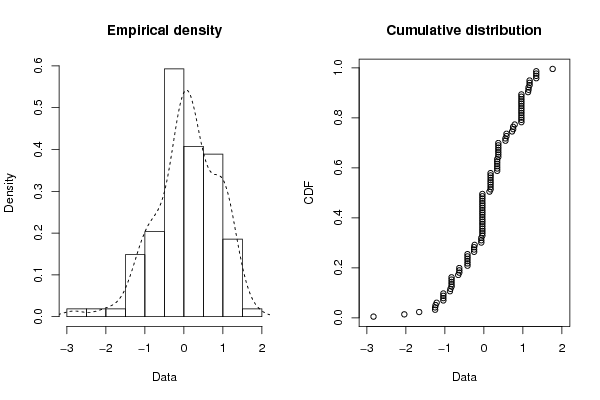
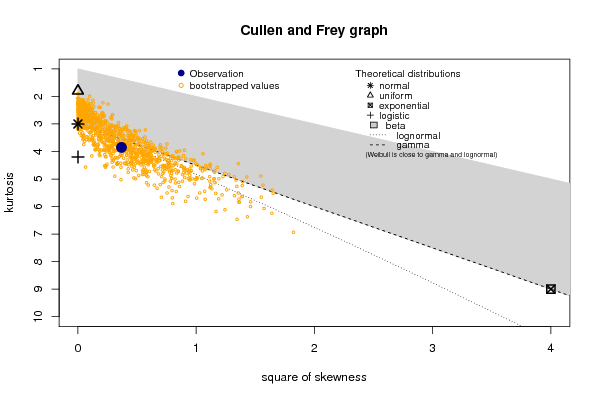
| Title produced by software | Skewness-Kurtosis Plot | |||||||||||||||||||||||||||||
| Date of computation | Mon, 18 Dec 2017 13:51:43 +0100 | |||||||||||||||||||||||||||||
| Cite this page as follows | Statistical Computations at FreeStatistics.org, Office for Research Development and Education, URL https://freestatistics.org/blog/index.php?v=date/2017/Dec/18/t1513601525osc8cowtmr21yjf.htm/, Retrieved Tue, 14 May 2024 16:18:51 +0000 | |||||||||||||||||||||||||||||
| Statistical Computations at FreeStatistics.org, Office for Research Development and Education, URL https://freestatistics.org/blog/index.php?pk=310147, Retrieved Tue, 14 May 2024 16:18:51 +0000 | ||||||||||||||||||||||||||||||
| QR Codes: | ||||||||||||||||||||||||||||||
|
| ||||||||||||||||||||||||||||||
| Original text written by user: | ||||||||||||||||||||||||||||||
| IsPrivate? | No (this computation is public) | |||||||||||||||||||||||||||||
| User-defined keywords | ||||||||||||||||||||||||||||||
| Estimated Impact | 44 | |||||||||||||||||||||||||||||
Tree of Dependent Computations | ||||||||||||||||||||||||||||||
| Family? (F = Feedback message, R = changed R code, M = changed R Module, P = changed Parameters, D = changed Data) | ||||||||||||||||||||||||||||||
| - [Skewness-Kurtosis Plot] [Skewness en Kurtosis] [2017-12-18 12:51:43] [cc67e55ad731ea545e369166f6dbbbc3] [Current] | ||||||||||||||||||||||||||||||
| Feedback Forum | ||||||||||||||||||||||||||||||
Post a new message | ||||||||||||||||||||||||||||||
Dataset | ||||||||||||||||||||||||||||||
| Dataseries X: | ||||||||||||||||||||||||||||||
-0.829399843258336 -0.420870186280318 -0.420870186280289 1.34107819871831 -0.420870186280284 0.579129813719717 -0.631366336802917 0.960104006219015 0.170600156741648 0.960104006219015 -0.0398959937809846 0.341078198718315 -1.03989599378098 -0.0398959937809846 0.170600156741648 0.749607855696383 -0.0398959937809846 -0.631366336802917 0.368633663197084 -0.250392144303617 -1.25039214430362 1.14304469226288 -0.0398959937809846 0.960104006219015 -0.0398959937809846 0.170600156741648 1.13058204819568 1.17060015674165 0.341078198718315 0.170600156741648 0.579129813719717 0.170600156741648 -0.829399843258352 -0.631366336802917 -1.21037403575765 0.170600156741648 -1.23792950023642 0.960104006219015 0.170600156741648 -0.829399843258352 1.17060015674165 -0.0398959937809846 -2.82939984325835 -0.0398959937809846 -0.0398959937809846 -0.0674514582597537 0.960104006219015 1.34107819871831 0.789625964242349 -0.0398959937809846 0.960104006219015 1.14304469226288 1.34107819871831 0.960104006219015 -0.0398959937809846 0.960104006219015 -0.420870186280284 -0.250392144303617 0.143044692262879 -0.420870186280284 -0.658921801281686 0.341078198718315 0.341078198718315 0.368633663197084 -1.03989599378098 0.749607855696383 -1.25039214430362 -0.0398959937809846 0.368633663197084 -0.23792950023642 -0.856955307737121 -1.65892180128169 0.368633663197084 0.368633663197084 0.170600156741648 -0.0674514582597537 -0.869417951804318 1.17060015674165 -2.03989599378098 -0.0398959937809846 0.960104006219015 -0.829399843258352 -0.0398959937809846 -0.250392144303617 0.368633663197084 -0.0398959937809846 -0.0398959937809846 -1.03989599378098 0.551574349240947 -0.0398959937809846 -0.0398959937809846 0.960104006219015 -0.0398959937809846 -1.03989599378098 0.341078198718315 1.76207049976358 0.368633663197084 -0.0674514582597537 0.551574349240947 -0.0398959937809846 0.960104006219015 -0.829399843258352 0.341078198718315 0.722052391217614 -0.420870186280284 0.960104006219015 1.34107819871831 0.96010400621901 | ||||||||||||||||||||||||||||||
Tables (Output of Computation) | ||||||||||||||||||||||||||||||
| ||||||||||||||||||||||||||||||
Figures (Output of Computation) | ||||||||||||||||||||||||||||||
Input Parameters & R Code | ||||||||||||||||||||||||||||||
| Parameters (Session): | ||||||||||||||||||||||||||||||
| Parameters (R input): | ||||||||||||||||||||||||||||||
| R code (references can be found in the software module): | ||||||||||||||||||||||||||||||
library(fitdistrplus) | ||||||||||||||||||||||||||||||