Free Statistics

of Irreproducible Research!

Author's title

Author*The author of this computation has been verified*
R Software Modulerwasp_autocorrelation.wasp
Title produced by software(Partial) Autocorrelation Function
Date of computationMon, 18 Dec 2017 11:04:52 +0100
Cite this page as followsStatistical Computations at FreeStatistics.org, Office for Research Development and Education, URL https://freestatistics.org/blog/index.php?v=date/2017/Dec/18/t1513591502xatwxl82cihmuv4.htm/, Retrieved Tue, 14 May 2024 09:30:25 +0000
Statistical Computations at FreeStatistics.org, Office for Research Development and Education, URL https://freestatistics.org/blog/index.php?pk=310104, Retrieved Tue, 14 May 2024 09:30:25 +0000
QR Codes:

Original text written by user:
IsPrivate?No (this computation is public)
User-defined keywords
Estimated Impact81
Family? (F = Feedback message, R = changed R code, M = changed R Module, P = changed Parameters, D = changed Data)
-       [(Partial) Autocorrelation Function] [] [2017-12-18 10:04:52] [29a87998297b2697efa2253fad859704] [Current]
Feedback Forum

Post a new message
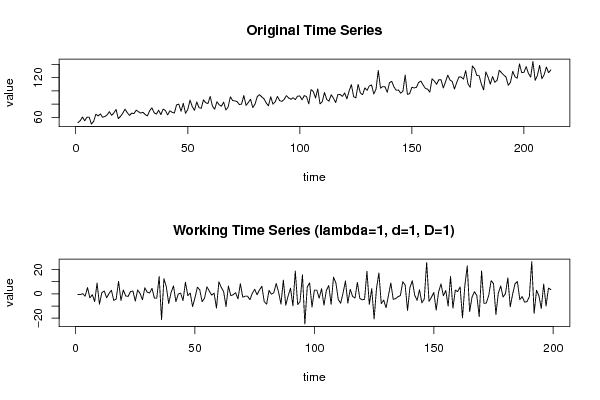
Dataseries X:
52
54.9
60.5
54.8
60.1
60.3
49.8
53.8
64.8
62
65.2
60.1
61.2
63.6
68.6
63.1
66.5
71.9
58.1
61.5
66.2
72.3
67
62.9
66.4
65.6
70.9
68.4
66.4
67.6
64.1
62.1
70
74.4
67
64.8
70.7
64
72.5
70.4
63.6
69.8
67.7
66.4
78.9
79.9
69.1
81.2
66
71.8
86.1
76.1
70.5
83.3
74.8
73.4
86.5
82
80.8
91.5
77
72.3
83.5
79
76.7
83.1
71.1
75.5
90.9
85.4
84.8
83.8
79.3
79.9
93
78.1
82.3
87.3
74.6
80
91.3
94.2
90.9
88
81.6
77.4
91
79.9
83.4
91.6
85.2
84.1
87
92.8
89.2
87.3
89.5
86.8
92
92.2
86.4
92.9
91.2
80.3
102
99
89.2
103
80.4
83.4
97.6
87
84.4
94.1
88.9
82.3
94.7
94.5
91.6
96.8
87.9
99.9
109.5
91.2
89.4
109.7
96.9
94.1
104.4
100.8
107.4
108.9
95.2
102.7
130.9
104
106.5
106.1
97.8
112.2
114.5
105.8
101
101.2
96.5
99.5
123.8
94.6
95.8
105.4
104.4
105.2
112.7
114.8
108.9
103.8
102.5
98.1
118.2
114.8
109.9
116.7
116.9
104.4
113.5
123.8
116.4
114.1
102.8
112.7
121.1
120.8
117.8
130.4
110.9
105.4
137.6
133.3
123.3
122.8
110.2
101.4
128.7
120.6
110.1
121.6
113
115.9
131.1
127.4
123.9
120.8
108.5
112.9
129.6
121.3
119.1
140.8
127.4
128.1
136.6
126.5
120.8
144.3
116
123.4
138.6
118.3
124.2
136
127.4
131.6


Summary of computational transaction
Raw Input view raw input (R code)
Raw Outputview raw output of R engine
Computing time1 seconds
R ServerBig Analytics Cloud Computing Center

\begin{tabular}{lllllllll}
\hline
Summary of computational transaction \tabularnewline
Raw Input view raw input (R code)  \tabularnewline
Raw Outputview raw output of R engine  \tabularnewline
Computing time1 seconds \tabularnewline
R ServerBig Analytics Cloud Computing Center \tabularnewline
\hline
\end{tabular}
%Source: https://freestatistics.org/blog/index.php?pk=310104&T=0

[TABLE]
[ROW]
Summary of computational transaction[/C][/ROW] [ROW]Raw Input[/C] view raw input (R code) [/C][/ROW] [ROW]Raw Output[/C]view raw output of R engine [/C][/ROW] [ROW]Computing time[/C]1 seconds[/C][/ROW] [ROW]R Server[/C]Big Analytics Cloud Computing Center[/C][/ROW] [/TABLE] Source: https://freestatistics.org/blog/index.php?pk=310104&T=0

Globally Unique Identifier (entire table): ba.freestatistics.org/blog/index.php?pk=310104&T=0

As an alternative you can also use a QR Code:  

The GUIDs for individual cells are displayed in the table below:

Summary of computational transaction
Raw Input view raw input (R code)
Raw Outputview raw output of R engine
Computing time1 seconds
R ServerBig Analytics Cloud Computing Center


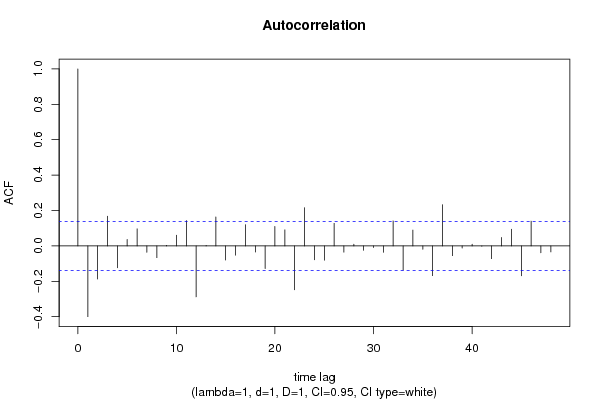
Autocorrelation Function
Time lag kACF(k)T-STATP-value
1-0.399734-5.63890
2-0.186737-2.63430.004548
30.1672062.35870.009653
4-0.12303-1.73550.042096
50.0363880.51330.304149
60.0962631.3580.088008
7-0.035459-0.50020.30874
8-0.066071-0.93210.17622
90.0030810.04350.482686
100.0599750.8460.199271
110.1431522.01940.022393
12-0.28786-4.06083.5e-05
130.0021130.02980.488123
140.1637842.31050.010944
15-0.079839-1.12630.130705
16-0.051974-0.73320.232153
170.1196311.68760.046528
18-0.034279-0.48360.314612
19-0.128004-1.80570.036237
200.1092841.54160.062375
210.0906071.27820.101339
22-0.247358-3.48940.000298
230.2152513.03650.001357
24-0.078099-1.10170.135955
25-0.080472-1.13520.12883
260.1274861.79840.036813
27-0.035129-0.49550.31038
280.0097910.13810.445144
29-0.02423-0.34180.366431
30-0.009096-0.12830.449015
31-0.035675-0.50330.307671
320.1413691.99430.023745
33-0.136727-1.92880.027591
340.0893711.26070.10444
35-0.019379-0.27340.392424
36-0.168123-2.37170.009331
370.233053.28760.000597
38-0.054825-0.77340.220101
39-0.012168-0.17160.431944
400.0093540.1320.447575
41-0.001667-0.02350.490628
42-0.071761-1.01230.156309
430.0478690.67530.250141
440.0943251.33060.092418
45-0.168602-2.37840.009166
460.1399111.97370.0249
47-0.038491-0.5430.293875
48-0.033633-0.47450.317848

\begin{tabular}{lllllllll}
\hline
Autocorrelation Function \tabularnewline
Time lag k & ACF(k) & T-STAT & P-value \tabularnewline
1 & -0.399734 & -5.6389 & 0 \tabularnewline
2 & -0.186737 & -2.6343 & 0.004548 \tabularnewline
3 & 0.167206 & 2.3587 & 0.009653 \tabularnewline
4 & -0.12303 & -1.7355 & 0.042096 \tabularnewline
5 & 0.036388 & 0.5133 & 0.304149 \tabularnewline
6 & 0.096263 & 1.358 & 0.088008 \tabularnewline
7 & -0.035459 & -0.5002 & 0.30874 \tabularnewline
8 & -0.066071 & -0.9321 & 0.17622 \tabularnewline
9 & 0.003081 & 0.0435 & 0.482686 \tabularnewline
10 & 0.059975 & 0.846 & 0.199271 \tabularnewline
11 & 0.143152 & 2.0194 & 0.022393 \tabularnewline
12 & -0.28786 & -4.0608 & 3.5e-05 \tabularnewline
13 & 0.002113 & 0.0298 & 0.488123 \tabularnewline
14 & 0.163784 & 2.3105 & 0.010944 \tabularnewline
15 & -0.079839 & -1.1263 & 0.130705 \tabularnewline
16 & -0.051974 & -0.7332 & 0.232153 \tabularnewline
17 & 0.119631 & 1.6876 & 0.046528 \tabularnewline
18 & -0.034279 & -0.4836 & 0.314612 \tabularnewline
19 & -0.128004 & -1.8057 & 0.036237 \tabularnewline
20 & 0.109284 & 1.5416 & 0.062375 \tabularnewline
21 & 0.090607 & 1.2782 & 0.101339 \tabularnewline
22 & -0.247358 & -3.4894 & 0.000298 \tabularnewline
23 & 0.215251 & 3.0365 & 0.001357 \tabularnewline
24 & -0.078099 & -1.1017 & 0.135955 \tabularnewline
25 & -0.080472 & -1.1352 & 0.12883 \tabularnewline
26 & 0.127486 & 1.7984 & 0.036813 \tabularnewline
27 & -0.035129 & -0.4955 & 0.31038 \tabularnewline
28 & 0.009791 & 0.1381 & 0.445144 \tabularnewline
29 & -0.02423 & -0.3418 & 0.366431 \tabularnewline
30 & -0.009096 & -0.1283 & 0.449015 \tabularnewline
31 & -0.035675 & -0.5033 & 0.307671 \tabularnewline
32 & 0.141369 & 1.9943 & 0.023745 \tabularnewline
33 & -0.136727 & -1.9288 & 0.027591 \tabularnewline
34 & 0.089371 & 1.2607 & 0.10444 \tabularnewline
35 & -0.019379 & -0.2734 & 0.392424 \tabularnewline
36 & -0.168123 & -2.3717 & 0.009331 \tabularnewline
37 & 0.23305 & 3.2876 & 0.000597 \tabularnewline
38 & -0.054825 & -0.7734 & 0.220101 \tabularnewline
39 & -0.012168 & -0.1716 & 0.431944 \tabularnewline
40 & 0.009354 & 0.132 & 0.447575 \tabularnewline
41 & -0.001667 & -0.0235 & 0.490628 \tabularnewline
42 & -0.071761 & -1.0123 & 0.156309 \tabularnewline
43 & 0.047869 & 0.6753 & 0.250141 \tabularnewline
44 & 0.094325 & 1.3306 & 0.092418 \tabularnewline
45 & -0.168602 & -2.3784 & 0.009166 \tabularnewline
46 & 0.139911 & 1.9737 & 0.0249 \tabularnewline
47 & -0.038491 & -0.543 & 0.293875 \tabularnewline
48 & -0.033633 & -0.4745 & 0.317848 \tabularnewline
\hline
\end{tabular}
%Source: https://freestatistics.org/blog/index.php?pk=310104&T=1

[TABLE]
[ROW][C]Autocorrelation Function[/C][/ROW]
[ROW][C]Time lag k[/C][C]ACF(k)[/C][C]T-STAT[/C][C]P-value[/C][/ROW]
[ROW][C]1[/C][C]-0.399734[/C][C]-5.6389[/C][C]0[/C][/ROW]
[ROW][C]2[/C][C]-0.186737[/C][C]-2.6343[/C][C]0.004548[/C][/ROW]
[ROW][C]3[/C][C]0.167206[/C][C]2.3587[/C][C]0.009653[/C][/ROW]
[ROW][C]4[/C][C]-0.12303[/C][C]-1.7355[/C][C]0.042096[/C][/ROW]
[ROW][C]5[/C][C]0.036388[/C][C]0.5133[/C][C]0.304149[/C][/ROW]
[ROW][C]6[/C][C]0.096263[/C][C]1.358[/C][C]0.088008[/C][/ROW]
[ROW][C]7[/C][C]-0.035459[/C][C]-0.5002[/C][C]0.30874[/C][/ROW]
[ROW][C]8[/C][C]-0.066071[/C][C]-0.9321[/C][C]0.17622[/C][/ROW]
[ROW][C]9[/C][C]0.003081[/C][C]0.0435[/C][C]0.482686[/C][/ROW]
[ROW][C]10[/C][C]0.059975[/C][C]0.846[/C][C]0.199271[/C][/ROW]
[ROW][C]11[/C][C]0.143152[/C][C]2.0194[/C][C]0.022393[/C][/ROW]
[ROW][C]12[/C][C]-0.28786[/C][C]-4.0608[/C][C]3.5e-05[/C][/ROW]
[ROW][C]13[/C][C]0.002113[/C][C]0.0298[/C][C]0.488123[/C][/ROW]
[ROW][C]14[/C][C]0.163784[/C][C]2.3105[/C][C]0.010944[/C][/ROW]
[ROW][C]15[/C][C]-0.079839[/C][C]-1.1263[/C][C]0.130705[/C][/ROW]
[ROW][C]16[/C][C]-0.051974[/C][C]-0.7332[/C][C]0.232153[/C][/ROW]
[ROW][C]17[/C][C]0.119631[/C][C]1.6876[/C][C]0.046528[/C][/ROW]
[ROW][C]18[/C][C]-0.034279[/C][C]-0.4836[/C][C]0.314612[/C][/ROW]
[ROW][C]19[/C][C]-0.128004[/C][C]-1.8057[/C][C]0.036237[/C][/ROW]
[ROW][C]20[/C][C]0.109284[/C][C]1.5416[/C][C]0.062375[/C][/ROW]
[ROW][C]21[/C][C]0.090607[/C][C]1.2782[/C][C]0.101339[/C][/ROW]
[ROW][C]22[/C][C]-0.247358[/C][C]-3.4894[/C][C]0.000298[/C][/ROW]
[ROW][C]23[/C][C]0.215251[/C][C]3.0365[/C][C]0.001357[/C][/ROW]
[ROW][C]24[/C][C]-0.078099[/C][C]-1.1017[/C][C]0.135955[/C][/ROW]
[ROW][C]25[/C][C]-0.080472[/C][C]-1.1352[/C][C]0.12883[/C][/ROW]
[ROW][C]26[/C][C]0.127486[/C][C]1.7984[/C][C]0.036813[/C][/ROW]
[ROW][C]27[/C][C]-0.035129[/C][C]-0.4955[/C][C]0.31038[/C][/ROW]
[ROW][C]28[/C][C]0.009791[/C][C]0.1381[/C][C]0.445144[/C][/ROW]
[ROW][C]29[/C][C]-0.02423[/C][C]-0.3418[/C][C]0.366431[/C][/ROW]
[ROW][C]30[/C][C]-0.009096[/C][C]-0.1283[/C][C]0.449015[/C][/ROW]
[ROW][C]31[/C][C]-0.035675[/C][C]-0.5033[/C][C]0.307671[/C][/ROW]
[ROW][C]32[/C][C]0.141369[/C][C]1.9943[/C][C]0.023745[/C][/ROW]
[ROW][C]33[/C][C]-0.136727[/C][C]-1.9288[/C][C]0.027591[/C][/ROW]
[ROW][C]34[/C][C]0.089371[/C][C]1.2607[/C][C]0.10444[/C][/ROW]
[ROW][C]35[/C][C]-0.019379[/C][C]-0.2734[/C][C]0.392424[/C][/ROW]
[ROW][C]36[/C][C]-0.168123[/C][C]-2.3717[/C][C]0.009331[/C][/ROW]
[ROW][C]37[/C][C]0.23305[/C][C]3.2876[/C][C]0.000597[/C][/ROW]
[ROW][C]38[/C][C]-0.054825[/C][C]-0.7734[/C][C]0.220101[/C][/ROW]
[ROW][C]39[/C][C]-0.012168[/C][C]-0.1716[/C][C]0.431944[/C][/ROW]
[ROW][C]40[/C][C]0.009354[/C][C]0.132[/C][C]0.447575[/C][/ROW]
[ROW][C]41[/C][C]-0.001667[/C][C]-0.0235[/C][C]0.490628[/C][/ROW]
[ROW][C]42[/C][C]-0.071761[/C][C]-1.0123[/C][C]0.156309[/C][/ROW]
[ROW][C]43[/C][C]0.047869[/C][C]0.6753[/C][C]0.250141[/C][/ROW]
[ROW][C]44[/C][C]0.094325[/C][C]1.3306[/C][C]0.092418[/C][/ROW]
[ROW][C]45[/C][C]-0.168602[/C][C]-2.3784[/C][C]0.009166[/C][/ROW]
[ROW][C]46[/C][C]0.139911[/C][C]1.9737[/C][C]0.0249[/C][/ROW]
[ROW][C]47[/C][C]-0.038491[/C][C]-0.543[/C][C]0.293875[/C][/ROW]
[ROW][C]48[/C][C]-0.033633[/C][C]-0.4745[/C][C]0.317848[/C][/ROW]
[/TABLE]
Source: https://freestatistics.org/blog/index.php?pk=310104&T=1

Globally Unique Identifier (entire table): ba.freestatistics.org/blog/index.php?pk=310104&T=1

As an alternative you can also use a QR Code:  

The GUIDs for individual cells are displayed in the table below:

Autocorrelation Function
Time lag kACF(k)T-STATP-value
1-0.399734-5.63890
2-0.186737-2.63430.004548
30.1672062.35870.009653
4-0.12303-1.73550.042096
50.0363880.51330.304149
60.0962631.3580.088008
7-0.035459-0.50020.30874
8-0.066071-0.93210.17622
90.0030810.04350.482686
100.0599750.8460.199271
110.1431522.01940.022393
12-0.28786-4.06083.5e-05
130.0021130.02980.488123
140.1637842.31050.010944
15-0.079839-1.12630.130705
16-0.051974-0.73320.232153
170.1196311.68760.046528
18-0.034279-0.48360.314612
19-0.128004-1.80570.036237
200.1092841.54160.062375
210.0906071.27820.101339
22-0.247358-3.48940.000298
230.2152513.03650.001357
24-0.078099-1.10170.135955
25-0.080472-1.13520.12883
260.1274861.79840.036813
27-0.035129-0.49550.31038
280.0097910.13810.445144
29-0.02423-0.34180.366431
30-0.009096-0.12830.449015
31-0.035675-0.50330.307671
320.1413691.99430.023745
33-0.136727-1.92880.027591
340.0893711.26070.10444
35-0.019379-0.27340.392424
36-0.168123-2.37170.009331
370.233053.28760.000597
38-0.054825-0.77340.220101
39-0.012168-0.17160.431944
400.0093540.1320.447575
41-0.001667-0.02350.490628
42-0.071761-1.01230.156309
430.0478690.67530.250141
440.0943251.33060.092418
45-0.168602-2.37840.009166
460.1399111.97370.0249
47-0.038491-0.5430.293875
48-0.033633-0.47450.317848


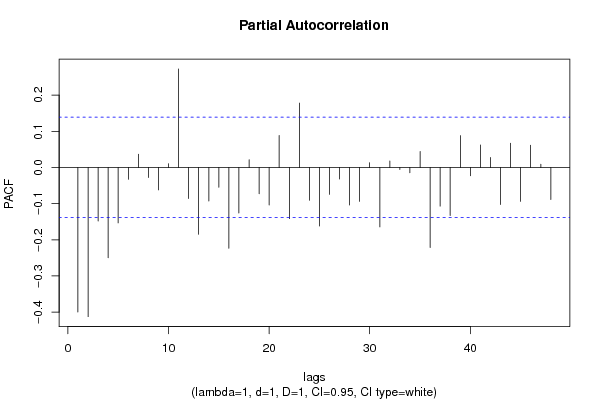
Partial Autocorrelation Function
Time lag kPACF(k)T-STATP-value
1-0.399734-5.63890
2-0.412425-5.8180
3-0.147836-2.08550.019151
4-0.249433-3.51870.000269
5-0.153161-2.16060.015961
6-0.032448-0.45770.323823
70.0367580.51850.30233
8-0.027624-0.38970.348593
9-0.062104-0.87610.191019
100.0102860.14510.442386
110.2723123.84148.2e-05
12-0.085701-1.2090.114055
13-0.184456-2.60210.004981
14-0.092709-1.30780.096221
15-0.05481-0.77320.220164
16-0.223599-3.15420.000929
17-0.125923-1.77640.038601
180.0212550.29980.382306
19-0.072897-1.02830.152518
20-0.103945-1.46630.072069
210.0883871.24690.106959
22-0.141509-1.99620.023636
230.1778362.50870.006458
24-0.090791-1.28080.100883
25-0.162072-2.28630.011645
26-0.074496-1.05090.147292
27-0.031741-0.44780.327404
28-0.104043-1.46770.071882
29-0.093868-1.32420.093484
300.0131020.18480.426779
31-0.16433-2.31820.010729
320.0178990.25250.400458
33-0.005732-0.08090.467817
34-0.014503-0.20460.419048
350.0443710.62590.266041
36-0.221247-3.12110.001035
37-0.106878-1.50770.066609
38-0.132742-1.87260.031298
390.0879831.24120.108004
40-0.02289-0.32290.373553
410.0622450.87810.190481
420.0273190.38540.350184
43-0.102372-1.44410.075136
440.0667360.94140.173813
45-0.093736-1.32230.093792
460.0614190.86640.193651
470.0088510.12490.450379
48-0.088485-1.24820.106706

\begin{tabular}{lllllllll}
\hline
Partial Autocorrelation Function \tabularnewline
Time lag k & PACF(k) & T-STAT & P-value \tabularnewline
1 & -0.399734 & -5.6389 & 0 \tabularnewline
2 & -0.412425 & -5.818 & 0 \tabularnewline
3 & -0.147836 & -2.0855 & 0.019151 \tabularnewline
4 & -0.249433 & -3.5187 & 0.000269 \tabularnewline
5 & -0.153161 & -2.1606 & 0.015961 \tabularnewline
6 & -0.032448 & -0.4577 & 0.323823 \tabularnewline
7 & 0.036758 & 0.5185 & 0.30233 \tabularnewline
8 & -0.027624 & -0.3897 & 0.348593 \tabularnewline
9 & -0.062104 & -0.8761 & 0.191019 \tabularnewline
10 & 0.010286 & 0.1451 & 0.442386 \tabularnewline
11 & 0.272312 & 3.8414 & 8.2e-05 \tabularnewline
12 & -0.085701 & -1.209 & 0.114055 \tabularnewline
13 & -0.184456 & -2.6021 & 0.004981 \tabularnewline
14 & -0.092709 & -1.3078 & 0.096221 \tabularnewline
15 & -0.05481 & -0.7732 & 0.220164 \tabularnewline
16 & -0.223599 & -3.1542 & 0.000929 \tabularnewline
17 & -0.125923 & -1.7764 & 0.038601 \tabularnewline
18 & 0.021255 & 0.2998 & 0.382306 \tabularnewline
19 & -0.072897 & -1.0283 & 0.152518 \tabularnewline
20 & -0.103945 & -1.4663 & 0.072069 \tabularnewline
21 & 0.088387 & 1.2469 & 0.106959 \tabularnewline
22 & -0.141509 & -1.9962 & 0.023636 \tabularnewline
23 & 0.177836 & 2.5087 & 0.006458 \tabularnewline
24 & -0.090791 & -1.2808 & 0.100883 \tabularnewline
25 & -0.162072 & -2.2863 & 0.011645 \tabularnewline
26 & -0.074496 & -1.0509 & 0.147292 \tabularnewline
27 & -0.031741 & -0.4478 & 0.327404 \tabularnewline
28 & -0.104043 & -1.4677 & 0.071882 \tabularnewline
29 & -0.093868 & -1.3242 & 0.093484 \tabularnewline
30 & 0.013102 & 0.1848 & 0.426779 \tabularnewline
31 & -0.16433 & -2.3182 & 0.010729 \tabularnewline
32 & 0.017899 & 0.2525 & 0.400458 \tabularnewline
33 & -0.005732 & -0.0809 & 0.467817 \tabularnewline
34 & -0.014503 & -0.2046 & 0.419048 \tabularnewline
35 & 0.044371 & 0.6259 & 0.266041 \tabularnewline
36 & -0.221247 & -3.1211 & 0.001035 \tabularnewline
37 & -0.106878 & -1.5077 & 0.066609 \tabularnewline
38 & -0.132742 & -1.8726 & 0.031298 \tabularnewline
39 & 0.087983 & 1.2412 & 0.108004 \tabularnewline
40 & -0.02289 & -0.3229 & 0.373553 \tabularnewline
41 & 0.062245 & 0.8781 & 0.190481 \tabularnewline
42 & 0.027319 & 0.3854 & 0.350184 \tabularnewline
43 & -0.102372 & -1.4441 & 0.075136 \tabularnewline
44 & 0.066736 & 0.9414 & 0.173813 \tabularnewline
45 & -0.093736 & -1.3223 & 0.093792 \tabularnewline
46 & 0.061419 & 0.8664 & 0.193651 \tabularnewline
47 & 0.008851 & 0.1249 & 0.450379 \tabularnewline
48 & -0.088485 & -1.2482 & 0.106706 \tabularnewline
\hline
\end{tabular}
%Source: https://freestatistics.org/blog/index.php?pk=310104&T=2

[TABLE]
[ROW][C]Partial Autocorrelation Function[/C][/ROW]
[ROW][C]Time lag k[/C][C]PACF(k)[/C][C]T-STAT[/C][C]P-value[/C][/ROW]
[ROW][C]1[/C][C]-0.399734[/C][C]-5.6389[/C][C]0[/C][/ROW]
[ROW][C]2[/C][C]-0.412425[/C][C]-5.818[/C][C]0[/C][/ROW]
[ROW][C]3[/C][C]-0.147836[/C][C]-2.0855[/C][C]0.019151[/C][/ROW]
[ROW][C]4[/C][C]-0.249433[/C][C]-3.5187[/C][C]0.000269[/C][/ROW]
[ROW][C]5[/C][C]-0.153161[/C][C]-2.1606[/C][C]0.015961[/C][/ROW]
[ROW][C]6[/C][C]-0.032448[/C][C]-0.4577[/C][C]0.323823[/C][/ROW]
[ROW][C]7[/C][C]0.036758[/C][C]0.5185[/C][C]0.30233[/C][/ROW]
[ROW][C]8[/C][C]-0.027624[/C][C]-0.3897[/C][C]0.348593[/C][/ROW]
[ROW][C]9[/C][C]-0.062104[/C][C]-0.8761[/C][C]0.191019[/C][/ROW]
[ROW][C]10[/C][C]0.010286[/C][C]0.1451[/C][C]0.442386[/C][/ROW]
[ROW][C]11[/C][C]0.272312[/C][C]3.8414[/C][C]8.2e-05[/C][/ROW]
[ROW][C]12[/C][C]-0.085701[/C][C]-1.209[/C][C]0.114055[/C][/ROW]
[ROW][C]13[/C][C]-0.184456[/C][C]-2.6021[/C][C]0.004981[/C][/ROW]
[ROW][C]14[/C][C]-0.092709[/C][C]-1.3078[/C][C]0.096221[/C][/ROW]
[ROW][C]15[/C][C]-0.05481[/C][C]-0.7732[/C][C]0.220164[/C][/ROW]
[ROW][C]16[/C][C]-0.223599[/C][C]-3.1542[/C][C]0.000929[/C][/ROW]
[ROW][C]17[/C][C]-0.125923[/C][C]-1.7764[/C][C]0.038601[/C][/ROW]
[ROW][C]18[/C][C]0.021255[/C][C]0.2998[/C][C]0.382306[/C][/ROW]
[ROW][C]19[/C][C]-0.072897[/C][C]-1.0283[/C][C]0.152518[/C][/ROW]
[ROW][C]20[/C][C]-0.103945[/C][C]-1.4663[/C][C]0.072069[/C][/ROW]
[ROW][C]21[/C][C]0.088387[/C][C]1.2469[/C][C]0.106959[/C][/ROW]
[ROW][C]22[/C][C]-0.141509[/C][C]-1.9962[/C][C]0.023636[/C][/ROW]
[ROW][C]23[/C][C]0.177836[/C][C]2.5087[/C][C]0.006458[/C][/ROW]
[ROW][C]24[/C][C]-0.090791[/C][C]-1.2808[/C][C]0.100883[/C][/ROW]
[ROW][C]25[/C][C]-0.162072[/C][C]-2.2863[/C][C]0.011645[/C][/ROW]
[ROW][C]26[/C][C]-0.074496[/C][C]-1.0509[/C][C]0.147292[/C][/ROW]
[ROW][C]27[/C][C]-0.031741[/C][C]-0.4478[/C][C]0.327404[/C][/ROW]
[ROW][C]28[/C][C]-0.104043[/C][C]-1.4677[/C][C]0.071882[/C][/ROW]
[ROW][C]29[/C][C]-0.093868[/C][C]-1.3242[/C][C]0.093484[/C][/ROW]
[ROW][C]30[/C][C]0.013102[/C][C]0.1848[/C][C]0.426779[/C][/ROW]
[ROW][C]31[/C][C]-0.16433[/C][C]-2.3182[/C][C]0.010729[/C][/ROW]
[ROW][C]32[/C][C]0.017899[/C][C]0.2525[/C][C]0.400458[/C][/ROW]
[ROW][C]33[/C][C]-0.005732[/C][C]-0.0809[/C][C]0.467817[/C][/ROW]
[ROW][C]34[/C][C]-0.014503[/C][C]-0.2046[/C][C]0.419048[/C][/ROW]
[ROW][C]35[/C][C]0.044371[/C][C]0.6259[/C][C]0.266041[/C][/ROW]
[ROW][C]36[/C][C]-0.221247[/C][C]-3.1211[/C][C]0.001035[/C][/ROW]
[ROW][C]37[/C][C]-0.106878[/C][C]-1.5077[/C][C]0.066609[/C][/ROW]
[ROW][C]38[/C][C]-0.132742[/C][C]-1.8726[/C][C]0.031298[/C][/ROW]
[ROW][C]39[/C][C]0.087983[/C][C]1.2412[/C][C]0.108004[/C][/ROW]
[ROW][C]40[/C][C]-0.02289[/C][C]-0.3229[/C][C]0.373553[/C][/ROW]
[ROW][C]41[/C][C]0.062245[/C][C]0.8781[/C][C]0.190481[/C][/ROW]
[ROW][C]42[/C][C]0.027319[/C][C]0.3854[/C][C]0.350184[/C][/ROW]
[ROW][C]43[/C][C]-0.102372[/C][C]-1.4441[/C][C]0.075136[/C][/ROW]
[ROW][C]44[/C][C]0.066736[/C][C]0.9414[/C][C]0.173813[/C][/ROW]
[ROW][C]45[/C][C]-0.093736[/C][C]-1.3223[/C][C]0.093792[/C][/ROW]
[ROW][C]46[/C][C]0.061419[/C][C]0.8664[/C][C]0.193651[/C][/ROW]
[ROW][C]47[/C][C]0.008851[/C][C]0.1249[/C][C]0.450379[/C][/ROW]
[ROW][C]48[/C][C]-0.088485[/C][C]-1.2482[/C][C]0.106706[/C][/ROW]
[/TABLE]
Source: https://freestatistics.org/blog/index.php?pk=310104&T=2

Globally Unique Identifier (entire table): ba.freestatistics.org/blog/index.php?pk=310104&T=2

As an alternative you can also use a QR Code:  

The GUIDs for individual cells are displayed in the table below:

Partial Autocorrelation Function
Time lag kPACF(k)T-STATP-value
1-0.399734-5.63890
2-0.412425-5.8180
3-0.147836-2.08550.019151
4-0.249433-3.51870.000269
5-0.153161-2.16060.015961
6-0.032448-0.45770.323823
70.0367580.51850.30233
8-0.027624-0.38970.348593
9-0.062104-0.87610.191019
100.0102860.14510.442386
110.2723123.84148.2e-05
12-0.085701-1.2090.114055
13-0.184456-2.60210.004981
14-0.092709-1.30780.096221
15-0.05481-0.77320.220164
16-0.223599-3.15420.000929
17-0.125923-1.77640.038601
180.0212550.29980.382306
19-0.072897-1.02830.152518
20-0.103945-1.46630.072069
210.0883871.24690.106959
22-0.141509-1.99620.023636
230.1778362.50870.006458
24-0.090791-1.28080.100883
25-0.162072-2.28630.011645
26-0.074496-1.05090.147292
27-0.031741-0.44780.327404
28-0.104043-1.46770.071882
29-0.093868-1.32420.093484
300.0131020.18480.426779
31-0.16433-2.31820.010729
320.0178990.25250.400458
33-0.005732-0.08090.467817
34-0.014503-0.20460.419048
350.0443710.62590.266041
36-0.221247-3.12110.001035
37-0.106878-1.50770.066609
38-0.132742-1.87260.031298
390.0879831.24120.108004
40-0.02289-0.32290.373553
410.0622450.87810.190481
420.0273190.38540.350184
43-0.102372-1.44410.075136
440.0667360.94140.173813
45-0.093736-1.32230.093792
460.0614190.86640.193651
470.0088510.12490.450379
48-0.088485-1.24820.106706


Parameters (Session):
par1 = 48 ; par2 = 1 ; par3 = 1 ; par4 = 1 ; par5 = 12 ; par6 = White Noise ; par7 = 0.95 ;
Parameters (R input):
par1 = 48 ; par2 = 1 ; par3 = 1 ; par4 = 1 ; par5 = 12 ; par6 = White Noise ; par7 = 0.95 ; par8 = ;
R code (references can be found in the software module):
if (par1 == 'Default') {
par1 = 10*log10(length(x))
} else {
par1 <- as.numeric(par1)
}
par2 <- as.numeric(par2)
par3 <- as.numeric(par3)
par4 <- as.numeric(par4)
par5 <- as.numeric(par5)
if (par6 == 'White Noise') par6 <- 'white' else par6 <- 'ma'
par7 <- as.numeric(par7)
if (par8 != '') par8 <- as.numeric(par8)
x <- na.omit(x)
ox <- x
if (par8 == '') {
if (par2 == 0) {
x <- log(x)
} else {
x <- (x ^ par2 - 1) / par2
}
} else {
x <- log(x,base=par8)
}
if (par3 > 0) x <- diff(x,lag=1,difference=par3)
if (par4 > 0) x <- diff(x,lag=par5,difference=par4)
bitmap(file='picts.png')
op <- par(mfrow=c(2,1))
plot(ox,type='l',main='Original Time Series',xlab='time',ylab='value')
if (par8=='') {
mytitle <- paste('Working Time Series (lambda=',par2,', d=',par3,', D=',par4,')',sep='')
mysub <- paste('(lambda=',par2,', d=',par3,', D=',par4,', CI=', par7, ', CI type=',par6,')',sep='')
} else {
mytitle <- paste('Working Time Series (base=',par8,', d=',par3,', D=',par4,')',sep='')
mysub <- paste('(base=',par8,', d=',par3,', D=',par4,', CI=', par7, ', CI type=',par6,')',sep='')
}
plot(x,type='l', main=mytitle,xlab='time',ylab='value')
par(op)
dev.off()
bitmap(file='pic1.png')
racf <- acf(x, par1, main='Autocorrelation', xlab='time lag', ylab='ACF', ci.type=par6, ci=par7, sub=mysub)
dev.off()
bitmap(file='pic2.png')
rpacf <- pacf(x,par1,main='Partial Autocorrelation',xlab='lags',ylab='PACF',sub=mysub)
dev.off()
(myacf <- c(racf$acf))
(mypacf <- c(rpacf$acf))
lengthx <- length(x)
sqrtn <- sqrt(lengthx)
load(file='createtable')
a<-table.start()
a<-table.row.start(a)
a<-table.element(a,'Autocorrelation Function',4,TRUE)
a<-table.row.end(a)
a<-table.row.start(a)
a<-table.element(a,'Time lag k',header=TRUE)
a<-table.element(a,'ACF(k)',header=TRUE)
a<-table.element(a,'T-STAT',header=TRUE)
a<-table.element(a,'P-value',header=TRUE)
a<-table.row.end(a)
for (i in 2:(par1+1)) {
a<-table.row.start(a)
a<-table.element(a,i-1,header=TRUE)
a<-table.element(a,round(myacf[i],6))
mytstat <- myacf[i]*sqrtn
a<-table.element(a,round(mytstat,4))
a<-table.element(a,round(1-pt(abs(mytstat),lengthx),6))
a<-table.row.end(a)
}
a<-table.end(a)
table.save(a,file='mytable.tab')
a<-table.start()
a<-table.row.start(a)
a<-table.element(a,'Partial Autocorrelation Function',4,TRUE)
a<-table.row.end(a)
a<-table.row.start(a)
a<-table.element(a,'Time lag k',header=TRUE)
a<-table.element(a,'PACF(k)',header=TRUE)
a<-table.element(a,'T-STAT',header=TRUE)
a<-table.element(a,'P-value',header=TRUE)
a<-table.row.end(a)
for (i in 1:par1) {
a<-table.row.start(a)
a<-table.element(a,i,header=TRUE)
a<-table.element(a,round(mypacf[i],6))
mytstat <- mypacf[i]*sqrtn
a<-table.element(a,round(mytstat,4))
a<-table.element(a,round(1-pt(abs(mytstat),lengthx),6))
a<-table.row.end(a)
}
a<-table.end(a)
table.save(a,file='mytable1.tab')