Free Statistics

of Irreproducible Research!

Author's title

Author*The author of this computation has been verified*
R Software Modulerwasp_autocorrelation.wasp
Title produced by software(Partial) Autocorrelation Function
Date of computationSun, 17 Dec 2017 23:08:02 +0100
Cite this page as followsStatistical Computations at FreeStatistics.org, Office for Research Development and Education, URL https://freestatistics.org/blog/index.php?v=date/2017/Dec/17/t1513548852di3a0or3v2zq64d.htm/, Retrieved Thu, 16 May 2024 03:18:23 +0000
Statistical Computations at FreeStatistics.org, Office for Research Development and Education, URL https://freestatistics.org/blog/index.php?pk=310081, Retrieved Thu, 16 May 2024 03:18:23 +0000
QR Codes:

Original text written by user:
IsPrivate?No (this computation is public)
User-defined keywords
Estimated Impact53
Family? (F = Feedback message, R = changed R code, M = changed R Module, P = changed Parameters, D = changed Data)
-       [(Partial) Autocorrelation Function] [Datareeks 3.1 - (...] [2017-12-17 22:08:02] [228f385b091a4ec8014a0b8722ae7714] [Current]
Feedback Forum

Post a new message
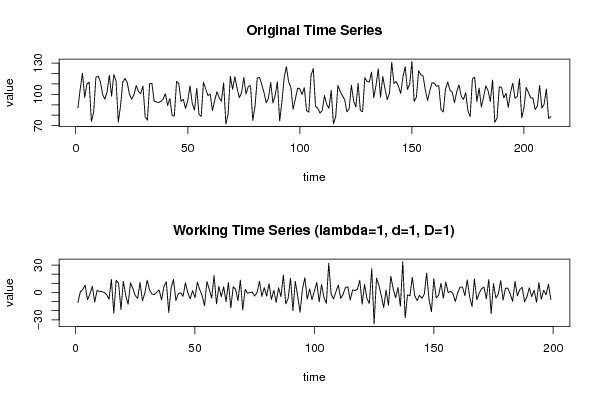
Dataseries X:
87.1
105
120.3
97
109.9
111.7
74
82.8
116.1
117.6
112.2
100
95.4
102.3
118.3
98.2
119
112.8
73.3
89
111.8
115.4
111.2
99.9
95.2
99.8
108.5
102.7
100.7
107.9
78.5
75.3
110.4
110.5
93.4
92.7
92.2
93.3
95.5
100.6
89.3
96
80
79.1
112.4
110.2
93.3
95.3
86.5
94.1
108.2
91.3
84.9
105.9
81
78.8
111.7
105.3
98.8
100.3
84.5
94.1
102.5
96.8
93.4
111
71.5
81.2
117.3
104.8
116.9
105.9
96.8
101.6
116.2
100.3
107.7
108.4
75.1
88.3
115.4
116.4
109.5
101.8
91.9
96.5
111.5
91.7
99
112
74.4
92.8
115.9
126.6
112
106.6
85.8
95.6
106
105.3
100
106.4
84.5
82.9
118.3
124.8
88.5
86.7
82
84.6
98.9
90.3
86.6
103.9
71.7
78.7
108.5
102.9
98.7
95
83.2
86.3
108.8
93.8
87.9
110.6
84.6
83.3
115.9
112.4
111.8
121.4
96.8
108.7
124.4
97.2
117.3
105.3
94.9
101.4
130.6
110.4
112.3
107.8
100.9
116.7
126.5
104.7
109.6
131.5
93.3
97.1
122.6
119
117.5
104.1
94.1
103.5
111.3
110.7
107.7
108.5
85.4
83.2
105.4
111.8
104
102.1
92
102.5
109.1
98.5
95.1
101.6
84.4
78.7
114.7
116.4
93.2
106
87.9
97.5
108.2
103.5
93.1
113.7
73.2
77.3
107.1
106.9
96.6
101
87.5
101.8
110.8
96.3
97.9
114.8
77.4
87
106.6
101.8
96.6
96.4
85.4
88.9
108.6
86.7
90.7
105.1
76.8
78.7


Summary of computational transaction
Raw Input view raw input (R code)
Raw Outputview raw output of R engine
Computing time2 seconds
R ServerBig Analytics Cloud Computing Center

\begin{tabular}{lllllllll}
\hline
Summary of computational transaction \tabularnewline
Raw Input view raw input (R code)  \tabularnewline
Raw Outputview raw output of R engine  \tabularnewline
Computing time2 seconds \tabularnewline
R ServerBig Analytics Cloud Computing Center \tabularnewline
\hline
\end{tabular}
%Source: https://freestatistics.org/blog/index.php?pk=310081&T=0

[TABLE]
[ROW]
Summary of computational transaction[/C][/ROW] [ROW]Raw Input[/C] view raw input (R code) [/C][/ROW] [ROW]Raw Output[/C]view raw output of R engine [/C][/ROW] [ROW]Computing time[/C]2 seconds[/C][/ROW] [ROW]R Server[/C]Big Analytics Cloud Computing Center[/C][/ROW] [/TABLE] Source: https://freestatistics.org/blog/index.php?pk=310081&T=0

Globally Unique Identifier (entire table): ba.freestatistics.org/blog/index.php?pk=310081&T=0

As an alternative you can also use a QR Code:  

The GUIDs for individual cells are displayed in the table below:

Summary of computational transaction
Raw Input view raw input (R code)
Raw Outputview raw output of R engine
Computing time2 seconds
R ServerBig Analytics Cloud Computing Center


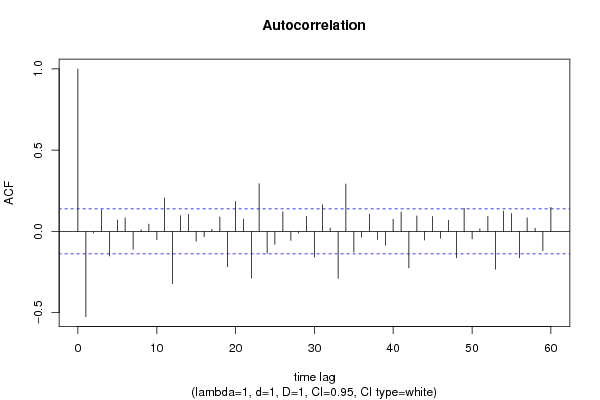
Autocorrelation Function
Time lag kACF(k)T-STATP-value
1-0.524641-7.4010
2-0.009019-0.12720.449445
30.1339251.88930.030156
4-0.150798-2.12730.017314
50.0693920.97890.164412
60.0836381.17990.119733
7-0.109903-1.55040.061321
80.0108230.15270.439406
90.0447280.6310.264391
10-0.051306-0.72380.235032
110.205962.90540.002041
12-0.321507-4.53545e-06
130.0974531.37470.085378
140.1047721.4780.070495
15-0.060793-0.85760.196076
16-0.032782-0.46240.322135
170.0127530.17990.428706
180.0884321.24750.106841
19-0.217363-3.06630.001234
200.1841512.59780.005042
210.0764421.07830.141092
22-0.286573-4.04263.8e-05
230.2932414.13672.6e-05
24-0.134977-1.90410.029171
25-0.079166-1.11680.132718
260.1206211.70160.045199
27-0.055251-0.77940.21833
28-0.009904-0.13970.444514
290.0939211.32490.093359
30-0.157399-2.22040.01376
310.1639042.31210.010896
320.0214460.30250.38128
33-0.288369-4.06793.4e-05
340.2924654.12572.7e-05
35-0.126277-1.78140.038189
36-0.036069-0.50880.305725
370.1058471.49320.06849
38-0.049023-0.69150.245014
39-0.085085-1.20030.11573
400.0747061.05390.146614
410.1189181.67750.047503
42-0.224327-3.16450.000899
430.0953751.34540.090009
44-0.052691-0.74330.22909
450.0923261.30240.097139
46-0.041979-0.59220.277199
470.0680550.960.169101
48-0.161775-2.28210.01177
490.1425782.01130.022821
50-0.04474-0.63110.264336
510.0156790.22120.412588
520.0919871.29760.097957
53-0.232063-3.27370.000626
540.1250151.76350.039671
550.1100991.55310.060989
56-0.162034-2.28580.01166
570.0835831.17910.119887
580.0200490.28280.388799
59-0.118144-1.66660.048581
600.1479552.08720.019073

\begin{tabular}{lllllllll}
\hline
Autocorrelation Function \tabularnewline
Time lag k & ACF(k) & T-STAT & P-value \tabularnewline
1 & -0.524641 & -7.401 & 0 \tabularnewline
2 & -0.009019 & -0.1272 & 0.449445 \tabularnewline
3 & 0.133925 & 1.8893 & 0.030156 \tabularnewline
4 & -0.150798 & -2.1273 & 0.017314 \tabularnewline
5 & 0.069392 & 0.9789 & 0.164412 \tabularnewline
6 & 0.083638 & 1.1799 & 0.119733 \tabularnewline
7 & -0.109903 & -1.5504 & 0.061321 \tabularnewline
8 & 0.010823 & 0.1527 & 0.439406 \tabularnewline
9 & 0.044728 & 0.631 & 0.264391 \tabularnewline
10 & -0.051306 & -0.7238 & 0.235032 \tabularnewline
11 & 0.20596 & 2.9054 & 0.002041 \tabularnewline
12 & -0.321507 & -4.5354 & 5e-06 \tabularnewline
13 & 0.097453 & 1.3747 & 0.085378 \tabularnewline
14 & 0.104772 & 1.478 & 0.070495 \tabularnewline
15 & -0.060793 & -0.8576 & 0.196076 \tabularnewline
16 & -0.032782 & -0.4624 & 0.322135 \tabularnewline
17 & 0.012753 & 0.1799 & 0.428706 \tabularnewline
18 & 0.088432 & 1.2475 & 0.106841 \tabularnewline
19 & -0.217363 & -3.0663 & 0.001234 \tabularnewline
20 & 0.184151 & 2.5978 & 0.005042 \tabularnewline
21 & 0.076442 & 1.0783 & 0.141092 \tabularnewline
22 & -0.286573 & -4.0426 & 3.8e-05 \tabularnewline
23 & 0.293241 & 4.1367 & 2.6e-05 \tabularnewline
24 & -0.134977 & -1.9041 & 0.029171 \tabularnewline
25 & -0.079166 & -1.1168 & 0.132718 \tabularnewline
26 & 0.120621 & 1.7016 & 0.045199 \tabularnewline
27 & -0.055251 & -0.7794 & 0.21833 \tabularnewline
28 & -0.009904 & -0.1397 & 0.444514 \tabularnewline
29 & 0.093921 & 1.3249 & 0.093359 \tabularnewline
30 & -0.157399 & -2.2204 & 0.01376 \tabularnewline
31 & 0.163904 & 2.3121 & 0.010896 \tabularnewline
32 & 0.021446 & 0.3025 & 0.38128 \tabularnewline
33 & -0.288369 & -4.0679 & 3.4e-05 \tabularnewline
34 & 0.292465 & 4.1257 & 2.7e-05 \tabularnewline
35 & -0.126277 & -1.7814 & 0.038189 \tabularnewline
36 & -0.036069 & -0.5088 & 0.305725 \tabularnewline
37 & 0.105847 & 1.4932 & 0.06849 \tabularnewline
38 & -0.049023 & -0.6915 & 0.245014 \tabularnewline
39 & -0.085085 & -1.2003 & 0.11573 \tabularnewline
40 & 0.074706 & 1.0539 & 0.146614 \tabularnewline
41 & 0.118918 & 1.6775 & 0.047503 \tabularnewline
42 & -0.224327 & -3.1645 & 0.000899 \tabularnewline
43 & 0.095375 & 1.3454 & 0.090009 \tabularnewline
44 & -0.052691 & -0.7433 & 0.22909 \tabularnewline
45 & 0.092326 & 1.3024 & 0.097139 \tabularnewline
46 & -0.041979 & -0.5922 & 0.277199 \tabularnewline
47 & 0.068055 & 0.96 & 0.169101 \tabularnewline
48 & -0.161775 & -2.2821 & 0.01177 \tabularnewline
49 & 0.142578 & 2.0113 & 0.022821 \tabularnewline
50 & -0.04474 & -0.6311 & 0.264336 \tabularnewline
51 & 0.015679 & 0.2212 & 0.412588 \tabularnewline
52 & 0.091987 & 1.2976 & 0.097957 \tabularnewline
53 & -0.232063 & -3.2737 & 0.000626 \tabularnewline
54 & 0.125015 & 1.7635 & 0.039671 \tabularnewline
55 & 0.110099 & 1.5531 & 0.060989 \tabularnewline
56 & -0.162034 & -2.2858 & 0.01166 \tabularnewline
57 & 0.083583 & 1.1791 & 0.119887 \tabularnewline
58 & 0.020049 & 0.2828 & 0.388799 \tabularnewline
59 & -0.118144 & -1.6666 & 0.048581 \tabularnewline
60 & 0.147955 & 2.0872 & 0.019073 \tabularnewline
\hline
\end{tabular}
%Source: https://freestatistics.org/blog/index.php?pk=310081&T=1

[TABLE]
[ROW][C]Autocorrelation Function[/C][/ROW]
[ROW][C]Time lag k[/C][C]ACF(k)[/C][C]T-STAT[/C][C]P-value[/C][/ROW]
[ROW][C]1[/C][C]-0.524641[/C][C]-7.401[/C][C]0[/C][/ROW]
[ROW][C]2[/C][C]-0.009019[/C][C]-0.1272[/C][C]0.449445[/C][/ROW]
[ROW][C]3[/C][C]0.133925[/C][C]1.8893[/C][C]0.030156[/C][/ROW]
[ROW][C]4[/C][C]-0.150798[/C][C]-2.1273[/C][C]0.017314[/C][/ROW]
[ROW][C]5[/C][C]0.069392[/C][C]0.9789[/C][C]0.164412[/C][/ROW]
[ROW][C]6[/C][C]0.083638[/C][C]1.1799[/C][C]0.119733[/C][/ROW]
[ROW][C]7[/C][C]-0.109903[/C][C]-1.5504[/C][C]0.061321[/C][/ROW]
[ROW][C]8[/C][C]0.010823[/C][C]0.1527[/C][C]0.439406[/C][/ROW]
[ROW][C]9[/C][C]0.044728[/C][C]0.631[/C][C]0.264391[/C][/ROW]
[ROW][C]10[/C][C]-0.051306[/C][C]-0.7238[/C][C]0.235032[/C][/ROW]
[ROW][C]11[/C][C]0.20596[/C][C]2.9054[/C][C]0.002041[/C][/ROW]
[ROW][C]12[/C][C]-0.321507[/C][C]-4.5354[/C][C]5e-06[/C][/ROW]
[ROW][C]13[/C][C]0.097453[/C][C]1.3747[/C][C]0.085378[/C][/ROW]
[ROW][C]14[/C][C]0.104772[/C][C]1.478[/C][C]0.070495[/C][/ROW]
[ROW][C]15[/C][C]-0.060793[/C][C]-0.8576[/C][C]0.196076[/C][/ROW]
[ROW][C]16[/C][C]-0.032782[/C][C]-0.4624[/C][C]0.322135[/C][/ROW]
[ROW][C]17[/C][C]0.012753[/C][C]0.1799[/C][C]0.428706[/C][/ROW]
[ROW][C]18[/C][C]0.088432[/C][C]1.2475[/C][C]0.106841[/C][/ROW]
[ROW][C]19[/C][C]-0.217363[/C][C]-3.0663[/C][C]0.001234[/C][/ROW]
[ROW][C]20[/C][C]0.184151[/C][C]2.5978[/C][C]0.005042[/C][/ROW]
[ROW][C]21[/C][C]0.076442[/C][C]1.0783[/C][C]0.141092[/C][/ROW]
[ROW][C]22[/C][C]-0.286573[/C][C]-4.0426[/C][C]3.8e-05[/C][/ROW]
[ROW][C]23[/C][C]0.293241[/C][C]4.1367[/C][C]2.6e-05[/C][/ROW]
[ROW][C]24[/C][C]-0.134977[/C][C]-1.9041[/C][C]0.029171[/C][/ROW]
[ROW][C]25[/C][C]-0.079166[/C][C]-1.1168[/C][C]0.132718[/C][/ROW]
[ROW][C]26[/C][C]0.120621[/C][C]1.7016[/C][C]0.045199[/C][/ROW]
[ROW][C]27[/C][C]-0.055251[/C][C]-0.7794[/C][C]0.21833[/C][/ROW]
[ROW][C]28[/C][C]-0.009904[/C][C]-0.1397[/C][C]0.444514[/C][/ROW]
[ROW][C]29[/C][C]0.093921[/C][C]1.3249[/C][C]0.093359[/C][/ROW]
[ROW][C]30[/C][C]-0.157399[/C][C]-2.2204[/C][C]0.01376[/C][/ROW]
[ROW][C]31[/C][C]0.163904[/C][C]2.3121[/C][C]0.010896[/C][/ROW]
[ROW][C]32[/C][C]0.021446[/C][C]0.3025[/C][C]0.38128[/C][/ROW]
[ROW][C]33[/C][C]-0.288369[/C][C]-4.0679[/C][C]3.4e-05[/C][/ROW]
[ROW][C]34[/C][C]0.292465[/C][C]4.1257[/C][C]2.7e-05[/C][/ROW]
[ROW][C]35[/C][C]-0.126277[/C][C]-1.7814[/C][C]0.038189[/C][/ROW]
[ROW][C]36[/C][C]-0.036069[/C][C]-0.5088[/C][C]0.305725[/C][/ROW]
[ROW][C]37[/C][C]0.105847[/C][C]1.4932[/C][C]0.06849[/C][/ROW]
[ROW][C]38[/C][C]-0.049023[/C][C]-0.6915[/C][C]0.245014[/C][/ROW]
[ROW][C]39[/C][C]-0.085085[/C][C]-1.2003[/C][C]0.11573[/C][/ROW]
[ROW][C]40[/C][C]0.074706[/C][C]1.0539[/C][C]0.146614[/C][/ROW]
[ROW][C]41[/C][C]0.118918[/C][C]1.6775[/C][C]0.047503[/C][/ROW]
[ROW][C]42[/C][C]-0.224327[/C][C]-3.1645[/C][C]0.000899[/C][/ROW]
[ROW][C]43[/C][C]0.095375[/C][C]1.3454[/C][C]0.090009[/C][/ROW]
[ROW][C]44[/C][C]-0.052691[/C][C]-0.7433[/C][C]0.22909[/C][/ROW]
[ROW][C]45[/C][C]0.092326[/C][C]1.3024[/C][C]0.097139[/C][/ROW]
[ROW][C]46[/C][C]-0.041979[/C][C]-0.5922[/C][C]0.277199[/C][/ROW]
[ROW][C]47[/C][C]0.068055[/C][C]0.96[/C][C]0.169101[/C][/ROW]
[ROW][C]48[/C][C]-0.161775[/C][C]-2.2821[/C][C]0.01177[/C][/ROW]
[ROW][C]49[/C][C]0.142578[/C][C]2.0113[/C][C]0.022821[/C][/ROW]
[ROW][C]50[/C][C]-0.04474[/C][C]-0.6311[/C][C]0.264336[/C][/ROW]
[ROW][C]51[/C][C]0.015679[/C][C]0.2212[/C][C]0.412588[/C][/ROW]
[ROW][C]52[/C][C]0.091987[/C][C]1.2976[/C][C]0.097957[/C][/ROW]
[ROW][C]53[/C][C]-0.232063[/C][C]-3.2737[/C][C]0.000626[/C][/ROW]
[ROW][C]54[/C][C]0.125015[/C][C]1.7635[/C][C]0.039671[/C][/ROW]
[ROW][C]55[/C][C]0.110099[/C][C]1.5531[/C][C]0.060989[/C][/ROW]
[ROW][C]56[/C][C]-0.162034[/C][C]-2.2858[/C][C]0.01166[/C][/ROW]
[ROW][C]57[/C][C]0.083583[/C][C]1.1791[/C][C]0.119887[/C][/ROW]
[ROW][C]58[/C][C]0.020049[/C][C]0.2828[/C][C]0.388799[/C][/ROW]
[ROW][C]59[/C][C]-0.118144[/C][C]-1.6666[/C][C]0.048581[/C][/ROW]
[ROW][C]60[/C][C]0.147955[/C][C]2.0872[/C][C]0.019073[/C][/ROW]
[/TABLE]
Source: https://freestatistics.org/blog/index.php?pk=310081&T=1

Globally Unique Identifier (entire table): ba.freestatistics.org/blog/index.php?pk=310081&T=1

As an alternative you can also use a QR Code:  

The GUIDs for individual cells are displayed in the table below:

Autocorrelation Function
Time lag kACF(k)T-STATP-value
1-0.524641-7.4010
2-0.009019-0.12720.449445
30.1339251.88930.030156
4-0.150798-2.12730.017314
50.0693920.97890.164412
60.0836381.17990.119733
7-0.109903-1.55040.061321
80.0108230.15270.439406
90.0447280.6310.264391
10-0.051306-0.72380.235032
110.205962.90540.002041
12-0.321507-4.53545e-06
130.0974531.37470.085378
140.1047721.4780.070495
15-0.060793-0.85760.196076
16-0.032782-0.46240.322135
170.0127530.17990.428706
180.0884321.24750.106841
19-0.217363-3.06630.001234
200.1841512.59780.005042
210.0764421.07830.141092
22-0.286573-4.04263.8e-05
230.2932414.13672.6e-05
24-0.134977-1.90410.029171
25-0.079166-1.11680.132718
260.1206211.70160.045199
27-0.055251-0.77940.21833
28-0.009904-0.13970.444514
290.0939211.32490.093359
30-0.157399-2.22040.01376
310.1639042.31210.010896
320.0214460.30250.38128
33-0.288369-4.06793.4e-05
340.2924654.12572.7e-05
35-0.126277-1.78140.038189
36-0.036069-0.50880.305725
370.1058471.49320.06849
38-0.049023-0.69150.245014
39-0.085085-1.20030.11573
400.0747061.05390.146614
410.1189181.67750.047503
42-0.224327-3.16450.000899
430.0953751.34540.090009
44-0.052691-0.74330.22909
450.0923261.30240.097139
46-0.041979-0.59220.277199
470.0680550.960.169101
48-0.161775-2.28210.01177
490.1425782.01130.022821
50-0.04474-0.63110.264336
510.0156790.22120.412588
520.0919871.29760.097957
53-0.232063-3.27370.000626
540.1250151.76350.039671
550.1100991.55310.060989
56-0.162034-2.28580.01166
570.0835831.17910.119887
580.0200490.28280.388799
59-0.118144-1.66660.048581
600.1479552.08720.019073


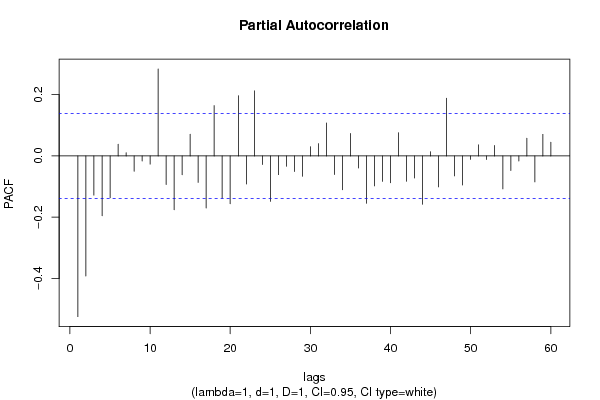
Partial Autocorrelation Function
Time lag kPACF(k)T-STATP-value
1-0.524641-7.4010
2-0.392227-5.5330
3-0.127909-1.80440.036342
4-0.195192-2.75350.003221
5-0.136636-1.92750.027671
60.0382880.54010.294862
70.0107170.15120.439994
8-0.049847-0.70320.241383
9-0.016623-0.23450.407418
10-0.026824-0.37840.352771
110.2840784.00744.3e-05
12-0.093434-1.31810.094501
13-0.175387-2.47410.007096
14-0.061225-0.86370.194401
150.0708780.99990.159296
16-0.08618-1.21570.112765
17-0.169998-2.39810.008702
180.1643112.31790.010736
19-0.137031-1.93310.027324
20-0.155935-2.19970.014489
210.1968562.7770.003005
22-0.091527-1.29110.099075
230.2126392.99960.001524
24-0.027726-0.39110.348064
25-0.148368-2.0930.018809
26-0.06101-0.86070.195232
27-0.033748-0.47610.317271
28-0.050694-0.71510.237683
29-0.066393-0.93660.175053
300.0299860.4230.336373
310.0402570.56790.285376
320.1077721.52030.065011
33-0.060825-0.8580.195951
34-0.11061-1.56030.060134
350.0732581.03340.151327
36-0.039422-0.55610.289379
37-0.154588-2.18070.015188
38-0.097727-1.37860.084782
39-0.083079-1.1720.121305
40-0.087281-1.23120.109843
410.0760741.07320.142251
42-0.082557-1.16460.122784
43-0.07225-1.01920.15467
44-0.15781-2.22620.013562
450.0140110.19770.421759
46-0.101035-1.42530.077821
470.1885792.66020.004223
48-0.065009-0.91710.180111
49-0.094677-1.33560.091606
50-0.011284-0.15920.436845
510.0362150.51090.305003
52-0.011768-0.1660.43416
530.0341430.48160.315292
54-0.107622-1.51820.065276
55-0.047739-0.67340.250725
56-0.016373-0.2310.408787
570.0580340.81870.206977
58-0.084609-1.19360.117037
590.0705470.99520.160426
600.0446640.63010.264689

\begin{tabular}{lllllllll}
\hline
Partial Autocorrelation Function \tabularnewline
Time lag k & PACF(k) & T-STAT & P-value \tabularnewline
1 & -0.524641 & -7.401 & 0 \tabularnewline
2 & -0.392227 & -5.533 & 0 \tabularnewline
3 & -0.127909 & -1.8044 & 0.036342 \tabularnewline
4 & -0.195192 & -2.7535 & 0.003221 \tabularnewline
5 & -0.136636 & -1.9275 & 0.027671 \tabularnewline
6 & 0.038288 & 0.5401 & 0.294862 \tabularnewline
7 & 0.010717 & 0.1512 & 0.439994 \tabularnewline
8 & -0.049847 & -0.7032 & 0.241383 \tabularnewline
9 & -0.016623 & -0.2345 & 0.407418 \tabularnewline
10 & -0.026824 & -0.3784 & 0.352771 \tabularnewline
11 & 0.284078 & 4.0074 & 4.3e-05 \tabularnewline
12 & -0.093434 & -1.3181 & 0.094501 \tabularnewline
13 & -0.175387 & -2.4741 & 0.007096 \tabularnewline
14 & -0.061225 & -0.8637 & 0.194401 \tabularnewline
15 & 0.070878 & 0.9999 & 0.159296 \tabularnewline
16 & -0.08618 & -1.2157 & 0.112765 \tabularnewline
17 & -0.169998 & -2.3981 & 0.008702 \tabularnewline
18 & 0.164311 & 2.3179 & 0.010736 \tabularnewline
19 & -0.137031 & -1.9331 & 0.027324 \tabularnewline
20 & -0.155935 & -2.1997 & 0.014489 \tabularnewline
21 & 0.196856 & 2.777 & 0.003005 \tabularnewline
22 & -0.091527 & -1.2911 & 0.099075 \tabularnewline
23 & 0.212639 & 2.9996 & 0.001524 \tabularnewline
24 & -0.027726 & -0.3911 & 0.348064 \tabularnewline
25 & -0.148368 & -2.093 & 0.018809 \tabularnewline
26 & -0.06101 & -0.8607 & 0.195232 \tabularnewline
27 & -0.033748 & -0.4761 & 0.317271 \tabularnewline
28 & -0.050694 & -0.7151 & 0.237683 \tabularnewline
29 & -0.066393 & -0.9366 & 0.175053 \tabularnewline
30 & 0.029986 & 0.423 & 0.336373 \tabularnewline
31 & 0.040257 & 0.5679 & 0.285376 \tabularnewline
32 & 0.107772 & 1.5203 & 0.065011 \tabularnewline
33 & -0.060825 & -0.858 & 0.195951 \tabularnewline
34 & -0.11061 & -1.5603 & 0.060134 \tabularnewline
35 & 0.073258 & 1.0334 & 0.151327 \tabularnewline
36 & -0.039422 & -0.5561 & 0.289379 \tabularnewline
37 & -0.154588 & -2.1807 & 0.015188 \tabularnewline
38 & -0.097727 & -1.3786 & 0.084782 \tabularnewline
39 & -0.083079 & -1.172 & 0.121305 \tabularnewline
40 & -0.087281 & -1.2312 & 0.109843 \tabularnewline
41 & 0.076074 & 1.0732 & 0.142251 \tabularnewline
42 & -0.082557 & -1.1646 & 0.122784 \tabularnewline
43 & -0.07225 & -1.0192 & 0.15467 \tabularnewline
44 & -0.15781 & -2.2262 & 0.013562 \tabularnewline
45 & 0.014011 & 0.1977 & 0.421759 \tabularnewline
46 & -0.101035 & -1.4253 & 0.077821 \tabularnewline
47 & 0.188579 & 2.6602 & 0.004223 \tabularnewline
48 & -0.065009 & -0.9171 & 0.180111 \tabularnewline
49 & -0.094677 & -1.3356 & 0.091606 \tabularnewline
50 & -0.011284 & -0.1592 & 0.436845 \tabularnewline
51 & 0.036215 & 0.5109 & 0.305003 \tabularnewline
52 & -0.011768 & -0.166 & 0.43416 \tabularnewline
53 & 0.034143 & 0.4816 & 0.315292 \tabularnewline
54 & -0.107622 & -1.5182 & 0.065276 \tabularnewline
55 & -0.047739 & -0.6734 & 0.250725 \tabularnewline
56 & -0.016373 & -0.231 & 0.408787 \tabularnewline
57 & 0.058034 & 0.8187 & 0.206977 \tabularnewline
58 & -0.084609 & -1.1936 & 0.117037 \tabularnewline
59 & 0.070547 & 0.9952 & 0.160426 \tabularnewline
60 & 0.044664 & 0.6301 & 0.264689 \tabularnewline
\hline
\end{tabular}
%Source: https://freestatistics.org/blog/index.php?pk=310081&T=2

[TABLE]
[ROW][C]Partial Autocorrelation Function[/C][/ROW]
[ROW][C]Time lag k[/C][C]PACF(k)[/C][C]T-STAT[/C][C]P-value[/C][/ROW]
[ROW][C]1[/C][C]-0.524641[/C][C]-7.401[/C][C]0[/C][/ROW]
[ROW][C]2[/C][C]-0.392227[/C][C]-5.533[/C][C]0[/C][/ROW]
[ROW][C]3[/C][C]-0.127909[/C][C]-1.8044[/C][C]0.036342[/C][/ROW]
[ROW][C]4[/C][C]-0.195192[/C][C]-2.7535[/C][C]0.003221[/C][/ROW]
[ROW][C]5[/C][C]-0.136636[/C][C]-1.9275[/C][C]0.027671[/C][/ROW]
[ROW][C]6[/C][C]0.038288[/C][C]0.5401[/C][C]0.294862[/C][/ROW]
[ROW][C]7[/C][C]0.010717[/C][C]0.1512[/C][C]0.439994[/C][/ROW]
[ROW][C]8[/C][C]-0.049847[/C][C]-0.7032[/C][C]0.241383[/C][/ROW]
[ROW][C]9[/C][C]-0.016623[/C][C]-0.2345[/C][C]0.407418[/C][/ROW]
[ROW][C]10[/C][C]-0.026824[/C][C]-0.3784[/C][C]0.352771[/C][/ROW]
[ROW][C]11[/C][C]0.284078[/C][C]4.0074[/C][C]4.3e-05[/C][/ROW]
[ROW][C]12[/C][C]-0.093434[/C][C]-1.3181[/C][C]0.094501[/C][/ROW]
[ROW][C]13[/C][C]-0.175387[/C][C]-2.4741[/C][C]0.007096[/C][/ROW]
[ROW][C]14[/C][C]-0.061225[/C][C]-0.8637[/C][C]0.194401[/C][/ROW]
[ROW][C]15[/C][C]0.070878[/C][C]0.9999[/C][C]0.159296[/C][/ROW]
[ROW][C]16[/C][C]-0.08618[/C][C]-1.2157[/C][C]0.112765[/C][/ROW]
[ROW][C]17[/C][C]-0.169998[/C][C]-2.3981[/C][C]0.008702[/C][/ROW]
[ROW][C]18[/C][C]0.164311[/C][C]2.3179[/C][C]0.010736[/C][/ROW]
[ROW][C]19[/C][C]-0.137031[/C][C]-1.9331[/C][C]0.027324[/C][/ROW]
[ROW][C]20[/C][C]-0.155935[/C][C]-2.1997[/C][C]0.014489[/C][/ROW]
[ROW][C]21[/C][C]0.196856[/C][C]2.777[/C][C]0.003005[/C][/ROW]
[ROW][C]22[/C][C]-0.091527[/C][C]-1.2911[/C][C]0.099075[/C][/ROW]
[ROW][C]23[/C][C]0.212639[/C][C]2.9996[/C][C]0.001524[/C][/ROW]
[ROW][C]24[/C][C]-0.027726[/C][C]-0.3911[/C][C]0.348064[/C][/ROW]
[ROW][C]25[/C][C]-0.148368[/C][C]-2.093[/C][C]0.018809[/C][/ROW]
[ROW][C]26[/C][C]-0.06101[/C][C]-0.8607[/C][C]0.195232[/C][/ROW]
[ROW][C]27[/C][C]-0.033748[/C][C]-0.4761[/C][C]0.317271[/C][/ROW]
[ROW][C]28[/C][C]-0.050694[/C][C]-0.7151[/C][C]0.237683[/C][/ROW]
[ROW][C]29[/C][C]-0.066393[/C][C]-0.9366[/C][C]0.175053[/C][/ROW]
[ROW][C]30[/C][C]0.029986[/C][C]0.423[/C][C]0.336373[/C][/ROW]
[ROW][C]31[/C][C]0.040257[/C][C]0.5679[/C][C]0.285376[/C][/ROW]
[ROW][C]32[/C][C]0.107772[/C][C]1.5203[/C][C]0.065011[/C][/ROW]
[ROW][C]33[/C][C]-0.060825[/C][C]-0.858[/C][C]0.195951[/C][/ROW]
[ROW][C]34[/C][C]-0.11061[/C][C]-1.5603[/C][C]0.060134[/C][/ROW]
[ROW][C]35[/C][C]0.073258[/C][C]1.0334[/C][C]0.151327[/C][/ROW]
[ROW][C]36[/C][C]-0.039422[/C][C]-0.5561[/C][C]0.289379[/C][/ROW]
[ROW][C]37[/C][C]-0.154588[/C][C]-2.1807[/C][C]0.015188[/C][/ROW]
[ROW][C]38[/C][C]-0.097727[/C][C]-1.3786[/C][C]0.084782[/C][/ROW]
[ROW][C]39[/C][C]-0.083079[/C][C]-1.172[/C][C]0.121305[/C][/ROW]
[ROW][C]40[/C][C]-0.087281[/C][C]-1.2312[/C][C]0.109843[/C][/ROW]
[ROW][C]41[/C][C]0.076074[/C][C]1.0732[/C][C]0.142251[/C][/ROW]
[ROW][C]42[/C][C]-0.082557[/C][C]-1.1646[/C][C]0.122784[/C][/ROW]
[ROW][C]43[/C][C]-0.07225[/C][C]-1.0192[/C][C]0.15467[/C][/ROW]
[ROW][C]44[/C][C]-0.15781[/C][C]-2.2262[/C][C]0.013562[/C][/ROW]
[ROW][C]45[/C][C]0.014011[/C][C]0.1977[/C][C]0.421759[/C][/ROW]
[ROW][C]46[/C][C]-0.101035[/C][C]-1.4253[/C][C]0.077821[/C][/ROW]
[ROW][C]47[/C][C]0.188579[/C][C]2.6602[/C][C]0.004223[/C][/ROW]
[ROW][C]48[/C][C]-0.065009[/C][C]-0.9171[/C][C]0.180111[/C][/ROW]
[ROW][C]49[/C][C]-0.094677[/C][C]-1.3356[/C][C]0.091606[/C][/ROW]
[ROW][C]50[/C][C]-0.011284[/C][C]-0.1592[/C][C]0.436845[/C][/ROW]
[ROW][C]51[/C][C]0.036215[/C][C]0.5109[/C][C]0.305003[/C][/ROW]
[ROW][C]52[/C][C]-0.011768[/C][C]-0.166[/C][C]0.43416[/C][/ROW]
[ROW][C]53[/C][C]0.034143[/C][C]0.4816[/C][C]0.315292[/C][/ROW]
[ROW][C]54[/C][C]-0.107622[/C][C]-1.5182[/C][C]0.065276[/C][/ROW]
[ROW][C]55[/C][C]-0.047739[/C][C]-0.6734[/C][C]0.250725[/C][/ROW]
[ROW][C]56[/C][C]-0.016373[/C][C]-0.231[/C][C]0.408787[/C][/ROW]
[ROW][C]57[/C][C]0.058034[/C][C]0.8187[/C][C]0.206977[/C][/ROW]
[ROW][C]58[/C][C]-0.084609[/C][C]-1.1936[/C][C]0.117037[/C][/ROW]
[ROW][C]59[/C][C]0.070547[/C][C]0.9952[/C][C]0.160426[/C][/ROW]
[ROW][C]60[/C][C]0.044664[/C][C]0.6301[/C][C]0.264689[/C][/ROW]
[/TABLE]
Source: https://freestatistics.org/blog/index.php?pk=310081&T=2

Globally Unique Identifier (entire table): ba.freestatistics.org/blog/index.php?pk=310081&T=2

As an alternative you can also use a QR Code:  

The GUIDs for individual cells are displayed in the table below:

Partial Autocorrelation Function
Time lag kPACF(k)T-STATP-value
1-0.524641-7.4010
2-0.392227-5.5330
3-0.127909-1.80440.036342
4-0.195192-2.75350.003221
5-0.136636-1.92750.027671
60.0382880.54010.294862
70.0107170.15120.439994
8-0.049847-0.70320.241383
9-0.016623-0.23450.407418
10-0.026824-0.37840.352771
110.2840784.00744.3e-05
12-0.093434-1.31810.094501
13-0.175387-2.47410.007096
14-0.061225-0.86370.194401
150.0708780.99990.159296
16-0.08618-1.21570.112765
17-0.169998-2.39810.008702
180.1643112.31790.010736
19-0.137031-1.93310.027324
20-0.155935-2.19970.014489
210.1968562.7770.003005
22-0.091527-1.29110.099075
230.2126392.99960.001524
24-0.027726-0.39110.348064
25-0.148368-2.0930.018809
26-0.06101-0.86070.195232
27-0.033748-0.47610.317271
28-0.050694-0.71510.237683
29-0.066393-0.93660.175053
300.0299860.4230.336373
310.0402570.56790.285376
320.1077721.52030.065011
33-0.060825-0.8580.195951
34-0.11061-1.56030.060134
350.0732581.03340.151327
36-0.039422-0.55610.289379
37-0.154588-2.18070.015188
38-0.097727-1.37860.084782
39-0.083079-1.1720.121305
40-0.087281-1.23120.109843
410.0760741.07320.142251
42-0.082557-1.16460.122784
43-0.07225-1.01920.15467
44-0.15781-2.22620.013562
450.0140110.19770.421759
46-0.101035-1.42530.077821
470.1885792.66020.004223
48-0.065009-0.91710.180111
49-0.094677-1.33560.091606
50-0.011284-0.15920.436845
510.0362150.51090.305003
52-0.011768-0.1660.43416
530.0341430.48160.315292
54-0.107622-1.51820.065276
55-0.047739-0.67340.250725
56-0.016373-0.2310.408787
570.0580340.81870.206977
58-0.084609-1.19360.117037
590.0705470.99520.160426
600.0446640.63010.264689


Parameters (Session):
par1 = 60 ; par2 = 1 ; par3 = 0 ; par4 = 1 ; par5 = 12 ; par6 = White Noise ; par7 = 0.95 ;
Parameters (R input):
par1 = 60 ; par2 = 1 ; par3 = 1 ; par4 = 1 ; par5 = 12 ; par6 = White Noise ; par7 = 0.95 ; par8 = ;
R code (references can be found in the software module):
if (par1 == 'Default') {
par1 = 10*log10(length(x))
} else {
par1 <- as.numeric(par1)
}
par2 <- as.numeric(par2)
par3 <- as.numeric(par3)
par4 <- as.numeric(par4)
par5 <- as.numeric(par5)
if (par6 == 'White Noise') par6 <- 'white' else par6 <- 'ma'
par7 <- as.numeric(par7)
if (par8 != '') par8 <- as.numeric(par8)
x <- na.omit(x)
ox <- x
if (par8 == '') {
if (par2 == 0) {
x <- log(x)
} else {
x <- (x ^ par2 - 1) / par2
}
} else {
x <- log(x,base=par8)
}
if (par3 > 0) x <- diff(x,lag=1,difference=par3)
if (par4 > 0) x <- diff(x,lag=par5,difference=par4)
bitmap(file='picts.png')
op <- par(mfrow=c(2,1))
plot(ox,type='l',main='Original Time Series',xlab='time',ylab='value')
if (par8=='') {
mytitle <- paste('Working Time Series (lambda=',par2,', d=',par3,', D=',par4,')',sep='')
mysub <- paste('(lambda=',par2,', d=',par3,', D=',par4,', CI=', par7, ', CI type=',par6,')',sep='')
} else {
mytitle <- paste('Working Time Series (base=',par8,', d=',par3,', D=',par4,')',sep='')
mysub <- paste('(base=',par8,', d=',par3,', D=',par4,', CI=', par7, ', CI type=',par6,')',sep='')
}
plot(x,type='l', main=mytitle,xlab='time',ylab='value')
par(op)
dev.off()
bitmap(file='pic1.png')
racf <- acf(x, par1, main='Autocorrelation', xlab='time lag', ylab='ACF', ci.type=par6, ci=par7, sub=mysub)
dev.off()
bitmap(file='pic2.png')
rpacf <- pacf(x,par1,main='Partial Autocorrelation',xlab='lags',ylab='PACF',sub=mysub)
dev.off()
(myacf <- c(racf$acf))
(mypacf <- c(rpacf$acf))
lengthx <- length(x)
sqrtn <- sqrt(lengthx)
load(file='createtable')
a<-table.start()
a<-table.row.start(a)
a<-table.element(a,'Autocorrelation Function',4,TRUE)
a<-table.row.end(a)
a<-table.row.start(a)
a<-table.element(a,'Time lag k',header=TRUE)
a<-table.element(a,'ACF(k)',header=TRUE)
a<-table.element(a,'T-STAT',header=TRUE)
a<-table.element(a,'P-value',header=TRUE)
a<-table.row.end(a)
for (i in 2:(par1+1)) {
a<-table.row.start(a)
a<-table.element(a,i-1,header=TRUE)
a<-table.element(a,round(myacf[i],6))
mytstat <- myacf[i]*sqrtn
a<-table.element(a,round(mytstat,4))
a<-table.element(a,round(1-pt(abs(mytstat),lengthx),6))
a<-table.row.end(a)
}
a<-table.end(a)
table.save(a,file='mytable.tab')
a<-table.start()
a<-table.row.start(a)
a<-table.element(a,'Partial Autocorrelation Function',4,TRUE)
a<-table.row.end(a)
a<-table.row.start(a)
a<-table.element(a,'Time lag k',header=TRUE)
a<-table.element(a,'PACF(k)',header=TRUE)
a<-table.element(a,'T-STAT',header=TRUE)
a<-table.element(a,'P-value',header=TRUE)
a<-table.row.end(a)
for (i in 1:par1) {
a<-table.row.start(a)
a<-table.element(a,i,header=TRUE)
a<-table.element(a,round(mypacf[i],6))
mytstat <- mypacf[i]*sqrtn
a<-table.element(a,round(mytstat,4))
a<-table.element(a,round(1-pt(abs(mytstat),lengthx),6))
a<-table.row.end(a)
}
a<-table.end(a)
table.save(a,file='mytable1.tab')